HAL Id: hal-00295955
https://hal.archives-ouvertes.fr/hal-00295955
Submitted on 29 Jun 2006
HAL is a multi-disciplinary open access
archive for the deposit and dissemination of
sci-entific research documents, whether they are
pub-lished or not. The documents may come from
teaching and research institutions in France or
abroad, or from public or private research centers.
L’archive ouverte pluridisciplinaire HAL, est
destinée au dépôt et à la diffusion de documents
scientifiques de niveau recherche, publiés ou non,
émanant des établissements d’enseignement et de
recherche français ou étrangers, des laboratoires
publics ou privés.
of traffic-related aerosol particles at a busy highway in
Helsinki
A. Virtanen, T. Rönkkö, J. Kannosto, J. Ristimäki, J. M. Mäkelä, J.
Keskinen, T. Pakkanen, R. Hillamo, L. Pirjola, K. Hämeri
To cite this version:
A. Virtanen, T. Rönkkö, J. Kannosto, J. Ristimäki, J. M. Mäkelä, et al.. Winter and summer time
size distributions and densities of traffic-related aerosol particles at a busy highway in Helsinki.
At-mospheric Chemistry and Physics, European Geosciences Union, 2006, 6 (9), pp.2411-2421.
�hal-00295955�
www.atmos-chem-phys.net/6/2411/2006/ © Author(s) 2006. This work is licensed under a Creative Commons License.
Chemistry
and Physics
Winter and summer time size distributions and densities of
traffic-related aerosol particles at a busy highway in Helsinki
A. Virtanen1, T. R¨onkk¨o1, J. Kannosto1, J. Ristim¨aki1, J. M. M¨akel¨a1, J. Keskinen1, T. Pakkanen2, R. Hillamo2, L. Pirjola3,5, and K. H¨ameri4,5
1Tampere University of Technology, Institute of Physics, Aerosol Physics, P.O. Box 692, 33101 Tampere, Finland 2Finnish Meteorological Institute, Air Quality Research, Sahaajankatu 20 E, 00810 Helsinki, Finland
3Helsinki Polytechnics, Department of Technology, P.O. Box 4020, 00099 Helsinki, Finland
4Finnish Institute of Occupational Health, Department of Physics, Topeliuksenkatu 41, 00250 Helsinki, Finland 5University of Helsinki, Department of Physical Sciences, P.O. Box 64, 00014 University of Helsinki, Finland
Received: 23 September 2005 – Published in Atmos. Chem. Phys. Discuss.: 12 January 2006 Revised: 7 April 2006 – Accepted: 15 May 2006 – Published: 29 June 2006
Abstract. Number concentrations and size distributions of traffic related aerosol particles were measured at a road-side in Helsinki during two winter campaigns (10–26 Febru-ary 2003, 28 JanuFebru-ary–12 FebruFebru-ary 2004) and two summer campaigns (12–27 August 2003, 6–20 August 2004). The measurements were performed simultaneously at distances of 9 m and 65 m from the highway. Total number concen-trations were measured by a condensation particle counter (CPC) and particle size distributions by a scanning mobility particle sizer (SMPS) and an electrical low pressure impactor (ELPI). This study concentrates on data that were measured when the wind direction was from the road to the measure-ment site. The total concentrations in the wintertime were 2–3 times higher than in the summertime and the concen-trations were dominated by nucleation mode particles. The particles smaller than 63 nm (aerodynamic diameter) con-stituted ∼90% of all particles in the wintertime and ∼80% of particles in the summer time. The particle total con-centration increased with increasing traffic rate. The effect of traffic rate on particles smaller than 63 nm was stronger than on the larger particles. The particle distributions at the roadside consisted of two distinguishable modes. The geo-metric mean diameter (GMD) of nucleation mode (Mode 1) was 20.3 nm in summer and 18.9 nm in winter. The GMD of the larger mode consisting mostly of traffic related soot particles (Mode 2) was 72.0 nm in summer and 75.1 nm in winter. The GMD values of the modes did not depend on the traffic rate. The average particle density for each mode was determined by a parallel density fitting method based on the size distribution measurement made by ELPI and SMPS. The average density value for Mode 1 particles
Correspondence to: A. Virtanen
(annele.virtanen@tut.fi)
was 1.0±0.13 g/cm3 and 1.0±0.07 g/cm3 both in summer and winter respectively, while the average density value for Mode 2 was 1.5±0.1 g/cm3and 1.8±0.3 g/cm3for summer and winter, respectively.
1 Introduction
Traffic is one of the most significant sources of fine parti-cles in an urban environment. This has been shown earlier in many studies mostly based on measurements of the particle mass concentration. Recently, also the number concentration of fine particles measured at an urban background has been related to the traffic rate (Van Dingenen et al., 2004; Hussein et al., 2004). The size and concentrations of traffic related particles at roadsides have been widely studied during recent years.
Based on results obtained from number distribution mea-surements in engine or vehicle test laboratories, the fine parti-cles in a vehicle exhaust are often distributed into two modes. The larger particle mode (number based geometric mean di-ameter 40–100 nm) in the vehicle exhaust consists of soot particles and volatile materials condensed on them (Kittel-son et al., 2000; Harris and Maricq, 2001). These soot parti-cles are agglomerates formed in the engine during the com-bustion process. The soot particles are emitted mainly from diesel vehicles, whereas gasoline engines emit less soot (Har-ris and Maricq, 2001). Additionally, soot particles have been observed to be emitted from new technology gasoline direct injection vehicles (e.g. Harris and Maricq, 2001). The nu-cleation mode particles (<30 nm in size) are liquid particles consisting mainly of hydrocarbons, water and sulphates (Kit-telson, 1998; Khalek et al., 2000). The nucleation mode par-ticles form during dilution and cooling of the exhaust which
happen both in the laboratory and in the atmosphere (Abdul-Khalek, 1999; Kittelson et al., 2000).
Chase studies of individual vehicles form a link between laboratory emission and roadside concentration measure-ments. Chase studies of diesel vehicles have been reported by Kittelson et al. (2000, 2004); Vogt et al. (2003); Giechask-iel et al. (2005); and R¨onkk¨o et al. (2006). According to Kittelson et al. (2000) and Giechaskiel et al. (2005) the soot particle mode shows good agreement between the laboratory and on-road measurements. In the study of particle emissions of the diesel passenger car (Giechaskiel et al., 2005) the ap-pearance of nucleation mode in the laboratory was similar to the on-road measurements, but the size of the particles were larger in the laboratory due to the lower dilution ratios. For a heavy duty vehicle, R¨onkk¨o et al. (2006) found higher nu-cleation mode concentrations during the chase than in the laboratory, but reported similar behavior as a function of en-gine load. The nucleation mode formation takes place im-mediately after the exhaust has been emitted from tail pipe. According to R¨onkk¨o et al. (2006) the nucleation mode was completely formed within 0.5 s of the emission into the at-mosphere. The nucleation process is at present qualitatively understood, but the details are not known.
The size distribution characteristics measured at the road-side locations differ somewhat from those measured for sin-gle vehicles. According to Imhof et al. (2005a); Janh¨all et al. (2004); Ketzel et al. (2004) and W˚ahlin et al. (2001) the size distributions measured at the roadside were dominated by nucleation mode particles with a relatively constant peak size of 20 nm. In laboratory and chase measurements the nu-cleation mode existence and peak diameter show great varia-tion (Kittelson et al., 2004; Vaaraslahti et al., 2004; R¨onkk¨o et al., 2006). The geometric standard deviation (GSD) of the nucleation mode measured in the engine laboratory is typically around 1.3–1.7. The roadside nucleation modes represent typically the broader end of the range. Imhof et al. (2005b) measured particle size distributions in two differ-ent road tunnels in Graz and Liverpool. They found a nucle-ation mode with GMD around 15–20 nm in Graz and 25 nm in Liverpool and GSDs approximately 1.8 and 1.5, respec-tively.
Particle density is a physical property that carries infor-mation about particle composition and therefore about the origin of the particles and the processes they have experi-enced. Diesel soot particles are agglomerates with a size de-pendent density which is below 1 g/cm3 for particles larger than ∼60 nm (Park et al., 2003; Virtanen et al., 2004b; Mar-icq et al., 2004). According to authors’ knowledge, there are no density values available from roadside measurements, and only very limited amount from urban measurement sites. For particles ≤100 nm, Stein et al. (1994) report values be-tween 1.60 and 1.79 g/cm3 and McMurry et al. (2002) be-tween 1.35 and 1.7 g/cm3. According to authors’ knowledge, density values for urban aerosol particles in the size range of nucleation mode have not been reported.
As fine particle sources, different individual vehicles (heavy-duty vehicles, diesel cars, petrol cars etc.) running on different kinds of fuel have a variety of emission pro-files. The particulate matter emitted from traffic is a mixture of primary particles directly from different vehicle sources and secondary particles formed after gas phase emission via gas-to-particle conversion. The relationship between primary (or secondary) particulate emissions from individual vehicles and the particulate emissions from the whole road is not ex-tremely well understood. The number distributions measured at these two cases seem to slightly differ from each other. This is partly because a mixture of sources is observed at the roadside, but also partly because several fundamental pro-cesses such as nucleation, evaporation/condensation, coagu-lation, internal conversion in the particle phase etc. take place under real conditions. Especially the nucleation process in the atmosphere may not be exactly identical with the process observed in laboratory. Due to the external mixing process, also the characteristics of the particle modes and also par-ticle density may differ from those measured for individual vehicles. We believe that there is still need for detailed par-ticle characterization at the roadside as well as for detailed analysis of the whole particulate emissions from the traffic source.
In this paper, we present results of a roadside measure-ment campaign. The concentration of different sized parti-cles as well as the median sizes of modes measured at the roadside is related to the traffic rate. This is important, when the dependence of the concentration of different sized par-ticles or mode characteristics on source parameters, such as traffic rate, need to be known. Also the differences between the emissions during the winter and summer time are stud-ied. Especially, the characteristics of modes appearing in measured particle size distributions at the roadside are inves-tigated. In addition, the average density of particles in modes will be estimated, including the nucleation mode.
2 Description of measurement campaign 2.1 Measurement site description
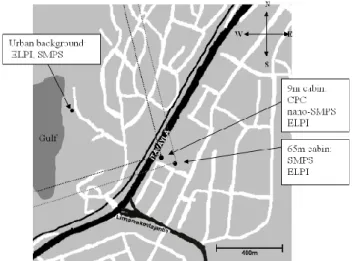
The measurement site was located in the Herttoniemi district of Helsinki, some 6 km east from the city centre. The inves-tigated highway (It¨av¨ayl¨a) is the main road towards north-east from city centre (Fig. 1). The highway consists of 3 lanes in both directions. The measurements were part of the Finnish project LIPIKA (“Relationship of traffic related fine particle emissions to engine laboratory measurements”) and they were performed during 4 campaigns. Two winter cam-paigns took place in 10–26 February 2003 and 28 January– 12 February 2004, and two summer campaigns in 12–27 Au-gust 2003 and 6–20 AuAu-gust 2004. Simultaneous measure-ments were made at distances of 9 m and 65 m from the near-est edge of the highway. The instruments were stationed in
two similar cabins, sampling at 5.7 m above ground level. The sampling lines were identical in both cabins. A sample flow of 16 liters per minute was fed through cabin roof with a 3 m long sampling tube, 25 mm in diameter. A Minnesota type pre-cutting separator with 10 µm cut diameter was used as a pre-cutter. The sampling lines included two 90◦bends, but the inertial losses caused by them are regarded insignifi-cant for the sub micrometer particle measurements reported in this paper. The diffusion losses in sampling lines were calculated for the investigated size range. Losses for parti-cles larger than 10 nm in diameter were less than 5%. Diffu-sion losses for particles larger than 100 nm were negligible: less than 1%. Due to the similarity of the sampling lines the results gained at 9 m and 65 m distance from the road are be-lieved to be comparable.
A factory is located next to the measurement site (35 m to north from the 65 m cabin). Its emissions were clearly distinguishable from traffic emissions (strong concentration peak at 30 nm). Based on the measured wind direction, the data with wind direction directly from the factory towards the measurement site were omitted.
2.2 Instrumentation
The total number concentrations at the roadside were mea-sured with a condensation particle counter (CPC, TSI, model 3025). The detection limit of CPC 3025 is 3 nm. Be-cause of high particle concentrations especially during the rush hours, a passive diluter with a dilution ratio of ∼1:4– 1:6 was used in CPC measurements. The average and max-imum and minmax-imum values for particle number concentra-tion, measured by CPC, were recorded every five seconds. During the campaigns in 2004 a Scanning Mobility Particle Sizer designed for nano particles (referred further as “nano-SMPS”) equipped with nano-DMA (TSI, model 3085) and CPC 3025 was used in the 9 m cabin (measurement range 3 nm–57 nm). Scanning Mobility Particle Sizer (referred fur-ther as “long-SMPS”) with DMA model 3071 and CPC 3025 was used in the 65 m cabin during all campaigns. The “long-SMPS“ measurement range covered the particles from 5 nm to 160 nm. An Electrical Low Pressure Impactor (ELPI, Dekati Ltd) with filter stage was used in both cabins, cov-ering the particle size range of 7 nm–6.6 µm. It should be noted that ELPI measures the aerodynamic size of the parti-cles. Particle number concentrations discussed below were measured at 9 m. The data measured in the 65 m cabin are used only to study the evolution of size distribution and par-ticle density.
In addition to stationary measurement sites, a mobile mea-surement unit, “Sniffer” (Pirjola et al., 2004), was used in the background concentration measurements. The urban back-ground concentrations were measured at Saunalahti, 600 m northwest from the measurement site. The background par-ticle concentrations were measured using SMPS and ELPI.
Fig. 1. Map of the measurement site. Studied wind sectors (255◦– 345◦) marked with dashed lines.
2.3 Traffic count
A traffic count was performed at the It¨av¨ayl¨a highway by the City of Helsinki and the Finnish Road Administration by an automatic traffic measurement system, located some 3 km from the measurement site towards city centre. The continu-ous long-term traffic rate measurement provides hourly aver-ages. Traffic in both directions was calculated separately. In addition, the number of heavy-duty vehicles was determined by the measurement system. We made occasional short-term (three-minute) vehicle counts to check the correlation with the continuous measurements. As reported earlier, the agree-ment was excellent, indicating that the continuous measure-ment is representative also to the traffic at the measuremeasure-ment location (Pirjola et al., 2006).
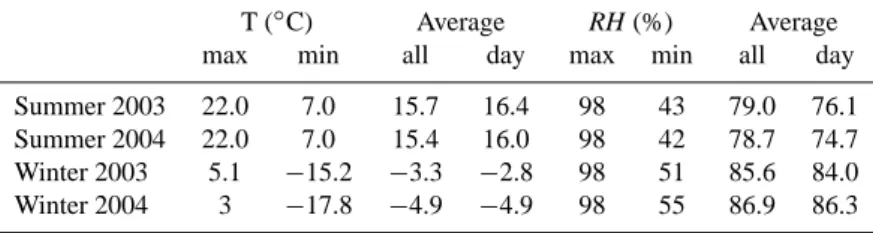
2.4 Meteorological conditions
Meteorological data (wind speed, wind direction, tempera-ture and relative humidity) were measured at the 9 m cabin with a Vaisala weather station (Milos500, Vaisala). The max-imum, minimum and average values for temperature and rel-ative humidity values are shown in Table 1, together with average values for the day-time (i.e. 06:00–20:00). The me-teorological conditions during the summer and winter cam-paigns are typical for summer and winter seasons in Helsinki. The data were classified according to wind direction, sim-ilar to the method by Pirjola et al. (2006). This paper con-centrates on the results of wind sector S1, which consists of wind directions 255◦–345◦(wind blowing from the road to the measurement cabins). The wind sector is marked in Fig. 1 with dashed lines.
Table 1. Maximum, minimum and average values of temperature and relative humidity during the winter and summer campaigns.
T (◦C) Average RH (%) Average
max min all day max min all day
Summer 2003 22.0 7.0 15.7 16.4 98 43 79.0 76.1 Summer 2004 22.0 7.0 15.4 16.0 98 42 78.7 74.7 Winter 2003 5.1 −15.2 −3.3 −2.8 98 51 85.6 84.0 Winter 2004 3 −17.8 −4.9 −4.9 98 55 86.9 86.3
3 Method for estimating particle density
Particle density was estimated using the parallel measure-ment method described by Ristim¨aki et al. (2002) and Vir-tanen et al. (2004a). The method is based on simultaneous (“parallel”) distribution measurement with ELPI and SMPS and further on the relationship between particle aerodynamic size, mobility size and effective density. The basic idea is to minimize the difference of the measured ELPI currents and currents simulated by using SMPS number distribution and ELPI response functions (i.e. the charger efficiency and impactor kernel functions). The minimization is made by al-tering the particle density. It should be noted that number distribution is not calculated from measured currents at any point, but instead a mathematical model of ELPI is used. The complete set of information required to construct the math-ematical model of ELPI, can be found from Marjam¨aki et al. (2000, 2005) and Virtanen et al. (2001).
To be able to apply the parallel method in roadside parti-cle studies the method was modified to be suitable for multi-modal distributions. In the multimulti-modal modification, the log-normal distributions are fitted into the measured SMPS data. These fitted lognormal distributions are then used in ELPI current simulation instead of measured SMPS distributions. The fitting is done by assuming a maximum 3 modes in the SMPS measurement range (5 nm–160 nm). To limit the de-grees of freedom in the density search procedure, a constant density is assumed within each mode. The main difference to the single mode case (Ristim¨aki et al., 2002) is that in-stead of one effective density, the effective density for each sub-mode is searched. This means that the search algorithm has to operate in multi-dimensional space and the result may be more sensitive to the start point than with the single mode case. We have initialized the effective densities with an ad hoc method where the initial effective densities are suggested in a sequence starting from the mode producing the high-est simulated ELPI current. The actual initialisation of each sub-distribution is performed by choosing from a set of pre-selected densities ranging from 0.1 to 10 g/cm3. After the ini-tialisation the search algorithm minimises the difference be-tween the measured and simulated ELPI currents by chang-ing the effective densities of each sub-distribution. As a re-sult, the average density of each mode is found. We have
utilised the “fminsearch“ function of Matlab® to perform the minimisation. The method can be used for the ELPI and SMPS data at hand if the impactor individual and charger as well as DMA are carefully calibrated.
The method was tested in the laboratory for bimodal size distribution using two test oils as the particle mate-rial: Fomblin (perfluorinated polyether inert fluid, Ausimont Ltd) and di-octyl sebacate (DOS). The density of Fomblin is 1.9 g/cm3 and the density of DOS is 0.91 g/cm3. Bi-modal distributions with one mode consisting of Fomblin and the other of DOS were generated using a tube furnace for Fomblin and a nebulizer with condensation-evaporation cy-cle for DOS. The geometric mean diameters of DOS distribu-tions were varied between 40–50 nm and of the Fomblin dis-tributions between 90–150 nm. The method produced den-sity estimates of 0.8±0.08 g/cm3 and 1.8±0.26 g/cm3 for DOS and Fomblin, respectively. These values are within 15% of the true bulk densities.
4 Results
4.1 Correlation of particle emissions and traffic rate All the results concerning traffic rate and particle concentra-tions presented in this section were obtained at wind direc-tions S1 during the weekdays (Monday–Friday). Although both winter and summer measurement periods were rela-tively short, the meteorological conditions and traffic rates were typical for the season. Therefore the results are be-lieved to represent typical particle population at the roadside of It¨av¨ayl¨a.
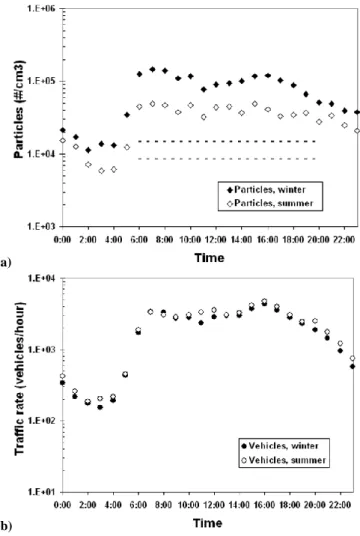
In comparison to the Finnish average values, the traffic rate at It¨av¨ayl¨a is high. The day-time (06:00–20:00) average traffic rate was 3290 vehicles/hour during the summer cam-paigns and 2910 vehicles/hour during the winter camcam-paigns. These values represent well the long-term average values for the traffic rate at It¨av¨ayl¨a. The average values for traffic rate measured during the campaigns are presented in Fig. 2b. The traffic rate peaked during the morning and evening rush hours i.e. 06:00–10:00 and 15:00–18:00. During the rush hours, the traffic rate reached ∼4000 vehicles/hour but the traffic was fluent, not jamming. There was no remarkable difference
between the traffic rates during the winter and summer cam-paigns or between the morning and evening rush hours.
Figure 2a shows the particle concentrations at the 9 m dis-tance from the road, measured with CPC. The roadside con-centrations followed the same temporal pattern as the traffic rate. Hussein et al. (2004) give the same hours for the min-imum (03:00) and maxmin-imum (07:00) concentrations mea-sured at the urban background stations located at Kumpula and Siltavuori in Helsinki. The minimum concentration val-ues at the roadside were of the same order as the urban back-ground values. No continuous backback-ground data were avail-able. Instead, the average background concentration was cal-culated from several short-time measurements made by the mobile laboratory. The number of background measurement days was 17 during the summer campaigns and 11 during the winter campaigns. The time periods during which the background measurements took place were between 07:00– 10:00 and 14:00–20:00. The average nighttime background concentrations, calculated using short-time measurements, were ∼6000 #/cm3 and 10 000 #/cm3 for summer and win-ter, respectively. Hussein et al. (2004) reported rather simi-lar nighttime background concentration values of 8000 #/cm3 and 10 000 #/cm3during the summer and winter seasons, re-spectively. The average daytime background concentrations are shown by the dashed lines in Fig. 2a.
Hussein et al. (2004) reported maximum morning rush hour concentrations of approximately 25 000 #/cm3 and 17 500 #/cm3, during the summer and winter seasons, cor-respondingly. As expected, the roadside concentrations dur-ing the morndur-ing rush hours at It¨av¨ayl¨a were much higher, averaging approximately 100 000 #/cm3 in the winter and 50 000 #/cm3in the summer. In the winter time the concen-tration peaking was a bit stronger during the morning rush hours than during evening rush hours. Williams et al. (2000), Moln´ar et al. (2002), Wehner et al. (2002), Charron and Har-rison (2003), and Janh¨all et al. (2004) observed stronger con-centration peaks during the morning rush hour. Wehner et al. associated the higher morning concentrations with the higher truck traffic rate. Moln´ar et al. attributed their results to higher wind speeds and more effective vertical mixing during the afternoons. In the case of It¨av¨ayl¨a, there was no differ-ence in portion of heavy duty traffic during the morning and evening rush hours. Neither was there any remarkable dif-ference in wind speed (in winter). We assume that the effect can be explained mostly by reduced vertical mixing in winter mornings.
The winter concentrations were approximately double compared to the summer concentrations. This can be seen in Fig. 3, where particle concentrations are presented as a function of traffic rate. The daytime background concentra-tions are again marked with dashed gray lines. All data points with traffic rate less than 1000 vehicles/hour were measured during nighttime. Both the summer and wintertime total con-centrations increased with increasing traffic rate. A best fit to the data points was found to obey the form y∼xa, where y is
(a)
(b)
Fig. 2. (a) Measured particle concentrations (9 m distance from the
road edge) and (b) traffic rates in summer and wintertime. Dashed lines in (a) represent the daytime averages for urban background (dark line for winter and light line for summer).
particle concentration and x is traffic rate. The exponent “a” has value 0.62 and 0.69 for summer and wintertime results, respectively (Table 2.). We believe that the non-linear depen-dence of the concentration on traffic rate can be explained by a combination of linear source term and time dependent ur-ban background.
To find out the relationship between different particle size fractions and traffic rate the particles were separated into two size classes based on the cut-point of the impactor stage 2 of ELPI, 63 nm (in aerodynamic size). The concentration of the particles in the size fraction of 63 nm–6.6 µm was calculated from ELPI distribution by integrating the parti-cle concentrations measured on stages 2–11. This size range is referred further as “dp>63 nm“. The concentrations of
particles smaller than 63 nm were calculated by subtract-ing the concentrations of 63 nm–6.6 µm particles from the total number concentrations measured by CPC. The CPC
Table 2. The “a” values of the function y∼xa, where y is parti-cle concentration and x is traffic flow. The “a” and R2values for total concentration and concentration of two size fractions for the summer and wintertime data are presented in the table.
y∼xa a R2
Total concentration summer 0.62 0.70 winter 0.69 0.81 7 nm≤dp<63 nm summer 0.60 0.63 winter 0.71 0.83 63 nm≤dp<6.6 µm summer 0.49 0.60 winter 0.50 0.60
Fig. 3. Particle concentrations as a function of traffic rate. (9 m
distance from the road edge).
detection limit (∼3 nm) gives the lower size limit of this smaller size fraction. This size fraction is referred further as “dp<63 nm”.
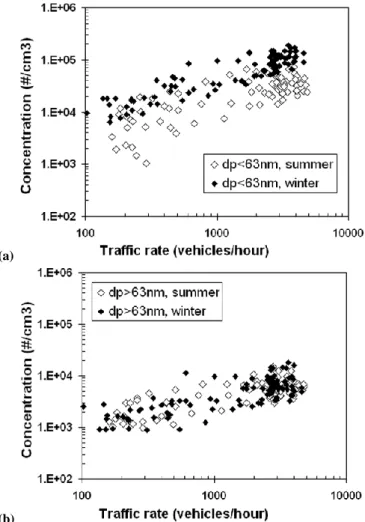
In Figs. 4a and b, the concentrations of the two particle size classes (dp<63 nm and dp>63 nm) are presented as a function of traffic rate. In Fig. 4a, the summer and winter concentrations for dp<63 nm particles are presented. These
particles are mostly nucleation mode particles formed during the dilution process in the exhaust plume. In addition, part of the traffic related soot particles belongs to this size fraction. Also a part of the Aitken mode, which is characteristic to urban background, is in this size range (Hussein et al., 2004). In Fig. 4b the concentration of particles larger than 63 nm is presented. These larger particles contain the traffic related soot particles with volatile materials condensed on them. In addition, this size range contains Aitken mode particles and aged, non-traffic related accumulation mode particles (Long-ley et al., 2004; Moln´ar et al., 2002). The fraction of aged accumulation mode particles can be remarkable especially when the traffic rate is low.
For both size fractions the dependence of concentration (y) on traffic rate (x) is of form y∼xaas it was for the total
(a)
(b)
Fig. 4. Concentrations of two different size fractions as a function
of traffic rate: (a) particles smaller than 63 nm (b) particles larger than 63 nm. (9 m distance from the road edge).
concentration. The “a” and R2 values are presented in Ta-ble 2. The exponent “a” has the same value for total concen-tration and dp<63 nm particle concentration. This is because
the concentration of dp<63 nm particles dominated the total
particle concentration: the dp<63 nm particles constituted
∼90% of particles in winter time and ∼80% of particles in summer time. The exponent a is higher for the smaller size fraction, indicating a lower contribution of the urban back-ground aerosol. The exponent a for dp<63 nm particles is
lower in the summer than in the winter. This is believed to be caused by the lower concentrations during the summer that leads to a higher relative contribution of the urban back-ground. On the other hand, there is no seasonal difference in the exponent for the larger size fraction. Although the role of the background in this size fraction is higher, its relative contribution has less seasonal variation.
Figures 4a and b indicate that the winter concentration of dp<63 nm particles was approximately doubled compared to
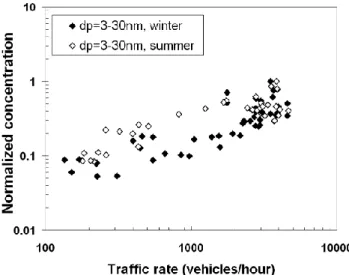
Fig. 5. The dependence of nucleation mode particle (dp=3–30 nm)
concentration on traffic rate.
the summer concentration while there was no clear seasonal difference in the concentration of dp>63 nm particles. The
difference in seasonal behavior of these two sized fractions is related to their formation mechanisms. The soot particles are formed during the combustion. According the labora-tory studies by Ristim¨aki et al. (2005), the temperature of the engine intake air has only a minor effect on the soot parti-cle concentration even if the intake air temperature is below 0◦C. Thus, the soot formation seems to be insensitive to the temperature of the surrounding air. On the other hand, the formation of nucleation mode particles is sensitive to dilu-tion condidilu-tions, such as temperature and relative humidity of the surrounding air. According to Kittelson et al. (2000), low ambient temperatures favor nucleation in vehicle exhaust. In the laboratory, Ristim¨aki et al. (2005) found that the effect of dilution temperature depends on vehicle technology, but in most cases reported modestly increased nucleation mode formation by low dilution temperatures.
We assume that the lower temperature in the wintertime is the main reason for the number concentration of dp<63 nm
particles being higher in winter than in summer time. The smaller height of the mixing layer in winter time could, in principle, result in higher particle concentration. However, we believe that when measuring this close to the source, the vertical mixing process has not yet affected that much and the temperature plays a stronger role. It is not fully clear how the vertical mixing process of planetary boundary layer air actually affects different particle sizes. Somewhat sur-prisingly, the number concentrations of dp>63 nm particles
were fairly equal when winter and summer times are com-pared. This agrees with the result of Hussein at al. (2004) who, in their urban measurement site in downtown Helsinki, also observed rather equal accumulation number concentra-tions in winter and in summer. We believe that the effect of
Fig. 6. Typical SMPS size distributions measured during rush hours
in the winter (black line) and summer (light line). Distributions in log-log scale are presented in the upper corner. (65 m distance from the road edge).
the vertical mixing process on the fine particle size distribu-tion is a challenging topic, and should be studied in more de-tail and in a larger context in forthcoming research on urban aerosol.
The nano-SMPS data measured at 9 m could not be used in the number concentration comparison for size fractions, be-cause the nano-SMPS concentrations were much lower than the CPC concentrations. The difference could not be ex-plained by the narrow measurement range of nano-SMPS (3–60 nm). Distributions measured with the “long-SMPS” at 65 m (see Fig. 6) show that the total concentration should be overwhelmingly dominated by particles within the nano-SMPS range. This indicates a user error in the nano-nano-SMPS measurement. However, the nano-SMPS size distribution compared nicely with the long-SMPS at 65 m. Therefore, the nano-SMPS data were still used to study the dependence of the nucleation mode (dp=3–30 nm) particle concentration
on traffic rate. The concentration relative to the maximum measured concentration is plotted in Fig. 5. Because of the low number of data points, no trend line was fitted, but the concentration dependence on traffic rate was similar to that of total concentration shown in Fig. 3.
4.2 Characteristics of road-side distributions
In Fig. 6, the average SMPS size distributions for winter and summer time rush hours are shown. All the results pre-sented in this chapter were calculated from the data mea-sured at the 65 m cabin, because it was equipped with the long-SMPS with a size range of 5–160 nm. Figure 6 shows that both distributions were dominated by small, probably nucleation originated particles with a peak size of approx-imately 20 nm. Similar observation was also reported by Wehner and Wiedensohler (2003) and Ketzel et al. (2004). Multimodal lognormal distribution was fitted to the mea-sured distributions to enable the particle density calculation
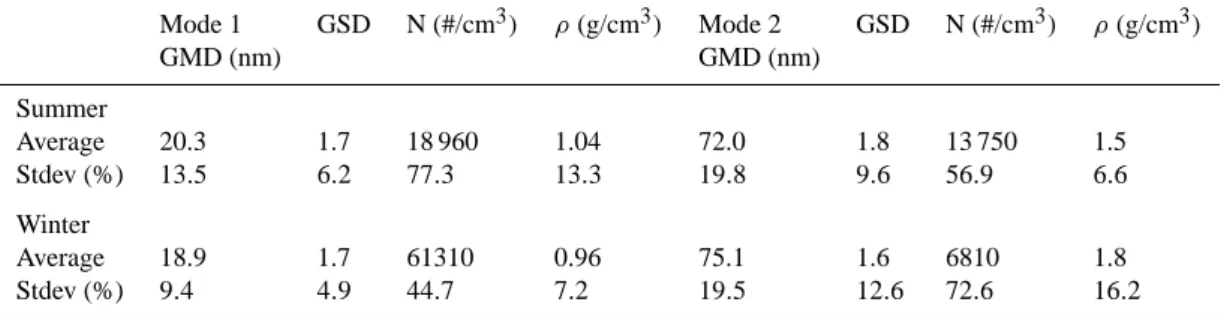
Table 3. The daytime (06:00–20:00) summer and winter average values of distribution characteristics (geometric mean diameter GMD,
geometric standard deviation GSD and number concentration N) and average density (ρ) of particles in the modes. (Distance 65 m from the road.) Mode 1 GSD N (#/cm3) ρ(g/cm3) Mode 2 GSD N (#/cm3) ρ(g/cm3) GMD (nm) GMD (nm) Summer Average 20.3 1.7 18 960 1.04 72.0 1.8 13 750 1.5 Stdev (%) 13.5 6.2 77.3 13.3 19.8 9.6 56.9 6.6 Winter Average 18.9 1.7 61310 0.96 75.1 1.6 6810 1.8 Stdev (%) 9.4 4.9 44.7 7.2 19.5 12.6 72.6 16.2
procedure described above. At most of the cases, two lognor-mal modes were found in the distributions. These are marked as “Mode 1” and Mode 2” in Table 3 where the average val-ues of daytime (i.e. 06:00–20:00) results are shown. Only in a few cases was a third mode found, above 110 nm. It should be noted here, that only the modes for which the den-sity values were found are accepted as results. If the con-centration of a certain mode is low compared to other found modes, the simulated current caused by that mode is negli-gible compared to the total current. In this case, the density value cannot be found at all or its value can be unreasonable. Hussein et al. (2004) found mostly 3 modes in Helsinki: av-erage geometric mean diameter (GMD) of nucleation mode was at ∼10–15 nm, Aitken mode at 40–50 nm and accu-mulation mode at ∼150 nm. Their measurement sites were at Kumpula and Siltavuori, representing background sites rather than roadside sites. The concentration values were significantly lower (approximately one fourth) than those re-ported in this study and the traffic related particle emissions were mixed into a more aged urban background. At the road-side, the distribution is dominated by fresh traffic related par-ticles i.e. fresh nucleation mode parpar-ticles and soot parpar-ticles.
As shown in Table 3, the average geometric mean diame-ter (GMD) of traffic related nucleation mode (Mode 1) was 20.3±2.7 nm during the summer and 18.9±1.8 nm during the winter. The geometric standard deviation (GSD) value for the nucleation mode was 1.7 both for the summer and win-ter. Imhof et al. (2005b) measured particle size distributions in two different road tunnels in Graz and Liverpool. They found nucleation mode with GMDs around 15–20 nm in Graz and 25 nm in Liverpool and GSDs of approximately 1.8 and 1.5 respectively. These values are in good agreement with our study. Ketzel et al. (2004) found that the traffic related distributions peaked at 22 nm in the centre of Copenhagen. In addition, Wehner and Wiedensohler (2003) reported the peak in the urban number size distribution around 20 nm. They also found the additional mode peaking at 10–15 nm during the summer time. This mode was related to the new parti-cle formation event that correlated with the amount of global
radiation. During our measurement campaigns we observed only two similar formation event days during the summer campaign 2004. This data were omitted from results. In the laboratory and chase measurements the nucleation mode ex-istence and peak diameter show great variation (Kittelson et al., 2004; Vaaraslahti et al., 2004; R¨onkk¨o et al., 2006). The reported traffic related nucleation mode GMDs measured in roadside or traffic tunnel have a surprisingly constant values close to 20 nm.
The GMD of Mode 2 was 72.0±14.3 nm in the summer and 75.1±14.6 nm in the winter, while the GSD was 1.8 and 1.6 in summer and in winter, respectively. Imhof et al. (2005b) measured the road tunnel soot distributions peak-ing at around 80–100 nm (GSD∼1.85) in the tunnel in Graz. On the other hand, they reported that the soot mode mea-sured in the traffic tunnel in Liverpool was not clearly distin-guishable in the distribution and its GMD was around 45 nm (GSD∼2.22). Rose et al. (2005) studied the soot particle distribution in a street canyon in Leipzig. They observed the soot distribution peaking at 65 nm and 70 nm during the summer and winter. They also found that the soot particles make up 50–60% of the number of 80 nm particles at the roadside. In the urban background the corresponding per-centile is 20–25%. In addition, the GMD values for the soot mode of single vehicle emissions are reported to be typi-cally 50–90 nm and GSD values around 1.8 (e.g. Harris and Maricq, 2001). According to the above, the GMD and GSD values of Mode 2 were controlled by the traffic related soot particles. This is not necessarily so in a more polluted en-vironment. M¨onkk¨onen et al. (2005) studied mode charac-teristics in a polluted Asian mega city. The GMD of nu-cleation mode was smaller, most of the time below 10 nm. The distributions were dominated by Aitken and accumula-tion modes with GMD values of 30–60 nm and 120–160 nm, respectively. The different mode characteristics are probably related to other particle sources than traffic.
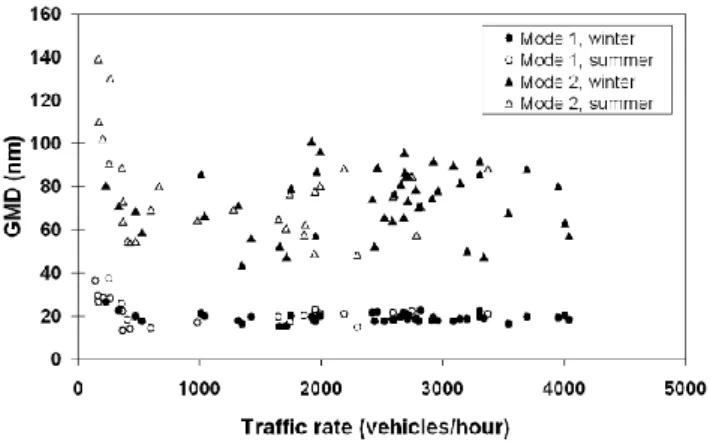
In Fig. 7, the GMD values of fitted distributions are shown as a function of traffic rate. The GMD of nucleation mode and accumulation mode seems to be rather independent on
traffic rate. At traffic rate values <500 vehicles/hour (i.e. night time measurements), the GMD of both modes seem to increase. This is caused by the diminishing portion of traffic related particles in the particle population. In this case the urban background i.e. Aitken and accumulation modes be-come dominant modes in the measured distribution. In fact, the fitted GMD values at low traffic rates were 30–40 nm and 80–140 nm, in accordance with the values measured both at the urban and rural background stations (e.g. Tunved et al., 2003; Hussein et al., 2004).
4.3 Particle density
Table 3 also shows the density values corresponding to the two modes. The density of “Mode 1”, i.e. nucleation mode, is 1.04±0.14 g/cm3and 0.96±0.07 g/cm3during the summer and winter time, respectively. There are no published data for the density of traffic related nucleation mode particles. Sakurai et al. (2003a) analyzed the composition of nucleation particles emitted from heavy-duty diesel engine without any after-treatment systems. They found that the particles con-sist of organic compounds with a carbon number of 24–32. Sakurai et al. (2003b) estimated a density of 0.8 g/cm3 for these compounds. In addition, the nucleation mode forma-tion is connected to the sulphate formaforma-tion, especially when oxidation catalyst is used (Lepperhof, 2001; Maricq et al., 2002; Vaaraslahti et al., 2004). According to studies of Vogt et al.(2003); Gieshaskiel et al. (2005) the sulphuric acid -water nucleation seems to have an important role in the nu-cleation mode formation. This would produce particles with a density somewhere below that of sulphuric acid, 1.8 g/cm3. The present density values fit nicely into this general scheme. The found effective density value for “Mode 2” was 1.45±0.10 g/cm3and 1.87±0.30 g/cm3for summer and win-tertime, respectively. The results are in good agreement with the study of McMurry et al. (2002). They found that the density of ∼0.1 µm urban aerosol particles measured in At-lanta, USA, varied between ∼1.4–1.7 g/cm3. The density values found in this and previous studies are high compared to the reported values for soot particle densities. According to the laboratory studies of Park et al. (2003); Virtanen et al. (2004b) and Maricq et al. (2004) the density of the porous diesel soot agglomerates is close to 1 g/cm3at ∼60 nm and below ∼0.6 g/cm3 at ∼100 nm. If the voids in the agglom-erated particles get filled with condensable materials, parti-cle density increases. It is still unlikely that the condensa-tion of volatiles could increase the density of soot particles in “Mode 2” up to 1.4–1.8 g/cm3. It is more probable that the mode is an external mix of soot particles and urban back-ground particles of other materials. The found density for “Mode 2” is the average density for the mixed aerosol. In fact the relatively low increase of concentration of particles larger than 63 nm with increasing traffic rate (see Fig. 4 and Table 2) and the results of Rose et al. (2005) discussed above
Fig. 7. Geometric mean diameters of “Mode 1” and “Mode 2” as a
function of traffic rate. (65 m distance from the road edge).
supports the assumption that a significant portion of particles in “Mode 2” are not fresh vehicle emitted particles.
5 Conclusions
The total concentrations at roadside were dominated by nu-cleation mode particles. The concentrations were 2–3 times higher in the wintertime than in the summer time. Particles smaller than 63 nm in aerodynamic diameter made up ∼90% of particles in the winter and ∼80% of particles in summer. The number concentrations of particles increased with in-creasing traffic rate. The effect of traffic rate on particles smaller than 63 nm was stronger than on the larger particles. Particle size distribution at the roadside consisted of two distinguishable modes. The GMD of the nucleation mode (Mode 1) at 65 m distance from the road was 20.3 nm in the summer and 18.9 nm in winter. The GMD of the nucleation mode was independent of the traffic rate. The average den-sity value for Mode 1 particles was ∼1.0 g/cm3both in the summer and winter. All these values are close to those ex-pected from exhaust measurements for the nucleation mode. It is concluded that this mode is totally controlled by the fresh vehicle emissions.
The GMD of the larger mode (Mode 2) was 72.0 nm in the summer and 75.1 nm in the winter. These values corre-spond to soot mode emissions. However, the average den-sity value for Mode 2 was 1.5±0.1 g/cm3in the summer and 1.8±0.3 g/cm3 in winter, which is considerably higher than expected from the soot mode exhaust studies. This indicates a higher contribution of the urban background to this exter-nally mixed mode.
Acknowledgements. The study has been funded by Fine – program
of Finnish Technology Agency (Tekes) and Maj and Tor Nessling foundation.
References
Abdul-Khalek, I. S., Kittelson, D. B., and Brear, F.: The influence of dilution conditions on diesel exhaust particle size distribution measurements, SAE technical paper series, no. 1999-01-1142, 1999.
Charron, A. and Harrison, R. M.: Primary particle formation from vehicle emissions during exhaust dilution in the roadside atmo-sphere, Atmos. Environ., 37, 4109–4119, 2003.
Gieshaskiel, B., Ntziachristos, L., Samaras, Z., Scheer, V., Casati, R., and Vogt, R.: Formation potential of vehicle exhaust nucle-ation mode particles on-road and in the laboratory, Atmos. Envi-ron., 39, 3191–3198, 2005.
Harris, S. J. and Maricq, M. M.: Signature size distribution for diesel and gasoline engine exhaust particulate matter, J. Aerosol Sci., 32, 749–764, 2001.
Hussein, T., Puustinen, A., Aalto, P. P., M¨akel¨a, J. M., H¨ameri, K., and Kulmala, M.: Urban aerosol number size distributions, At-mos. Chem. Phys., 4, 391–411, 2004, http://www.atmos-chem-phys.net/4/391/2004/.
Imhof, D., Weingartner, E., Ord´o˜nez, C.,Gehrig, R., Hill, M., Buch-mann, B., and Baltensberger, U.: Real-world emission factors of fine and ultra fine aerosol particles for different traffic situations in Switzerland, Environ. Sci. Technol., 39, 8341–8350, 2005a. Imhof, D., Weingartner, E., Pr´ev¨ot, A. S. H., Ord´o˜nez, C.,
Kurten-bach, R., Wiesen, P., Rodler, J., Sturm, P., McCrae, I., Sj¨odin, ˚A., and Baltensberger, U.: Aerosol and NOx emission factors and submicron particle number size distributions in two road tunnels with different traffic regimes, Atmos. Chem. Phys. Discuss., 5, 5127–5166, 2005b.
Janh¨all. S., Jonsson, ˚A. M., Moln´ar, P., Svensson, E., and Hallquist, M.: Size resolved traffic emission factors of submicrometer par-ticles, Atmos. Environ., 38, 4331–4340, 2004.
Ketzel, M., W˚ahlin, P., Kristensson, A., Swietlicki, E., Berkow-icz, R., Nielsen, O. J., and Palmgren, F.: Particle size distri-bution and particle mass measurements at urban, near-city and rural level in the Copenhagen area and Southern Sweden, At-mos. Chem. Phys., 4, 281–292, 2004, http://www.atmos-chem-phys.net/4/281/2004/.
Khalek, I. A., Kittelson, D. B., and Brear, F.: Nanoparticle growth during dilution and cooling of diesel exhaust: experimental in-vestigation and theoretical assessment, SAE technical paper se-ries, No. 2000-01-0515, 2000.
Kittelson, D. B.: Engines and nanoparticles: a review, J. Aerosol Sci., 29, 575–588, 1998.
Kittelson, D., Johnson, J., Watts, W., Wei, Q., Drayton, M., Paulsen, D., and Bukowiecki, N.: Diesel aerosol sampling in the atmo-sphere, SAE technical paper series, No. 2000-01-22212, 2000. Kittelson, D. B., Watts, W. F., and Johnson, J. P.: Nanoparticle
emis-sions on Minnesota highways, Atmos. Environ., 38, 9–19, 2004. Lepperhof, G.: Influences on the particle size distribution of diesel
particulate emissions, Topics in Catalysis, 16/17(1–4), 2001. Longley, I. D., Gallagher, M. W., Dorsey, J. R., and Flynn, M.: A
case study of fine particle concentrations and fluxes measured in a busy street canyon in Manchester, UK, Atmos. Environ., 38, 3595–3603, 2004.
Maricq, M., Chase, R., Xu, N., and Laing, P.: The effects of cat-alytic converter and fuel sulfur level on motor vehicle particle emissions: Light duty vehicle emissions, Environ. Sci. Technol., 36, 283–289, 2002.
Maricq, M. and Xu, N.: The effective density and fractal dimen-sion of soot particles from premixed flames and motor vehicle exhaust, J. Aerosol Sci., 35, 1251–1274, 2004.
Marjam¨aki, M., Keskinen, J., Chen, D.-R., and Pui, D. Y. H.: Performance evaluation of the electrical low pressure impactor (ELPI), J. Aerosol Sci., 31(2), 249–261, 2000.
Marjam¨aki, M., Lemmetty, M., and Keskinen, J.: ELPI response and data reduction I: Response functions, Aerosol Sci. Technol., 39, 575–582, 2005.
McMurry, P., Wang, X., Park, K., and Ehara, K.: The relationship between mass and mobility for atmospheric particles: A new technique for measuring particle density, Aerosol Sci. Technol., 36, 227–238, 2002.
Moln´ar, P., Janh¨all, S., and Hallquist, M.: Roadside measurements of fine and ultrafine particles at a major road north of Gothen-burg, Atmos. Environ., 36, 4115–4123, 2002.
M¨onkk¨onen, P., Koponen, I., Lehtinen, K. E. J., H¨ameri, K., Uma, R., and Kulmala, M.: Measurements in a highly polluted Asian mega city: observations of aerosol number size distribution, modal parameters and nucleation events, Atmos. Chem. Phys., 5, 57–66, 2005, http://www.atmos-chem-phys.net/5/57/2005/. Park, K., Cao, F., Kittelson, D., and McMurry, P.: Relationship
between particle mass and mobility for diesel exhaust particles, Environ. Sci. Technol., 37, 577–583, 2003.
Pirjola, L., Paasonen, P., Pfeiffer, D., Hussein, T., H¨ameri, K., Koskentalo, T., Virtanen, A., R¨onkk¨o, T., Keskinen, J., and Pakkanen, T.: Dispersion of particles and trace gases nearby a city highway: mobile laboratory measurements in Finland, At-mos. Environ., 40, 867–879, 2006.
Pirjola, L., Parviainen, H., Hussein, T., Valli, A., H¨ameri, K., Aalto, P., Virtanen, A., Keskinen, J., Pakkanen, T. A., M¨akel¨a, T., and Hillamo, R. E.: “Sniffer” – a novel tool for chasing vehicles and measuring traffic pollutants, Atmos. Environ., 38, 3625–3635, 2004.
Ristim¨aki, J., Virtanen, A, Marjam¨aki, M., Rostedt, A., and Kesk-inen, J.: On-line measurement of size distribution and effective density of submicron aerosol particles, J. Aerosol Sci., 33, 1541– 1557, 2002.
Ristim¨aki, J., Keskinen, J., Virtanen A., Maricq, M., and Aakko, P.: Cold temperature PM emissions measurement: Method evalua-tion and applicaevalua-tion to light duty vehicles, Environ. Sci. Technol., 39, 9424–9430, 2005.
Rose, D., Wehner, B., Ketzel, M., Engler, C., Voigtl¨ander, J., Tuch, T., and Wiedensohler, A.: Atmospheric number size distribu-tions of soot particles and estimation of emission factors, Atmos. Chem. Phys., 6, 1021–1031, 2006, http://www.atmos-chem-phys.net/6/1021/2006/.
R¨onkk¨o, T., Virtanen , A., Vaaraslahti, K., Keskinen, J., Pirjola, L., and Lappi, M.: Effect of dilution conditions and driving param-eters on nucleation mode particles in diesel exhaust: Laboratory and on-road study, Atmos. Environ., 40, 2893–2901, 2006. Sakurai, H., Tobias, H., Park, K., Zarling, D., Doherty, K. S.,
Kit-telson, D. B., McMurry, P. H., and Ziemann, P.: On-line determi-nation of diesel nanoparticle composition and volatility, Atmos. Environ., 37, 1199–1210, 2003a.
Sakurai, H., Park, K., McMurry, P., Zarling, D. D., Kittelson, D. B., and Ziemann, P.: Size-Dependent mixing characteristics of volatile and nonvolatile components in diesel exhaust aerosols, Environ. Sci. Technol., 37, 5487–5495, 2003b.
Stein, S. W., Turpin, B. J., Cai, X. P., Huang, P. F., and McMurry, P. H.: Measurements of relative humidity-dependent bounce and density for atmospheric particles using tandem-DMA-impactor technique, Atmos. Environ., 28, 1739–1746, 1994.
Tunved, P., Hansson, H.-C., Kulmala, M., Aalto, P., Viisanen, Y., Karlsson, H., Kristensson, A., Swietlicki, E., Dal Maso, M., and Komppula, M.: One year boundary layer aerosol size distribution data from five Nordic background stations, Atmos. Chem. Phys., 3, 2183–2205, 2003, http://www.atmos-chem-phys.net/3/2183/2003/.
Vaaraslahti, K., Virtanen, A., Ristim¨aki, J., and Keskinen, J.: Nu-cleation mode formation in heavy-duty diesel exhaust with and without particulate filter, Environ. Sci. Technol., 38, 4884–4890, 2004.
Van Dingenen, R., Raes, F., Putaud, J.-P., Baltensberger, U., Char-ron, A., Facchini, M.-C., Decesari, S., Fuzzi, S., Gehrig, R., Hansson, H.-C., Harrison, R. M., H¨uglin, R., Jones, A. M., Laj, P., Lorbeer, G., Maenhaut, W., Palmgren, F., Querol, X., Ro-driquez, S., Schneider, J., ten Brink, H., Tunved, P., Torseth, K., Wehner, B., Weingartner, E., Wiedensohler, A., and W˚ahlin, P.: A European aerosol phenomenology – 1: physical characteristics of particulate matter at kerbside, urban, rural and background ar-eas in Europe, Atmos. Environ., 38, 2561–2577, 2004.
Virtanen, A., Marjam¨aki, M., Ristim¨aki, J., and Keskinen, J.: Fine particle losses in electrical low-pressure impactor, J. Aerosol Sci., 32, 389–401, 2001.
Virtanen, A., Ristim¨aki, J., and Keskinen, J.: Method for measuring effective density and fractal dimension of aerosol agglomerates, Aerosol Sci. Technol., 38, 437–446, 2004a.
Virtanen, A., Ristim¨aki, J., Vaaraslahti, K., and Keskinen J.: Effect of engine load on diesel soot particles, Environ. Sci. Technol., 38, 2551–2556, 2004b.
Vogt, R., Sheer, V., Casati, R., and Benter, T.: On-road measure-ment of particle emission in the exhaust plume of a diesel pas-senger car, Environ. Sci. Technol., 37, 4070–4076, 2003. Wehner, B., Birmili, W., Gnauk, T., and Wiedensohler, A.: Particle
number size distribution in a street canyon and their transforma-tion into the urban air background: measurements and a simple model study, Atmos. Environ., 36, 2215–2223, 2002.
Wehner, B. and Wiedensohler, A.: Long term measurements of submicron urban aerosols: statistical analysis for corre-lations with meteorological conditions and trace gases, At-mos. Chem. Phys., 3, 867–879, 2003, http://www.atmos-chem-phys.net/3/867/2003/.
Williams, P. I., Gallagher, M. W., Choularton, T. W., Coe, H., Bower, K. N., and McFiggans, G.: Aerosol development and in-teraction in an urban plume, Aerosol Sci. Technol., 32, 120–126, 2000.
W˚ahlin, P., Palmgren, F., and Van Dingenen, R.: Experimental stud-ies of ultra fine particles in streets and the relationship to traffic, Atmos. Environ., Suppl. 1, 35, 63–69, 2001.