Quantitative Structure–Permeation
Relationships (QSPeRs) to Predict
Skin Permeation: A Critical Evaluation
Sandrine Geinoz,1Richard H. Guy,2Bernard Testa,1 and Pierre-Alain Carrupt1,3
Received May 5, 2003; accepted September 5, 2003
Purpose. Development of reliable mathematical models to predict
skin permeability remains a challenging objective. This article exam-ines some of the existing algorithms and critically evaluates their statistical relevance.
Methods. Complete statistics were recalculated for a number of
pub-lished models using a stepwise multiple regression procedure. The predictivity of the models was obtained by cross-validation using a “leave-one-out” deletion pattern. The relative contribution of each independent variable to the models was calculated by a standardiza-tion procedure.
Results. The heterogeneity of the data in terms of skin origin and
experimental conditions has been shown to contribute to the residual variance in existing models. Furthermore, rigorous statistics demon-strate that some published models are based on nonsignificant pa-rameters. As such, they afford misleading mechanistic insight and will lead to over-interpretation of the data.
Conclusions. The large number of published models reflects the need
for predictive tools in cutaneous drug delivery and toxicology. How-ever, such models are more reliable when confined within well-defined chemical classes, and their applicability is often limited by the narrow property space of the set of permeants under study. KEY WORDS: percutaneous absorption; quantitative structure– permeation relationships; skin permeability; transdermal drug deliv-ery.
INTRODUCTION
Because the determination of the absorption of chemi-cals into and through the skin involves ethical difficulties with respect to human and animal experiments (1), the prediction of transdermal penetration is an object of great interest in industrial, governmental, and academic circles.
Quantitative structure–permeation relationships (QSPeRs) relate variations in the permeation of series of compounds to
variations in their physicochemical and/or structural proper-ties. QSPeRs provide insights into permeation mechanisms, may predict the permeation of novel compounds even before their synthesis, and reduce or eliminate the need for in vivo experiments. With respect to skin absorption, QSPeR models are often based on multivariate regression analysis and use an experimental index of permeation, such as the permeability coefficient, kp, as the dependent variable. A key feature in the
development of QSPeRs is that all available data must be consistent and reliable. Variations caused by heterogeneous experimental conditions will decrease the statistical validity of models. Furthermore, the physicochemical parameter space should be broadly and regularly explored to provide relevant information on the factors governing skin permeation.
The ability of a compound to diffuse passively across the skin can be assessed in various ways. Commonly, parameters from Fick’s first law [Eq. (1)], including the steady-state flux (J) and permeability coefficient (kp), are used (2):
J=DM⭈ P
h ⭈ ⌬CM= kp⭈ ⌬CM (1)
where DMis the diffusion coefficient of the permeant in the
membrane, P the partition coefficient of the solute between the membrane and solvent, h the diffusional path length, and ⌬CM the concentration difference across the membrane.
Typically, the steady-state flux and the kpare assessed from an in vitro experiment in which the donor concentration of the penetrant is maintained (more or less) constant while the receiver phase provides ⬘sink⬘ conditions. Over time, there-fore, the flux increases to reach a steady-state value (J). kpis
simply calculated from the slope of the linear portion of the graph of the cumulative amount penetrated as a function of time.
Back-extrapolation of the latter plot to the x (time) axis yields the so-called lag-time (Tlag), which is related to the time
necessary to establish a linear concentration profile across the barrier (∼2.7 · Tlag) (3,4). While Tlagis of practical usefulness (for example, in the feasibility assessment of a transdermal drug delivery candidate), it is poorly characterized experi-mentally. First of all, the manner in which transport data are back-projected to obtain Tlagis rarely performed objectively
(i.e., no specific criteria are applied to evaluate exactly when steady-state is attained). Second, for slowly diffusing com-pounds, the delay to steady-state may be too long to allow experimental determination; that is, it may not be possible to continue the study for the necessary time due to disintegra-tion of the tissue. For these reasons, attendisintegra-tion here is focused on structure–permeation relationships based only on experi-mentally determined permeability coefficients.
This article revisits and recalculates some of the impor-tant models proposed to predict skin permeation. Physico-chemical determinants in passive drug absorption and the rel-evance of the various approaches are also discussed. A sum-mary of the chemical classes studied and the ranges of molecular weight, lipophilicity, and permeability encom-passed by these datasets are presented in Table I. It should be emphasized that the results analyzed were obtained from
in vitro experiments that used aqueous donor and receiver 1Institute of Medicinal Chemistry, BEP, University of Lausanne,
CH-1015 Lausanne, Switzerland.
2Centre Interuniversitaire de Recherche et d’Enseignement,
Univer-sities of Geneva and Lyon, “Pharmapeptides,” F-74166 Archamps, France; and University of Geneva, School of Pharmacy, CH-1211 Geneva 4, Switzerland.
3To whom correspondence should be addressed. (e-mail:
ABBREVIATIONS: D, drug diffusivity; DM, diffusion coefficient in
membrane M; F, Fischer’s statistical test; J, flux; kp, permeability
coefficient; log Poct, logarithm of the octanol–water partition
coeffi-cient; n, number of data analyzed; q2, cross-validated correlation
co-efficient; QSPeRs, quantitative structure–permeation relationships; r2, square of the correlation coefficient adjusted for the number of
degrees of freedom; s, standard deviation of equation; Tlag, lag time
of diffusion.
solutions and human skin (primarily epidermis, separated in the normal way, or dermatomed tissue). No systematic evalu-ation of skin penetrevalu-ation data from nonaqueous (including volatile) vehicles has yet been undertaken, nor is it possible, for the same reason, to address the role (if any) of different receptor phases.
STATISTICAL ANALYSIS
Most QSPeR models have been published without com-plete statistics; recalculations were performed here using a
stepwise multiple regression procedure in Tsar 3.3 (Oxford Molecular Ltd., Oxford, UK) running on a PC with Windows 2000. All calculations were performed in an identical manner; the statistical parameters being the number of compounds included in the analysis (n), the square of the correlation coefficient adjusted for the number of degrees of freedom (r2), the standard deviation of the equation (s), Fischer’s
sta-tistical test (F), and the predictive correlation coefficient (q2).
The latter parameter was obtained by cross-validation using a “leave-one-out” deletion pattern (5–7). Moreover, 95% fidence limits are given in parentheses, and the relative
con-Table I. Summary of the Chemical Series and Ranges of Molecular Weight (MW), Lipophilicity (log Poct) and Permeability (log kp) Upon
Which Each Model was Developed
Chemical series Ranges* Equation Reference
Flynn database (n⳱ 93) 18 < MW < 765 Eq. (9) 45
2.3 < log Poct< 5.5
−9.7 < log kp< −3.5
Alkanols, phenols, steroids, other drugs (n⳱ 38) 18 < MW < 462 Eq. (10) 52 1.4 < log Poct< 2.0
−9.1 < log kp< −5.3
Alkanols, phenols, steroids, other drugs (n⳱ 43) 88 < MW < 504 Eq. (11) 52 1.5 < log Poct< 3.0
−9.1 < log kp< −3.6
Alkanols, phenols, steroids, other drugs (n⳱ 40) 92 < MW < 519 Eq. (12) 52 2.5 < log Poct< 5.5
−7.7 < log kp< −3.5
Flynn database, miscellaneous compounds (n⳱ 107) 30 < MW < 391 Eq. (13) 54 1.5 < log Poct< 7.5
−9.1 < log kp< −3.8
Alkanols, steroids (n⳱ 21) 32 < MW < 362 Eq. (14) 14
0.8 < log Poct< 3.7
−9.1 < log kp< −4.9
Alkanols, phenols, miscellaneous compounds (n⳱ 37) 18 < MW < 158 Eq. (16) 56 1.4 < log Poct< 3.2
−7.1 < log kp< −3.5
Alkanols, phenols, steroids (n⳱ 46) 32 < MW < 362 Eq. (18) 57
0.8 < log Poct< 3.7
−9.1 < log kp< −4.8
Alkanols, phenols, steroids, miscellaneous compounds (n⳱ 53) 32 < MW < 392 Eq. (21) 59 0.8 < log Poct< 4.0
−7.8 < log kp< −3.5
Alkanols, phenols, steroids (n⳱ 22) 18 < MW < 362 Eq. (24) 64
1.4 < log Poct< 3.9
−9.1 < log kp< −4.8
Alkanols, phenols, drugs (n⳱ 52) 32 < MW < 303 Eq. (25) 65
0.8 < log Poct< 4.0
−7.9 < log kp< −4.7
Alkanols, phenols, steroids, barbiturates, other drugs (n⳱ 60) 18 < MW < 362 Eq. (26) 66 2.3 < log Poct< 5.5
−9.1 < log kp< −3.5
Flynn database (n⳱ 91) 18 < MW < 765 Eq. (28) 67
2.3 < log Poct< 5.5
−9.7 < log kp< −3.5
Alkanols, phenols, steroids, barbiturates, other drugs (n⳱ 98) 18 < MW < 765 Eq. (29) 70 3.7 < log Poct< 5.5
−9.7 < log kp< −3.5
Phenols, steroids, miscellaneous compounds (n⳱ 20) 94 < MW < 362 Eq. (30) 72 0.1 < log Poct< 4.6
−5.5 < log kp< −3.4
Phenols, steroids, miscellaneous compounds (n⳱ 48) 94 < MW < 453 Eq. (31) 72 0.1 < log Poct< 4.6
−6.5 < log kp< −3.3
tribution of each variable to the model is calculated using Mager’s standardization procedure (8,9).
COMMON MOLECULAR PARAMETERS USED IN QSPeRs
Molecular Size
Molecular size is believed to play a distinct role in mem-brane permeation (10,11). Drug diffusivity (D), in general, is size-dependent (i.e., large molecules diffuse more slowly than small ones).
In simple liquids, this dependence is often expressed by the Stokes–Einstein equation (12) [Eq. (2)]:
D= k⭈ T
6⭈ ⭈ ⭈ r (2) where k is Boltzmann’s constant, T the absolute temperature, the viscosity of the solvent, and r the solvated radius of the diffusing solute. For spherical molecules, Eq. (2) indicates that D is inversely proportional to the cube-root of the mo-lecular volume (V).
In more organized media such as polymers and the stra-tum corneum, the dependence on size is more severe and has empirically been described by an exponential relationship (13) [Eq. (3)]:
D= D0⭈ e−B⭈共V兲 (3)
where D0is the diffusivity of a hypothetical molecule having zero molecular volume, and B is a constant. This means that drug diffusivity across the stratum corneum decreases as mo-lecular weight (MW) increases since V and MW are interde-pendent.
Molecular size also has an impact on the skin–water par-tition coefficient (P) of a solute. The latter is frequently mod-eled with the octanol–water partition coefficient (Poct) (14,15) which depends on both the solute’s molecular volume and its polar interactions (see next section). The fact that kpdepends on both P and D, as described by Eq. (4), means that the solute’s volume contributes both positively and negatively to its permeation, as illustrated in Fig. 1 and later exemplified in Eqs. (9) and (18).
log kp= log
D⭈ P
h = log D + log P − log h (4)
A practical result of this observation is that small polar compounds often have a better permeability than expected from their lipophilicity alone, due to compensation by a higher diffusivity.
Solvatochromic Parameters
Linear solvation free-energy relationships (LSERs) are based on the solvatochromic parameters developed by Taft and colleagues (16–20). LSER analyses serve to factorize some given molecular property (Sp) of neutral organic solutes
[e.g., partitioning, retention, or permeation (14,21–24)] in terms of structural parameters such as the calculated van der Waals volume (Vw) and the so-called solvatochromic param-eters (dipolarity/polarizability*, hydrogen-bond donor acid-ity ␣, and hydrogen-bond acceptor basicity ). The linear equation [Eq. (5)] reflects a differential solvation model con-structed with an endergonic factor (i.e., the volume term ac-counting for solvophobic/hydrophobic and dispersive forces) and exergonic factors (i.e., the polar interactions represented by*, ␣, and ):
log Sp= v ⭈ Vw+ p ⭈ * + a ⭈ ␣ + b ⭈  + c (5)
where v, p, a, and b are the regression coefficients that reflect the relative contribution of each solute parameter to Sp. The constant term c includes information on the analyzed system. Although there are tables of LSER parameters and pre-dictive relations to help estimate them, LSER values of com-plex molecules are not easy to determine. Thus, methods al-ternative to LSERs and called theoretical linear solvation en-ergy relationships (TLSERs) have been developed and have been shown to be relevant tools (25,26).
Lipophilicity and Related Parameters
Lipophilicity is classically recognized as a meaningful parameter in quantitative structure–activity relationships (QSARs). It is also the single most informative and successful physicochemical property in medicinal chemistry (27,28). Not only has lipophilicity found innumerable applications in QSARs, but its study has revealed a wealth of information on intermolecular forces, intramolecular interactions, and mo-lecular structure in the broadest sense (29–31).
Lipophilicity is experimentally determined as a partition coefficient (log P, valid only for a single electrical state) or as a distribution coefficient (log D, referring to a pH-dependent mixture of neutral and ionic forms) (32). As a ratio of two concentrations at equilibrium, the partition coefficient is the net result of all intermolecular forces between a solute and the two phases between which it partitions. When a given type of interaction elicited by the solute is of similar energy in the two solvents, the two contributions compensate each other, and log P will contain no information about this type of in-teraction.
It is possible to factorize lipophilicity described by par-tition coefficients into two sets of terms [Eq. (6)]; namely, a positive cavity term related to hydrophobicity and a negative term related to polarity (33):
log P= a ⭈ V − ⌳ (6) where V is the molecular volume and⌳ is the global polarity of a given solute in a given solvent system. The slope a de-pends on the solvent system and on the method used to
cal-Fig. 1. Opposing contributions of solute molecular size to permeabil-ity where D is the drug diffusivpermeabil-ity across the stratum corneum and P its skin–water partition coefficient.
culate molecular volume whereas the⌳ term is mostly related to the solute’s H-bonding capacity. This latter parameter, how ever, also contains information on dipolarity/polarizability.
A dataset of 75 molecules belonging to different chemi-cal classes (alkanes, ketones, aliphatic alcohols, phenols, aromatic acids, aliphatic acids, anilines, and amines) and cov-ering a large range in lipophilicity and hydrogen-bonding ca-pacity was used to characterize the intermolecular interac-tions encoded by another lipophilicity-derived polarity de-scriptor; namely, the difference between log Poctand log Palk
(denoted as⌬log Poct−alk).
⌬log Poct−hep= 0.11 共±0.34兲 ⭈ * + 1.97 共±0.45兲 ⭈ 
+ 3.40 共±0.26兲 ⭈ ␣ − 0.44 共±0.28兲 (7) [n⳱ 75, r2⳱ 0.93, q2⳱ 0.92, s ⳱ 0.31, F ⳱ 295; relative
contributions: * (11%),  (27%), ␣ (62%)]. This solvato-chromic analysis using heptane (denoted as hep) as the alkane solvent demonstrates that the⌬log P parameter encodes only polar terms [Eq. (7)], as the contributions of the volume term in octanol and alkanes are similar (22,34). In fact, ⌬log P encodes mainly the H-bonding donor acidity (␣), as seen after removal of the terms with low or no significance [Eq. (8)]:
⌬log Poct−hep= 3.54 共±0.35兲 ⭈ ␣ −0.37 共±0.17兲 (8)
(n⳱ 75; r2⳱ 0.84; q2⳱ 0.83; s ⳱ 0.45; F ⳱ 377). The ⌬log
P parameter has found valuable applications in QSPeR
stud-ies; for example, in percutaneous absorption or with respect to the permeability of the blood–brain barrier (14,35–37).
Lipophilicity is also markedly influenced by intramolecu-lar interactions; that is, electronic conjugation, interactions between polar groups, and steric and hydrophobic effects (31). Moreover, several structural factors are responsible for intramolecular interactions, rendering them too complex to be expressed in the factorization of log P or log D (38).
QUANTITATIVE STRUCTURE–SKIN PERMEATION RELATIONSHIPS Background
During the last 30 years, there have been numerous at-tempts to relate the skin permeability of compounds to their
physicochemical properties. Quantitative models (i.e., QSPeRs) were seldom calculated, particularly in the earlier studies, which were primarily based on the analysis of small and closely related series. Many of these efforts revealed a linear relationship between skin permeation and lipophilicity (39,40). Others, however, reported a parabolic relationship with lipophilicity, particularly when highly lipophilic com-pounds were included (40). The problem of analyzing ho-mologous or closely related series is that there is little phys-icochemical variety in the data. This results in co-linearity between descriptors, especially for congeneric series, making it impossible to separate the effects of lipophilicity and mo-lecular size. Many examples illustrating this point have been published (41–43).
Using a larger dataset, Flynn proposed a QSPeR ap-proach for 94 compounds with a relatively broad range of properties (18 < MW < 765 and −2.3 < log Poct< 5.5) (44). Until recently, this set provided the largest available hetero-geneous database of in vitro skin permeability values across human skin. It should be noted, however, that these data were compiled from 15 different literature sources and that they necessarily demonstrate a high degree of interlaboratory vari-ability.
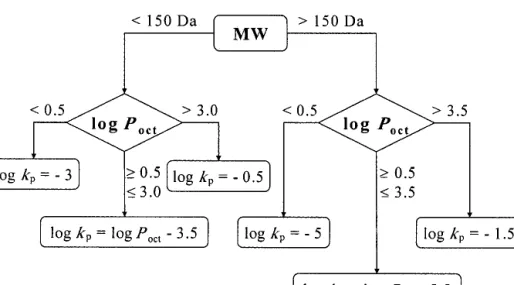
In his paper, Flynn proposed a number of algorithms to predict skin permeability, showing that lipophilicity (octanol– water partition coefficient) and molecular size were relevant parameters. A simple approach with algorithms for low- and high-molecular-weight compounds has been presented in the form of a decision tree (Fig. 2).
Flynn’s dataset was subsequently analyzed by many au-thors, and most of the predictive models presented in this article were obtained from the information in Flynn’s dataset and various subsets thereof. As clearly demonstrated in many studies, hydrogen bonding capacity, in addition to lipo-philicity and size parameters, is a relevant property influenc-ing skin permeation. Based on the latter molecular properties, QSPeR models can be classified into different groups, as pro-posed below. Moreover, as mentioned before, all permeation data were obtained from experiments using human skin
in vitro in which the diffusant was applied in aqueous
solu-tion.
Fig. 2. Decision tree for predicting approximate skin permeability coefficients (kp) based on Flynn’s
QSPeRs Based on Lipophilicity and Size Parameters
Potts and Guy (45) described a simple model based on permeant size; that is, molecular weight (MW) or molecular volume (MV) and octanol–water partition coefficient (Poct),
to predict the permeability coefficients collected by Flynn. After removal of one compound, they reported the following relationship (note that here, and in all following correlations, the units used for kpare cm⭈ s−1):
log kp= 0.72 共±0.13兲 ⭈ log Poct− 0.0059 共±0.0014兲 ⭈ MW
− 6.36 共±0.28兲 (9)
[n⳱ 93, r2 ⳱ 0.67, q2 ⳱ 0.65, s ⳱ 0.74, F ⳱ 92; relative
contributions: log Poct(53%), MW (47%)]. The physical sig-nificance of this empirical equation is clear. As the permeants become more lipophilic, their permeability increases due to better partitioning into the skin but, as they become larger, their diffusion into the skin is reduced. Our statistical analysis shows that the model is significant in terms of the descriptors used. Although the statistical fit in Eq. (9) is comparatively poor, the authors did note that up to 30% variability in ex-perimental data was to be expected (46), so that an r2 of
approximatively 70% was considered to be significant. More-over, the authors neither discussed the problem of outliers nor mentioned the name of the removed compound.
In a recent study, five algorithms based on log Poctand
molecular weight were compared in terms of predictive reli-ability for skin permeation (47–51). A large database of 99 solutes was used, and two particular algorithms stood out as better predictors of the skin permeation of highly hydrophilic and highly lipophilic chemicals compared to the model of Potts and Guy.
The difficulties in modeling Flynn’s dataset were exem-plified by Magee (52). In order to test the hypothesis that drug absorption changes with lipophilicity, the dataset was subdivided into three overlapping regions of log Poct(−1.38 to 1.96; 1.53 to 2.97; 2.50 to 5.49). A difference in the QSPeRs based on log Poctand molar refractivity (MR, standing for a size parameter) was reported [Eqs. (10)–(12)], and an in-creased importance of H-bond acceptor groups (HBA) for the most lipophilic group of chemicals was uncovered. Such results are not necessarily relevant with respect to predictive capacity, but they illustrate the mechanistic possibilities of QSPeR analyses.
Compounds with log P Ranking from −1.38 to 1.96
log kp= 0.79 共±0.14兲 ⭈ log Poct− 0.0371 共±0.0083兲 ⭈ MR
− 5.82 共±0.31兲 (10)
[n⳱ 38, r2 ⳱ 0.77, q2 ⳱ 0.73, s ⳱ 0.59, F ⳱ 58; relative
contributions: log Poct(36%), MR (64%)].
Compounds with log P Ranking from 1.53 to 2.97
log kp= 1.05 共±0.59兲 ⭈ log Poct− 0.0259 共±0.0081)⭈ MR
− 6.8 共±1.2兲 (11)
[n⳱ 43, r2 ⳱ 0.66, q2 ⳱ 0.60, s ⳱ 0.72, F ⳱ 39; relative
contributions: log Poct(33%), MR (67%)].
Compounds with log P Ranking from 2.50 to 5.49
log kp= 0.95 共±0.27兲 ⭈ log Poct− 0.037 共±0.011)⭈ MR
− 0.107 共±0.077兲 ⭈ HBA − 6.48 共±0.86兲 (12) [n ⳱ 40, r2 ⳱ 0.65, q2⳱ 0.59, s ⳱ 0.63, F ⳱ 23; relative
contributions: log Poct(26%), MR (53%), HBA (21%)]. Kirchner et al. (53) published a large database of 114 skin permeability values that incorporates much of the Flynn dataset and with additional data from Health Canada regu-latory reports. After subdivision of this dataset into five groups according to calculated molar volumes, the data were modeled, and correlations for each group were obtained with log Poct, indicating the dependence on lipophilicity. However,
the dependence of the complete dataset on lipophilicity was poor (r2⳱ 0.32).
All these data were subsequently reanalyzed by Cronin
et al. (54), who demonstrated that seven significant outliers
occurred in the set. Two of them had more than 10 sites to accept or donate a hydrogen bond (sucrose and digitoxin), and the others were estriol, atropine, hydrocortisone, etor-phine, and propylene chloride. Removal of these outliers and reanalysis against a wide variety of QSPeR parameters led to the following significant model [Eq. (13)]:
log kp= 0.773 共±0.082兲 ⭈ log Poct− 0.0103 共±0.0014)⭈ MW
− 5.89 共±0.15兲 (13)
[n⳱ 107, r2⳱ 0.86, q2⳱ 0.85, s ⳱ 0.39, F ⳱ 317; relative
contributions: log Poct(57%), MR (43%)]. Although based
on a larger dataset, Eq. (13) is very similar to Eq. (9) pro-posed by Potts and Guy (45). The statistical improvement over the original Potts and Guy model (r2 ⳱ 0.86 vs. r2 ⳱
0.67) was further investigated by Frasch et al. (55). It was discovered that of the 107 compounds studied, 63 were taken from the Occupational Safety and Health Association (OSHA) and had calculated log kpvalues based on an algo-rithm that was a trivial modification of the original Potts and Guy equation. Thus, the apparent statistical improvement re-ported by Cronin et al. (54) is an artefact caused by circular reasoning because many permeation values were not experi-mental ones. Therefore, continued use of these data would lead to a biased selection of the statistical models, an under-estimation of experimental variability, and an overunder-estimation of the predictivity of the models.
QSPeRs Based on Parameters Derived from Lipophilicity
In the early 1990s, El Tayar et al. (14) analyzed different subsets from Flynn’s dataset and pinpointed lipophilicity as a relevant parameter controlling skin permeability in most of these subsets. They also described a correlation with the⌬log
Poct−hepparameter, a measure of the hydrogen bond donor
acidity of solutes [Eq. (14)]:
log kp= −1.36 共±0.40兲 ⭈ ⌬log Poct−hep− 3.39 共±0.99兲 (14) (n⳱ 21, r2 ⳱ 0.81, q2 ⳱ 0.76, s ⳱ 0.50, F ⳱ 80). It was
further suggested that molecular size was not relevant in the dataset analyzed, but statistical bias due to two clustered con-generic series and/or differences in partition coefficient mea-surements are responsible for this erroneous conclusion. While the significance of hydrogen bonding with respect to the control of skin permeability has been well-recognized, the induction that molecular weight was not important was rightly
refuted by Potts and Guy (45), as noted in the improved Eq. (15), for the smaller dataset:
log kp= 0.80 共±0.16兲 ⭈ log Poct− 0.0108 共±0.0015)⭈ MW
− 5.91 共±0.28兲 (15)
[n⳱ 21, r2 ⳱ 0.89, q2 ⳱ 0.86, s ⳱ 0.40, F ⳱ 70; relative
contributions: log Poct(42%), MW (58%)]. This analysis sug-gested that the complex mechanism of skin permeation can-not be described by a single physicochemical parameter. In addition to hydrogen bond donor acidity implicitly contained in lipophilicity, an additional term (MW) is necessary to bet-ter predict the dataset.
QSPeRs Based on Solvatochromic Parameters
The role of a solute’s hydrogen bonding capacity in the determination of skin permeation has been investigated in detail. Potts and Guy (56), for example, developed a QSPeR model based on 37 compounds selected from Flynn’s data-base. The algorithm did not contain a lipophilicity term, but included molecular volume and descriptors for hydrogen bond donor (⌺␣H 2) and acceptor (⌺ H 2) capacity [Eq. (16)]: log kp= 0.0257 共±0.0050兲 ⭈ MV − 1.74 共±0.46兲 ⭈ ⌺␣2H − 3.85 共±2.44)⭈ ⌺2 H− 4.89 共±0.50兲 (16) [n⳱ 37, r2⳱ 0.94, q2⳱ 0.92, s ⳱ 0.24, F ⳱ 169; relative contributions: MV (38%),∑␣2H(30%),∑2H(32%)]. As
de-scribed by Eq. (16), hydrogen bonding capacity restricts skin permeability. Nevertheless, the reduced size of the dataset limits its predictability, especially for large compounds (see range in Table I). To examine the importance of H-bonding to lipophilicity, we derived the original Potts and Guy rela-tionship (45) for this same set of 37 compounds [Eq. (17)]. The high correlation between molecular volume (MV) and molecular weight (MW) for the set of compounds (r⳱ 0.90) allows one parameter to be replaced by the other.
log kp= 0.93 共±0.37兲 ⭈ log Poct− 0.013 共±0.013兲 ⭈ MW − 5.67 共±0.80兲 (17) [n⳱ 37, r2 ⳱ 0.78, q2 ⳱ 0.72, s ⳱ 0.44, F ⳱ 61; relative
contributions: log Poct(71%), MW (29%)]. Clearly MV,⌺␣H 2
and⌺H
2 together yield a better model than log Poctand MW
[compare Eqs. (17) and (16)]. It must be noted also that Eq. (17) is very similar to Eq. (9). The difference in intercepts is due to the specific set of compounds evaluated. In the latter case, however, because of the smaller dataset, molecular weight appears statistically nonsignificant.
Similar results indicating the importance of molecular size and hydrogen bonding were published by Abraham et al. (57). For a set of 46 compounds [mainly those selected by Potts and Guy (56)] in Flynn’s dataset, it was demonstrated that [Eq. (18)]: log kp= −0.59 共±0.23兲 ⭈ 2H− 0.62 共±0.43兲 ⭈ ⌺␣ 2 H − 3.43 共±0.41)⭈ ⌺2 H + 1.80 共±0.30兲 ⭈ Vx− 5.07 共±0.21兲 (18) [n⳱ 46, r2⳱ 0.96, q2⳱ 0.95, s ⳱ 0.25, F ⳱ 242; relative contributions:2H(17%),∑␣ 2 H(4%),∑ 2 H(43%), V x(36%)] whereH
2 is dipolarity/polarisability,⌺␣H2 hydrogen-bond
do-nor acidity,⌺H
2 hydrogen-bond acceptor basicity, and Vxis
the McGowan volume (58).
The much smaller positive coefficient associated with Vx
reflects in Eq. (18) the opposing influences of molecular size on lipophilicity [Eq. (19), based on the same dataset of 46 compounds] and diffusion [Eq. (3)].
log Poct= −0.98 共±0.25兲 ⭈ 2 H+ 0.68 共±0.47兲 ⭈ ⌺␣ 2 H − 3.72 共±0.44)⭈ ⌺2 H+ 4.12 共±0.33兲 ⭈ V x− 0.08 共±0.27兲 (19) [n⳱ 46, r2 ⳱ 0.96, q2⳱ 0.94, s ⳱ 0.25, F ⳱ 222; relative contributions:2H(18%),∑␣ 2 H(3%),∑ 2 H(29%), V x(50%)].
Application of the relationship described by Potts and Guy (45) to the same set of 46 compounds gives [Eq. (20)]:
log kp= 0.788 共±0.096兲 ⭈ log Poct− 1.44 共±0.18兲 ⭈ Vx
− 5.64 共±0.26兲 (20) [n⳱ 46, r2 ⳱ 0.90, q2⳱ 0.89, s ⳱ 0.37, F ⳱ 196; relative
contributions: log Poct(43%), Vx(57%)]. A clearly negative influence of molecular size is highlighted, reflecting the effect of size on the diffusion component of permeation [see Fig. 1 and Eqs. (3) and (4)].
Dealing with the problem of outliers, especially steroids, Abraham et al. (59,60) later published a relationship based on a slightly expanded dataset [Eq. (21)]:
log kp= −0.45 共±0.24兲 ⭈ R2− 0.49 共±0.23兲 ⭈ 2 H − 1.49 共±0.27兲 ⭈ ⌺␣2 H− 3.43 共±0.31)⭈ ⌺ 2 H + 1.93 共±0.25兲 Vx− 5.13 共±0.21兲 (21) [n⳱ 53, r2 ⳱ 0.96, q2⳱ 0.95, s ⳱ 0.21, F ⳱ 216; relative contributions: R2(7%),2H(12%),∑␣ 2 H(11%),∑ 2 H(38%),
Vx(32%)] where R2represents the excess molar refractivity. This correlation confirms the importance of hydrogen bond-ing when an explicit lipophilicity descriptor is absent from the QSPeR equation.
Models based on theoretical rather than experimental solvatochromic parameters have also been derived. As re-cently published, the latter parameters are very useful for the prediction of lipophilicity (61). Thus, applying the relation-ship described by Potts and Guy (45) to the same set of 53 compounds, using predicted values of lipophilicity, gives [Eq. (22)]:
log kp= 0.64 共±0.16兲 ⭈ T log Poct− 0.90 共±0.40)⭈ Vx − 5.01 共±0.43兲 (22) [n ⳱ 53, r2 ⳱ 0.65, q2⳱ 0.59, s ⳱ 0.60, F ⳱ 46; relative
contributions: T log Poct(62%), Vx(38%)] where T log Poct is the predicted value of lipophilicity in the octanol–water system. These calculations take into account intramolecular hydrogen-bonding.
Interestingly, the prediction of lipophilicity defined by 1,2-dichloroethane–water partition coefficients gives a better relationship [Eq. (23)]:
log kp= 0.46 共±0.10兲 ⭈ T log Pdce− 0.57 共±0.37)⭈ Vx
− 5.53 共±0.40兲 (23) [n⳱ 53, r2 ⳱ 0.82, q2⳱ 0.77, s ⳱ 0.42, F ⳱ 114; relative
contributions: T log Pdce(73%), Vx(27%)]. Partitioning into
the 1,2-dichloroethane–water system takes into account the acceptor and donor H-bonding capacity of a solute (22,31) whereas partitioning in octanol–water encodes mostly its ac-ceptor capacity. Consequently, the T log Pdceparameter is a
better predictor of skin permeation because it encodes two relevant properties, acceptor and donor H-bonding capacity, which occur in Eq. (21).
Pugh et al. (62) also examined the role of hydrogen bond-ing and molecular size in skin permeation. They demon-strated that hydrogen bond donor acidity predominates over acceptor basicity. The relative effect of the donor vs. acceptor capacity was quantified as being 0.6/0.4.
Other QSPeR Models
Flynn’s dataset was also analyzed by Pugh and Hadgraft using a novel, so-called ab initio approach (63) based on in-dicator variables for various molecular substructures and fea-tures. The results using a 17- or 11-descriptor model were statistically comparable to those of Potts and Guy (45). Al-though this approach lacks the simple mechanistic interpre-tation of the model of Potts and Guy based on physicochem-ical properties, it enables the prediction of skin permeability of a compound by assigning additive numerical values to its functional groups. Moreover, this method does not require experimental measurements that can often limit the develop-ment of models. This approach also highlighted compounds that had unusual permeation values, most of which (including atropine, estriol, naproxen, nicotine, nitroglycerine, sucrose, and toluene) have been identified as significant outliers in other studies.
Lien and Gao (64) analyzed a subset of Flynn’s dataset and developed a satisfactory predictive model [Eq. (24)] based on the number of hydrogen bonds formed by a com-pound (Hb), its molecular weight, and a quadratic response to lipophilicity:
log kp= −0.08 共±0.13兲 ⭈ 共log Poct兲
2+ 0.82 共±0.57兲 ⭈ log P oct
− 0.25 共±0.12兲 ⭈ Hb− 1.7 共±2.0兲 ⭈ log MW − 2.4 共±3.2兲
(24) [n⳱ 22, r2⳱ 0.95, q2⳱ 0.91, s ⳱ 0.30, F ⳱ 0.88; relative
contributions: (log Poct)2(12%), log P
oct(43%), Hb(26%),
log MW (19%)]. Although the validity of this model is limited due to the small number of compounds relative to the number of variables, it pinpoints the potential importance of hydro-gen-bonding capacity in skin permeation. The authors, how-ever, did not emphasize the strong correlation between the squared log Poctvalue and log Poct(r⳱ 0.88) and between log
Poctand log MW (r⳱ 0.73) for the set of compounds.
More-over, two parameters [(log Poct)2and log MW] are
nonsignif-icant due to large confidence intervals. Such statistical anomalies due to an insufficient number of compounds leads to an over-interpretation of the data.
A later study by Pugh et al. (65) demonstrated the use-fulness of calculated molecular charges (i.e., the sum of partial charges on atoms) as descriptors of hydrogen bonding using log (D/h) as permeation indicator estimated by the relation log kp+ 0.024 − 0.59 · log Poct(62). The relationship obtained
for a set of 52 values was [Eq. (25)]:
log共DⲐh兲 = −2.69 共±0.13兲 − 0.00268 共±0.00032兲 ⭈ MW ⭈ charge
(25) (n⳱ 52, r2⳱ 0.83, q2⳱ 0.82, s ⳱ 0.33, F ⳱ 242) where D
(cm2/s) is the diffusion coefficient and h (cm) is the diffusional
path length through the skin. This model only demonstrates
that the diffusion through the skin is inversely influenced by the permeant size, as MW and MW · charge are very strongly correlated (r⳱ 0.96). Moreover the large correlation (r ⳱ 0.90) between MW and the sum of partial charges on atoms clearly demonstrated that the latter term only reflects the permeant size and not its H-bonding capacity. Finally, be-cause 52 permeation values were used for only 40 compounds, the statistical weight of some compounds (i.e., estradiol or aliphatic alcohols) was largely increased.
Based on the complete Flynn dataset, Barratt (66) devel-oped a QSPeR model after subdividing the values into three distinct groups (steroids, other pharmacologically active com-pounds, and small compounds). Barratt’s model differs from the Potts and Guy relationship (45), since it uses molecular volume as a measure of molecular size, and includes the melt-ing point (mpt) as an additional parameter to characterize the solute’s aqueous solubility. Among the steroids, Barratt showed that a subset of hydrocortisone derivatives were poorly predicted. After removing these compounds, a signifi-cant equation [Eq. (26)] was reported for a set of 60 com-pounds:
log kp= 0.820 共±0.091兲 ⭈ log Poct− 0.0093 共±0.0021兲 ⭈ MV
− 0.004 共±0.032兲 ⭈ mpt − 5.91 共±0.22兲 (26) [n⳱ 60, r2 ⳱ 0.90, q2⳱ 0.89, s ⳱ 0.39, F ⳱ 176; relative
contributions: log Poct(49%), MV (38%), mpt (13%)]. The
statistical results clearly indicate that the melting point pa-rameter is nonsignificant. Indeed, its removal does not de-crease the statistical quality [Eq. (27)]:
log kp= 0.830 共±0.085兲 ⭈ log Poct− 0.0119 共±0.0015兲 ⭈ MV
− 5.87 共±0.22兲 (27)
[n⳱ 60, r2 ⳱ 0.89, q2⳱ 0.87, s ⳱ 0.42, F ⳱ 219; relative
contributions: log Poct(51%), MV (49%)]. In a recent study, Dearden et al. (67) analyzed the entire Flynn dataset using a large set of physicochemical descriptors. After testing no less than 81 descriptors, they developed a highly predictive but mechanistically complex QSPeR model based on six param-eters [Eq. 28]:
log kp= −2.726 − 0.626 ⭈ ⌺Ca − 23.8 ⭈ ⌺共Q+兲Ⲑ␣
− 0.289 ⭈ SsssCH − 0.0357 ⭈ SsOH − 0.482 ⭈ IB
+ 0.405 ⭈ BR (28)
(n ⳱ 91, r2 ⳱ 0.83, s ⳱ 0.56, F ⳱ 69) where ⌺Ca is the
HYBOT-PLUS H-bond acceptor free energy factor,⌺(Q+)/␣ is the HYBOT-PLUS positive charge per unit volume,
SsssCH and SsOH are electrotopological atom-type indices
for single-bonded CH and OH, IBis the Balaban index re-lated to molecular size, and BR is the number of rotatable bonds.
Although atropine, naproxen, and nicotine were outliers, the results clearly indicate that H-bond acceptor capacity and polarity are inversely correlated with skin permeability. Moreover, the number of rotatable bonds (BRterm) is
posi-tively related to permeability suggesting that a greater con-formational flexibility increases skin permeation in contrast to oral bioavailability (68). However, due to the lack of data in the publication, it was difficult to evaluate the relevance of all the terms and/or their possible intercorrelation.
In another study, Ghafourian and Fooladi (69) have demonstrated the use of theoretical parameters derived from
structural chemistry to replace solvatochromic descriptors in QSPeRs.
Recently, Buchwald and Bodor (70) developed an en-tirely structure-based model to describe human skin perme-ation [Eq. (29)]. The experimental skin-permeability data were mainly based on the compilations of Johnson et al. (71) and Wilschut et al. (47):
log kp= 0.0128 共±0.0029兲 ⭈ Ve− 0.492 共±0.0075兲 ⭈ N − 5.94 共±0.20兲 (29) [n⳱ 98, r2⳱ 0.72, q2⳱ 0.71, s ⳱ 0.62, F ⳱ 124; relative
contributions: Ve(41%), N (59%)] where Veis the effective van der Waals molecular volume, and N is the hydrogen-bonding-related N parameter, a quantized descriptor having only integer values.
The authors stated that, unlike the Potts and Guy ap-proach, their model eliminates the physicochemical interre-latedness of the parameters. However, even if Veand N are
clearly unrelated in a physicochemical perspective, they are strongly intercorrelated (r ⳱ 0.92). It is possible that such results are biased due to the nature of the dataset because, especially for drug-like compounds, more hydrogen bonding sites imply a larger molecule.
While many QSPeR models have been described, few have analyzed the possible impact of experimental differences due to the biological model used. Thus, the work of Hostynek and Magee (72) is particularly interesting. They demonstrated that the human in vivo absorption of nonrelated chemicals was influenced by both the vehicle in which the compound was dissolved and the degree of occlusion of the skin. With respect to the vehicle, the authors developed a model based on a permeability coefficient calculated from the maximum flux observed (kpMax) [Eq. (30)] and applied an indicator
vari-able (VEH) to the different vehicles used (i.e., a value of 1 for acetone and 2 for ethanol):
log kpMax= −0.60 共±0.47兲 ⭈ VEH − 0.0140 共±0.0094兲 ⭈ MR − 0.157 共±0.074兲 ⭈ HBA − 0.29 共±0.15兲 ⭈ HBD − 1.40 共±1.26兲 (30) [n⳱ 20, r2 ⳱ 0.80, q2 ⳱ 0.70, s ⳱ 0.35, F ⳱ 15; relative
contributions: VEH (23%), MR (27%), HBA (30%), HBD (20%)] where MR is the molar refractivity, HBA is the num-ber of hydrogen bond acceptors, and HBD is the numnum-ber of hydrogen bond donors. Obviously, this model is of very lim-ited value due to the large number of parameters relative to the number of compounds.
Using a larger dataset, Hostynek and Magee (72) devel-oped another relationship to assess the effect of the degree of occlusion on the permeation of compounds through human skin in vivo [Eq (31)]. In this case, an indicator variable (OCCL) for occlusion was used (i.e., a value of 1 for open, 2 for protected, and 3 for occluded):
log kpMax= 0.13 共±0.14兲 ⭈ log Poct− 0.0168 共±0.0057兲 ⭈ MR
− 0.28 共±0.014兲 ⭈ HBD − 0.26 共±0.19兲 ⭈ OCCL − 3.76 共±0.59兲 (31) [n⳱ 48, r2 ⳱ 0.66, q2 ⳱ 0.58, s ⳱ 0.43, F ⳱ 21; relative
contributions: log Poct (14%), MR (40%), HBD (28%),
OCCL (18%)]. In addition to the influence of the vehicle and the degree of occlusion on drug permeation, physicochemical parameters such as molecular size (encoded by molar
refrac-tivity) and hydrogen bonding capacity were also relevant in the latter relationships [Eqs. (30) and (31)] while log Poctin Eq. (31) was statistically nonsignificant.
General Observations on Outliers
The work of Johnson et al. (73) and Degim et al. (74) highlights the large discrepancies between skin permeability measured in different laboratories. The former group (73) re-examined the results for steroids previously measured by Scheuplein et al. (75). The latter study (74) reanalyzed other compounds (naproxen, atropine, and nicotine) from the Flynn dataset (44), for which experimental values differ by one or two log units from those published by Flynn. Thus, it appears that some of the permeability coefficients in Flynn’s dataset, a well-known reference in the field of skin perme-ation, may be questioned.
Such observations can help to identify some significant outliers and to make an informed decision in selecting data (76,77). Moreover, as the removal of outliers can have a great influence on the statistical validity of any model, special at-tention needs to be paid to the origin of the data.
CONCLUSIONS
The aim of this critical evaluation was to revisit the most significant models to predict skin permeation. The large num-ber of models that have been developed highlights their use-fulness as predictive tools in both the drug delivery and toxi-cology fields. Such quantitative structure–permeation rela-tionships do not rely on expensive and time-consuming human studies or on the use of animal models. Moreover, they are most accurate for compounds within similar classes and are also useful to predict absorption at the design stage (i.e., prior to their synthesis and further development). Cer-tain limitations of these models, however, must be stressed. An inherent problem lies in the fact that their applicability is restricted by the limited range of polarity and size of the permeants on which they are based. In addition, most of the models use large compilations of data from various investi-gators and laboratories employing different experimental protocols. Thus, while these models reasonably explain the skin permeabilities of compounds falling in the lower molecu-lar size range and in the middle range of lipophilicity, diver-gence for very hydrophilic (in particular, charged) and very lipophilic (i.e., those substances least well-represented in the datasets) compounds is evident. In the latter case, the rate-controlling role of the stratum corneum is questionable, and the impact of the viable epidermis/upper dermis (i.e., a hy-drophilic barrier) must be taken into account (10). Further-more, rigorous statistics show that some models are based on nonsignificant descriptors. As such, they do not afford mecha-nistic insights and may lead to over-interpretation of the data.
ACKNOWLEDGMENTS
Financial support was provided by the Fonds national suisse de la recherche scientifique (FNRS) and by the Pro-gramme commun de recherche en génie biomédicale (Uni-versities of Geneva and Lausanne and the Ecole polytech-nique fédérale, Lausanne).
REFERENCES
1. D. Howes, R. H. Guy, J. Hadgraft, J. Heylings, U. Hoeck, F. Kemper, H. I. Maibach, J. P. Marty, H. Merk, J. Parra, D. Rek-kas, I. Rondelli, H. Schaefer, U. Täuber, and N. Verbiese. Meth-ods for assessing percutaneous absorption. ATLA 24:81–106 (1996).
2. E. L. Cussler. Diffusion: Mass Transfer in Fluid Systems, 2nd ed. Cambridge University Press, New York, 1997.
3. J. C. Shah. Analysis of permeation data: evaluation of the lag time method. Int. J. Pharm. 90:161–169 (1993).
4. B. W. Barry. Dermatological Formulations. Dekker, New York, 1983.
5. S. Wold. Validation of QSAR’s. Quant. Struct. Act. Relat. 10:191– 193 (1991).
6. H. Kubinyi. QSAR and 3D QSAR in drug design. Part 1: meth-odology. Drug Discovery Today 2:457–467 (1997).
7. A. Golbraikh and A. Tropsha. Beware of q2! J. Mol. Graphics
Model. 20:269–276 (2002).
8. H. Mager and A. Barth. Problems involved in the specification and interpretation of quantitative structure-activity relationships. Pharmazie 34:557–559 (1979).
9. P. P. Mager. Non-least-squares regression analysis applied to or-ganic and medicinal chemistry. Med. Res. Rev. 14:553–588 (1994). 10. A. L. Bunge and R. L. Cleek. A new method for estimating der-mal absorption from chemical exposure. 2. Effect of molecular weight and octanol-water partitioning. Pharm. Res. 12:88–95 (1995).
11. T. X. Xiang and B. D. Anderson. The relationshipo between per-meant size and permeability in lipid bilayer membranes. J. Mem-brane Biol. 140:111–122 (1994).
12. A. N. Martin. Physical Pharmacy. Physical Chemical Principle in the Pharmaceutical Sciences. Les & Febiger, Philadelphia, 1993. 13. G. B. Kasting, R. L. Smith, and E. R. Cooper. Effect of lipid
solubilities and molecular size on percutaneous absorption. In B. Shroot and H. Schaefer (eds.), Skin Pharmacokinetics. Karger, Basel, 1987, pp. 138–153.
14. N. El Tayar, R. S. Tsai, B. Testa, P. A. Carrupt, C. Hansch, and A. Leo. Percutaneous penetration of drugs: a quantitative struc-ture-permeability relationship study. J. Pharm. Sci. 80:744–749 (1991).
15. M. S. Roberts, W. J. Pugh, and J. Hadgraft. Epidermal perme-ability: penetrant structure relationships. 2. The effect of H-bonding groups in penetrants on their diffusion through the stra-tum corneum. Int. J. Pharm. 132:23–32 (1996).
16. M. J. Kamlet and R. W. Taft. The solvatochromic comparison method. I. The -scale of solvent hydrogen-bond acceptor (HBA) basicities. J. Am. Chem. Soc. 98:377–383 (1976). 17. R. W. Taft and M. J. Kamlet. The solvatochromic comparison
method. 2. The␣-scale of solvent hydrogen-bond donor (HBD) acidities. J. Am. Chem. Soc. 98:2886–2894 (1976).
18. D. E. Leahy. Intrinsic molecular volume as a measure of the cavity term in linear solvation energy relationships: octanol-water partition coefficients and aqueous solubilities. J. Pharm. Sci. 75: 629–636 (1986).
19. M. H. Abraham and H. S. Chadha. Application of a solvation equation to drug transport properties. In V. Pliska, B. Testa, and H. van de Waterbeemd (eds.), Lipophilicity in Drug Action and Toxicology. VCH Publishers, Weinheim, 1996, pp. 311–337. 20. M. H. Abraham. Scales of solute hydrogen-bonding: their
con-struction and application to physicochemical and biochemical processes. Chem. Soc. Rev. 22:73-83 (1993).
21. A. Pagliara, G. Caron, G. Lisa, W. Fan, P. Gaillard, P. A. Car-rupt, B. Testa, and M. H. Abraham. Solvatochromic analysis of di-n-butyl ether/water partition coefficients as compared to other solvent systems. J. Chem. Soc. Perkin Trans. 2:2639–2643 (1997). 22. G. Steyaert, G. Lisa, P. Gaillard, G. Boss, F. Reymond, H. H. Girault, P. A. Carrupt, and B. Testa. Intermolecular forces ex-pressed in 1,2-dichloroethane/water partition coefficient: a solva-tochromic analysis. J. Chem. Soc. Faraday Trans. 93:401–406 (1997).
23. A. Pagliara, E. Khamis, A. Trinh, P. A. Carrupt, R. S. Tsai, and B. Testa. Structural properties governing retention mechanisms on RP-HPLC stationary phase used for lipophilicity measure-ments. J. Liquid Chromatogr. 18:1721–1745 (1995).
24. M. H. Abraham, H. S. Chadha, and R. C. Mitchell. Hydrogen bonding. 33. Factors that influence the distribution of solutes between blood and brain. J. Pharm. Sci. 83:1257–1268 (1994). 25. G. R. Famini and L. Y. Wilson. Using theoretical descriptors in
quantitative structure activity relationships and linear free energy relationships. Network Science Co., 1116 Miller Mountain Road, Saluda, NC 28773. www.netsci.org/Science/Compchem/ feature08.html (1996).
26. J. S. Murray, P. Politzer, and G. R. Famini. Theoretical alterna-tives to linear solvation energy relationships. J. Mol. Struct. 454: 299–306 (1998).
27. C. Hansch and A. Leo. Substituent Constants for Correlation Analysis in Chemistry and Biology. John Wiley & Sons, New York, 1979.
28. W. T. Nauta and R. F. Rekker (eds), The Hydrophobic Fragmen-tal Constant. Elsevier, Amsterdam, 1977.
29. B. Testa, L. B. Kier, and P. A. Carrupt. A systems approach to molecular structure, intermolecular recognition, and emergence-dissolvence in medicinal research. Med. Res. Rev. 17:303–327 (1997).
30. B. Testa, P. A. Carrupt, P. Gaillard, F. Billois, and P. Weber. Lipophilicity in molecular modeling. Pharm. Res. 13:335–343 (1996).
31. V. Pliska, B. Testa, and H. van de Waterbeemd (eds). Lipophilic-ity in Drug Action and Toxicology. VCH, Weinheim, 1996. 32. B. Testa, H. van de Waterbeemd, G. Folkers, and R. H. Guy
(eds). Pharmacokinetic Optimization in Drug Research: Biologi-cal, Physicochemical and Computational Strategies. Wiley-VHCA, Zurich, 2001.
33. N. El Tayar, B. Testa, and P. A. Carrupt. Polar intermolecular interactions encoded in partition coefficients: an indirect estima-tion of hydrogen-bond parameters of polyfuncestima-tional solutes. J. Phys. Chem. 96:1455–1459 (1992).
34. G. Caron, F. Reymond, P. A. Carrupt, H. H. Girault, and B. Testa. Combined molecular lipophilicity descriptors and their role in understanding intramolecular effects. Pharm. Sci. Tech-nol. Today 2:327–335 (1999).
35. R. C. Young, R. C. Mitchell, T. H. Brown, C. R. Ganellin, R. Griffiths, M. Jones, K. K. Rana, D. Saunders, I. R. Smith, N. E. Sore, and T. J. Wilks. Development of a new physicochemical model for brain penetration and its application to the design of centrally acting H2receptor histamine antagonists. J. Med. Chem. 31:656–671 (1988).
36. C. R. Ganellin, A. Fkyerat, S. K. Hosseini, Y. S. Khalaf, A. Pi-ripitsi, W. Tertiuk, J. M. Arrang, M. Garbarg, X. Ligneau, and J. C. Schwartz. Structure-activity studies with histamine H3
-receptor ligands. J. Pharm. Belg. 50:179–187 (1995).
37. C. R. Ganellin, A. Fkyerat, B. Bang-Andersen, S. Athmani, W. Tertiuk, M. Garbarg, X. Ligneau, and J. C. Schwartz. A novel series of (phenoxyalkyl)imidazoles as potent H3-receptor
hista-mine antagonists. J. Med. Chem. 39:3806–3813 (1996).
38. B. Testa, P. A. Carrupt, P. Gaillard, and R. S. Tsai. Intramolecu-lar interactions encoded in lipophilicity: their nature and signifi-cance. In V. Pliska, B. Testa, and H. van de Waterbeemd (eds.), Lipophilicity in Drug Action and Toxicology. VCH Publishers, Weinheim, 1996, pp. 49–71.
39. M. S. Roberts, R. A. Anderson, and J. Swarbrick. Permeability of human epidermis to phenolic compounds. J. Pharm. Pharmacol. 29:677–683 (1977).
40. R. J. Scheuplein and I. H. Blank. Permeability of the skin. Phar-macol. Rev. 51:702–747 (1971).
41. J. Houk and R. H. Guy. Membrane models for skin penetration studies. Chem. Rev. 88:455–471 (1988).
42. G. Ridout, J. Houk, R. H. Guy, G. C. Santus, J. Hadgraft, and L. L. Hall. An evaluation of structure-penetration relationships in percutaneous absorption. Farmaco 47:869–892 (1992). 43. R. H. Guy and J. Hadgraft. Structrure-activity correlations in
per-cutaneous absorption. In R. L. Bronaugh and H. I. Maibach (eds.), Percutaneous Absorption. Mechanisms Methodology -Drug Delivery. Marcel Dekker, New York, 1989, pp. 95–109. 44. G. L. Flynn. Physicochemical determinants of skin absorption. In
T. R. Gerrity and C. J. Henry (eds.), Principles of Route-to-Route Extrapolation for Risk Assessment. Elsevier, Amsterdam, 1990, pp. 93–127.
45. R. O. Potts and R. H. Guy. Predicting skin permeability. Pharm. Res. 9:663–669 (1992).
46. D. Southwell, B. W. Barry, and R. Woodford. Variations in per-meability of human skin within and between specimens. Int. J. Pharm. 18:299–309 (1984).
47. A. Wilshut, W. F. ten Berge, P. J. Robinson, and T. E. McKone. Estimating skin permeation. The validation of five mathematical skin permeation models. Chemosphere 30:1275–1296 (1995). 48. R. H. Guy and R. O. Potts. Penetration of industrial chemicals
across the skin: a predictive model. Am. J. Ind. Med. 23:711–719 (1993).
49. T. E. McKone and R. A. Howd. Estimating dermal uptake of nonionic organic chemicals from water and soil. I. Unified fugac-ity-based models for risk assessments. Risk Anal. 12:543–557 (1992).
50. S. L. Brown and J. E. Rossi. A simple method for estimating dermal absorption of chemicals in water. Chemosphere 19:1989– 2001 (1989).
51. V. Fiserova-Bergerova, J. T. Pierce, and P. O. Droz. Dermal ab-sorption potential of industrial chemicals: criteria for skin nota-tion. Am. J. Ind. Med. 17:617–635 (1990).
52. P. S. Magee. Some novel approaches to modelling transdermal penetration and reactivity with epidermal proteins. In J. Devillers (ed.), Comparative QSAR. Taylor & Francis, London, 1998, pp. 137–168.
53. L. A. Kirchner, R. P. Moody, E. Doyle, R. Bose, J. Jeffery, and I. Chu. The prediction of skin permeability by using physicochem-ical data. ATLA 25:359–370 (1997).
54. M. T. D. Cronin, J. C. Dearden, G. P. Moss, and G. Murray-Dickson. Investigation of the mechanism of flux across human skin in vitro by quantitative structure-permeability relationships. Eur. J. Pharm. Sci. 7:325–330 (1999).
55. H. F. Frasch and D. P. Landsittel. Regarding the sources of data analyzed with quantitative structure-skin permeability relation-ship methods (commentary on “Investigation of the mechanism of flux across human skin in vitro by quantitative structure-permeability relationships”). Eur. J. Med. Chem. 15:399–403 (2002).
56. R. O. Potts and R. H. Guy. A predictive algorithm for skin per-meability: the effects of molecular size and hydrogen bond activ-ity. Pharm. Res. 12:1628–1633 (1995).
57. M. H. Abraham, H. S. Chadha, and R. C. Mitchell. The factors that influence skin penetration of solutes. J. Pharm. Pharmacol. 47:8–16 (1995).
58. M. H. Abraham and J. C. McGowan. The use of characteristic volumes to measure cavity terms in reversed phase liquid chro-matography. Chromatographia 23:243–246 (1987).
59. M. H. Abraham, F. Martins, and R. C. Mitchell. Algorithms for skin permeability using hydrogen bond descriptors: the problem of steroids. J. Pharm. Pharmacol. 49:858–865 (1997).
60. M. H. Abraham, H. S. Chadha, F. Martins, R. C. Mitchell, M. W. Bradbury, and J. A. Gratton. Hydrogen bonding part. 46. A re-view of the correlation and prediction of transport properties by
an LFER method: physicochemical properties, brain penetration and skin permeability. Pestic. Sci. 55:75–88 (1999).
61. S. Rey. Hydrogen-bonds and Other Recognition Forces in Mo-lecular Modeling. Ph.D. Thesis, University of Lausanne (2002). 62. W. J. Pugh, M. S. Roberts, and J. Hadgraft. Epidermal
perme-ability - penetrant structure relationships. 3. The effect of hydro-gen bonding interactions and molecular size on diffusion across the stratum corneum. Int. J. Pharm. 138:149–165 (1996). 63. W. J. Pugh and J. Hadgraft. Ab initio prediction of human skin
permeability coefficients. Int. J. Pharm. 103:163–178 (1994). 64. E. J. Lien and H. Gao. QSAR analysis of skin permeability of
various drugs in man as compared to in vitro and in vitro studies in rodents. Pharm. Res. 12:583–587 (1995).
65. W. J. Pugh, I. T. Degim, and J. Hadgraft. Epidermal permeabil-ity-penetrant structure relationships. 4. QSAR of permeant dif-fucion across human stratum corneum in terms of molecular weight, H-bonding and electronic charge. Int. J. Pharm. 197:203– 211 (2000).
66. M. D. Barratt, Quantitative structure-activity relationships for skin permeability. Toxicol. in Vitro 9:27–37 (1995).
67. J. C. Dearden, M. T. D. Cronin, H. Patel, and O. A. Raevsky. QSAR prediction of human skin permeability coefficients. J. Pharm. Pharmacol. 52(Suppl):221 (2000).
68. D. F. Veber, S. R. Johnson, H. Y. Cheng, B. R. Smith, K. W. Ward, and K. D. Kopple. Molecular properties that influence the oral bioavailability of drug candidates. J. Med. Chem. 45:2615– 2623 (2002).
69. T. Ghafourian and S. Fooladi. The effect of structural QSAR parameters on skin penetration. Int. J. Pharm. 217:1–11 (2001). 70. P. Buchwald and N. Bodor. A simple, predictive, structure-based
skin permeability model. J. Pharm. Pharmacol. 53:1087–1098 (2001).
71. J. E. Johnson, D. Blankstein, and R. Langer. Evaluation of solute permeation through the stratum corneum: lateral bilayer diffu-sion as the primary transport mechanism. J. Pharm. Sci. 86:1162– 1172 (1997).
72. J. J. Hostynek and P. S. Magee. Modelling in vivo human skin absorption. Quant. Struct. Act. Relat. 16:473–479 (1997). 73. M. E. Johnson, D. Blankschtein, and R. Langer. Permeation of
steroids through human skin. J. Pharm. Sci. 84:1144–1146 (1995). 74. I. T. Degim, W. J. Pugh, and J. Hadgraft. Skin permeability data:
anomalous results. Int. J. Pharm. 170:129–133 (1998).
75. R. J. Scheuplein, I. H. Blank, G. J. Baruner, and D. J. MacFar-lane. Percutaneous absorption of steroids. J. Invest. Dermatol. 52: 63–70 (1969).
76. B. E. Vecchia and A. Bunge. Evaluating the transdermal perme-ability of chemicals. In R. H. Guy and J. Hadgraft (eds.), Trans-dermal Drug Delivery. Marcel Dekker, New York, 2003, pp. 25– 55.
77. B. E. Vecchia and A. Bunge. Skin absorption databases and pre-dictive equations. In R. H. Guy and J. Hadgraft (eds.), Transder-mal Drug Delivery. Marcel Dekker, New York, 2003, pp. 57–141.