Joint inversion of local, regional and teleseismic data for crustal
thickness in the Eurasia–Africa plate boundary region
Federica Marone, Mark van der Meijde, Suzan van der Lee and Domenico Giardini
Institute of Geophysics, ETH H¨onggerberg (HPP), CH-8093 Z¨urich, Switzerland. E-mail: [email protected]Accepted 2003 March 5. Received 2003 January 6; in original form 2002 August 21
S U M M A R Y
A new map for the Moho discontinuity (EAM02) in the Eurasia–Africa plate boundary region is presented. Reliable results have also been obtained for the southern and eastern Mediterranean Basin, the northern African coasts and the eastern Atlantic Ocean, regions only occasionally considered in studies on the Mediterranean region. The Moho topography model is derived from two independent sets of constraints. Information contained in the fundamental and higher-mode Rayleigh waves obtained from waveform higher-modelling is used to constrain the Moho depth between estimates of crustal thickness taken from published reflection and refraction surveys, gravity studies and receiver function analysis. Strong lateral variations in the Moho topography have been observed in the Mediterranean Sea, confirming the complex evolution of this plate boundary region. In the west, the Moho discontinuity has been found at 15–20 km depth, suggesting extended and, at least in some locations, oceanic crust, while in the east the crust is on average 25–30 km thick. There it is interpreted either as Mesozoic oceanic or thinned Precambrian continental crust covered by thick sedimentary deposits. Standard continental crust (30–35 km) is observed along the eastern part of the northern African coast, while to the west a rapid change from a relatively deep Moho (down to 42 km) below the Atlas Mountain Range to the thin crust of the southwestern Mediterranean Sea has been found. The crust beneath the eastern North Atlantic Ocean can be up to 5 km thicker compared with standard oceanic crust (6 km). The crust has been interpreted to be heterogeneous as a consequence of irregular magma supply at the Mid-Atlantic ridge. In addition, serpentinization of the sub-Moho mantle could contribute to the imaging of apparently anomalous thick oceanic crust. In Europe, the presence of crustal roots (>45 km) beneath the major mountain belts has been confirmed, while thin crust (<25 km) has been found beneath extensional basins. Comparing the obtained Moho topography and Moho depth computed assuming isostatic compensation at 60 km depth shows that most of the Mediterranean and eastern Atlantic region appears to be in isostatic equilibrium. The large positive residuals observed for the eastern Mediterranean are likely to be due to overestimating crustal thickness, owing to the thick sediment deposits present.
Key words: broad-band, isostasy, Mediterranean, Moho discontinuity, Rayleigh waves, wave-form analysis.
1 I N T R O D U C T I O N
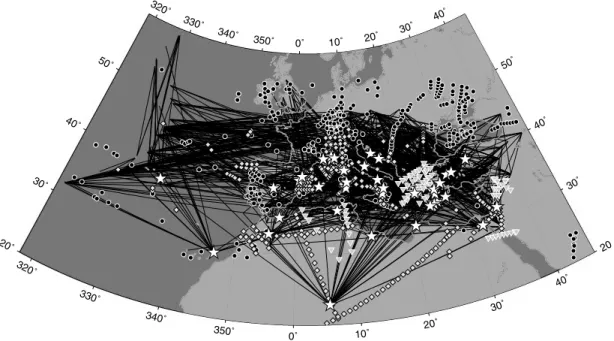
The Eurasia–Africa plate boundary region (Fig. 1), extending from the Azores triple junction in the Atlantic Ocean to Turkey and the easternmost Mediterranean Sea, is a tectonically complex area.
Better knowledge of the crustal structure in a region as com-plex as the Mediterranean is important to better understand the past and present tectonic and geodynamic evolution. A detailed crustal model will also improve the accuracy of locating local and regional earthquakes. Moreover, since most data sets used in mantle seismic tomography are sensitive to crustal structure, but cannot resolve
details within the crust, accurate crustal corrections are essential to prevent mapping crustal features in upper-mantle tomographic images and thus biasing the modelled structure.
Since a major requirement of achieving a more detailed Moho depth map is more homogeneous data coverage of the Mediter-ranean region, a temporary network consisting of 25 broad-band three-component seismic stations has been installed in the Eurasia– Africa plate boundary area during the international MIDSEA (Man-tle Investigation of the Deep Suture between Eurasia and Africa) project (Van der Lee et al. 2001). Careful placing of the single seis-mic stations complements the data coverage provided by existing
330˚ 330˚ 340˚ 340˚ 350˚ 350˚ 0˚ 0˚ 10˚ 10˚ 20˚ 20˚ 30˚ 30˚ 40˚ 40˚ 30˚ 30˚ 40˚ 40˚ 50˚ 50˚ Ea ste rn A tla ntic O cea n Ionian Sea Algero - Proven, cal Basin Sirte Basin Tyrrhenian Sea Azores Mid -A tla ntic R idg e Malta escarp ment Aegean Sea Black S ea Adriatic Sea Alb. Sea LevantineSea Lig. Sea Alps Apennines Pyrenees Massif Central Rhin e Gra be n Betics Atlas Mountain Range Maghrebides Dinarid es Hellenides Carpat hians Pannonian Basin Vrancea Moesia n Basin
Figure 1. Topographic map of the Eurasia–Africa plate boundary region.
networks and stations in the region. Consequently, most MIDSEA stations are located on islands as well as in northern Africa.
This study presents a new map for the Moho in the Eurasia– Africa plate boundary region. We combine new surface wave data recorded by the MIDSEA network with new information from re-cent refraction/reflection profiles (e.g. Doser et al. 1997; Bohnhoff
et al. 2001), receiver function analyses (e.g. Sandvol et al. 1998;
Van der Meijde et al. 2003) and gravity studies (e.g. Mickus & Jallouli 1999). We present the first map for the Moho depth cover-ing the whole Mediterranean with reliable results for the southern and eastern Mediterranean Basin, the northern African coasts and Atlantic Ocean. This Moho map has been used to assess first-order Airy isostatic compensation in the Mediterranean region.
1.1 Tectonic background
The Mediterranean Basin is mainly dominated by slow conver-gence between Africa and Eurasia, accommodated by subduction of the Mesozoic oceanic lithosphere, e.g. along the Hellenic and the Calabrian arc, and by the formation of curved Paleo- and Neogene orogenies such as the Alps, Carpathians, Betics and Rif, Calabria and Apennines, Hellenides and Dinarides and Maghrebides. Al-though convergence acts as the primary plate tectonic process in this region, backarc basins such as the Algero-Proven¸cal, Tyrrhe-nian and Aegean basins have also been formed during episodes of relatively fast extension related to slab retreat. Moreover, the Azores archipelago is characterized by transtensional deformation, while in the eastern Atlantic Ocean the major ongoing process is strike-slip faulting. The complex tectonic evolution of the plate boundary region, described in detail in Dercourt et al. (1986), Dewey et al. (1989), De Jonge et al. (1994) and Wortel & Spakman (2000), yields a complex 3-D crustal structure with large and small-scale features and a strongly perturbed crust–mantle boundary.
1.2 Previous studies
The Mohorovi˘ci`c (Moho) discontinuity has been the target of sev-eral crustal studies published for parts of the Mediterranean region. Detailed local studies exist for parts of Italy (Egger 1992), Spain (Banda et al. 1981a,b) and Greece (Makris 1985). The results of
these local studies have been used to compile regional models for the Mediterranean region. In 1987, Meissner et al. (1987) presented a Moho map for the Mediterranean area from Spain to Greece but not covering the southern and eastern part of the Mediterranean Sea. Although their map is constrained by a large amount of seismic data, it still shows large regions for which the Moho depth is based only on interpolation. At the same time Geiss (1987) published a simi-lar work but with additional seismological data for northern Africa, especially Morocco, Egypt and Israel. However, the uncertainties on Moho depth in the eastern and southern parts of his map are as large as 10 km. More recently, Du et al. (1998) compiled a 3-D re-gionalized model of the European crust and upper-mantle velocity structure, including the southern Mediterranean region and northern Africa, but using a regional averaged model for these areas.
One of the first surface wave dispersion studies, presenting region-alization of the crust for parts of the Mediterranean region, has been published by Calcagnile & Panza (1990). The recent regional crustal model of Pasyanos & Walter (2002), also derived from surface wave dispersion results, covers a broader region than the studies above. However, the average scale of the mapped features, especially in the Mediterranean region, is not comparable to the size of the struc-tures observed there, owing to data characteristics and the long-path seismograms used.
The Mediterranean is also described in global models of the Earth’s crust by Mooney et al. (1998) and Bassin et al. (2000). The first compilation is specified on a coarse grid of 5◦× 5◦. Bassin
et al. (2000) updated the previous model with more current global
sediment and crustal thickness data. This refined version is defined on a 2◦× 2◦grid. However, for the oceanic region and the Mediter-ranean Sea the model is poorly constrained by data, owing to the lack of refraction and reflection studies in these regions. Even this finer grid still gives too coarse and rough a view of the crust in such a complex region as the Mediterranean, where small-scale structures are expected.
All the aforementioned studies have some drawbacks. Local in-vestigations are too limited compared with the scale of the Mediter-ranean area. Conversely, regional models suffer from inhomo-geneous data coverage, causing large regions to be constrained only by interpolated values for the Moho depth. Furthermore, the algorithm used to interpolate between point measurements of
320 ˚ 320 ˚ 330 ˚ 330 ˚ 340˚ 340˚ 350˚ 350˚ 0˚ 0˚ 10˚ 10˚ 20˚ 20˚ 30˚ 30˚ 40˚ 40˚ 20 ˚ 20 30˚ 30˚ 40˚ 40˚ 50 ˚ 50˚
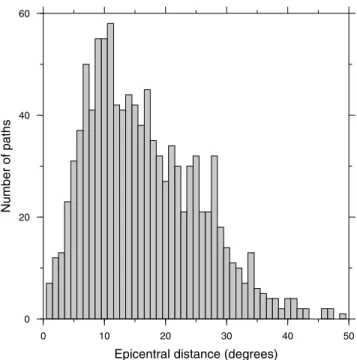
Figure 2. Geographical distribution of constraints used in the 3-D inversion: wave paths (solid lines) that produced linear constraints through waveform fitting
and locations with previous observations of the crustal thickness (white stars, receiver function studies; black circles, data set of Mooney et al. (2002); grey diamonds, refraction and reflection profiles; grey inverted triangles, gravity studies) (see the Appendix for a complete list of references).
regional compilations is based only on a mathematical approach (mainly a linear interpolation). Regional crustal models derived from surface wave dispersion measurements suffer from the averag-ing out of small-scale features characteristic to the Mediterranean region. Nor are global compilations accurate enough in describing the spatial variation in the Moho topography there.
Detailed Moho depth maps for the eastern Atlantic Ocean hardly exist. The available studies are either reflection and refraction pro-files for selected locations (Potts et al. 1986; Pinheiro et al. 1992) or global crustal thickness compilations (Mooney et al. 1998) based mainly on average crustal models and only poorly constrained by data.
2 D AT A
Our Moho map for the Mediterranean region is derived from two in-dependent sets of constraints (Fig. 2). The primary data set includes estimates of crustal thickness taken from published reflection and refraction surveys, gravity studies and receiver function analysis. Information contained in the surface waves is used to constrain the Moho depth between these point measurements.
2.1 Constraints on crustal thickness
About half the estimates of the crustal thickness included here come from the compilation of Mooney et al. (2002), and the rest from individual publications. The list of references, subdivided into dif-ferent types of data used, can be found in the Appendix. The crustal thickness beneath a few stations belonging to the temporary MID-SEA and to the permanent TGRS network has been estimated from receiver function analysis following Van der Meijde et al. (2003). These estimates have also been included in this study and are listed in Table 1. In addition, since only a few Moho depth estimates exist for the eastern Atlantic region and surface wave information is lim-ited owing to a limlim-ited number of crossing paths (Fig. 2), we force the Moho depth to stay close to 10 km (standard oceanic crust)
Table 1. Locations of broad-band stations, number of receiver functions
used and resulting values for Moho depth.
Station Latitude Longitude N Moho (km)
DGI 40.3181 9.6067 19 34 GRI 38.8219 16.4197 16 43 MGR 40.1378 15.5531 9 23 SOI 38.0733 16.0547 24 35 SAOF 43.986 7.553 29 21 RUSF 43.943 5.486 13 33 SMPL 42.094 9.285 32 35
where the water is deeper than 2000 m and the surface waves do not require otherwise. Uncertainties related to the individual point measurements differ depending on the method used to determine the crustal thickness estimate. Under the assumption of a flat Moho (e.g. Van der Meijde et al. 2003), crustal thickness data obtained with receiver function analysis have an error of around±1–2 km. Uncertainties related to the results of refraction and/or reflection seismology vary depending on the data quality. Moho depth esti-mates obtained from refraction seismics can have an uncertainty as small as 1.5 km (Bohnhoff et al. 2001). In general, the results of gravity studies have larger errors.
2.2 Surface waves
For interpolation between the point estimates of the crustal thick-ness, information contained in broad-band S and surface waves is used. Seismograms from regional earthquakes recorded at broad-band seismic stations in the Mediterranean region (Europe, north-ern Africa, Middle East countries and islands in the Atlantic Ocean) belonging to different European networks (Swiss National Network, IRIS/IDA, IRIS/USGS, MedNet, University of Trieste, G´eoscope, R´eNaSS, TGRS, GEOFON, GRSN, GRF, University of Stuttgart, GII, University of Barcelona, University of Madrid, Inst. Andaluz, Czech National Seismological Network (CZ), NARS, GI Budapest,
0 20 40 60 Number of paths 0 10 20 30 40 50
Epicentral distance (degrees)
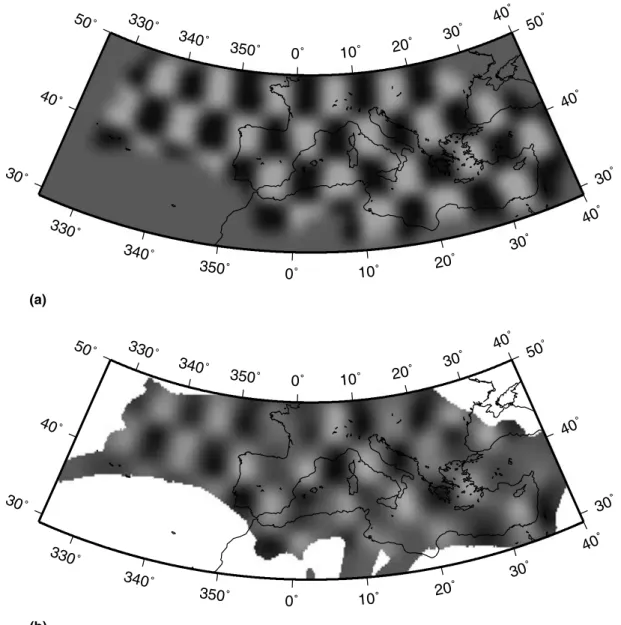
Figure 3. Distribution of the epicentral distance of wave paths used for
waveform fitting.
Blacknest) are studied. It is impossible to obtain homogeneous data coverage, given the uneven distribution of seismic stations and events in the Mediterranean region. Moreover, because of its ex-tremely complex crust and upper-mantle structure, we needed to use shorter paths than in previous studies (e.g. Zielhuis & Nolet 1994) to avoid phases distorted by scattered energy. Therefore, we temporarily installed 25 broad-band three-component seismic sta-tions during the MIDSEA project (Van der Lee et al. 2001) in regions poorly covered, such as the north African coasts and Mediterranean islands. Using the seismograms from these new stations provided us with more and shorter paths than used in previous studies.
We analysed the S and surface waves (for a frequency window between 6 and 60–100 mHz) from 235 regional events recorded on 1136 vertical and radial seismograms with a good signal-to-noise ratio. We considered earthquakes with a magnitude of between 4.4 and 7.6. The distribution of the epicentral distance is shown in Fig. 3. The median path-length is 15◦and the paths are shorter than 30◦, except for the events located in the Atlantic Ocean.
Synthetic seismograms have been calculated using the hypocentre location and origin time provided by the NEIC Preliminary Deter-mination of centres for recent events. For older earthquakes, the source parameters used come from Engdahl et al. (1998). The mo-ment tensor solutions were taken when available from the on-line Harvard catalogue (e.g. Dziewonski et al. 1994). For smaller re-gional events we used the solutions computed by Braunmiller et al. (2002). In a few cases we adopted the results from the on-line MedNet catalogue or those of Thio et al. (1999).
3 M E T H O D
To interpolate between point measurements of the Moho depth, we use the Partitioned Waveform Inversion (PWI) method. The results are the map of the Moho discontinuity (EAM02) presented here, together with a 3-D upper-mantle S-velocity model for the region discussed separately (Marone et al. 2003). This joint inversion for the Moho depth and the S-velocity structure mutually reduces biases of assumptions for one of these on the results for the other.
The PWI was introduced and applied to a 2-D case by Nolet (1990). Originally, only perturbations in the S-velocity structure were considered, while the effect of variations in Moho depth was included in later calculations by Das & Nolet (1995) using partial derivatives derived by Woodhouse & Wong (1986). For a detailed description of the method in 3-D, see Van der Lee & Nolet (1997).
In the first part of PWI, linear constraints on the average S-velocity structure and Moho depth along each path are determined by non-linear waveform fitting of wave trains composed of fundamental and higher-mode surface waves. Particularly sensitive to crustal struc-ture is the high-frequency part of the fundamental mode surface wave. To use high-frequency waveforms not biased by scattered en-ergy, we have included as many short-path seismograms as possible. The non-linear nature of the waveform fitting procedure requires the use of 1-D starting models close to the average S-velocity structure along each path. For continental paths, we chose models derived from iasp91 (Kennett & Engdahl 1991) with different crustal thick-nesses, while for paths crossing comparable amount of sea and land, we introduced a water layer (2 or 4 km thick for waves travelling through the Mediterranean region or the Atlantic Ocean, respec-tively) to simulate the mixed character of the crossed region.
In the second part of the PWI, constraints obtained from the wave-form fitting and independent point estimates of the Moho depth are jointly inverted for S velocity and crustal thickness. The linear con-straints obtained for the Mediterranean region from individual seis-mogram fits are characterized by a crust thinner than the 35 km of
iasp91 and show lower S velocities in the uppermost mantle.
Con-sequently, a reference model for the 3-D inversion similar to iasp91 has been chosen, but with a crustal thickness modified to 30 km and lower S velocities in the uppermost 200 km. As demonstrated in Marone et al. (2003), however, the obtained solution is stable and is independent of the adopted starting model. The S velocity is parametrized as coefficients of a Cartesian grid of nodes, while for the Moho depth a triangular grid of nodes is adopted on a spherical shell at the Moho depth of the background model (Van der Lee & Nolet 1997). The distance between the nodes of the triangular grid is compatible with the interknot spacing in the Cartesian grid and is 97 km on average. Since the inversion problem is mixed, it has been solved using a damped least-squares inversion method. The value of the damping parameter (λ = 1) has been chosen to balance variance reduction and the model norm. Moreover, given the characteristics of the surface waves, it has been required that the solution should be smooth. Since the distance between the grid nodes in the vertical direction is 60 km, the resolution for the crustal velocity structure is limited. Therefore, the S-velocity model obtained for the upper-most part of the model represents only an average for the crustal and sub-Moho velocities and will not be interpreted. It has been in-verted for it to absorb the effects of crustal velocity structure on the waveform data. The effects of Moho depth on waveforms are much larger than those of distributed velocities within and immediately below the crust. For more details on the 3-D inversion see Marone
et al. (2003).
A different weight is assigned to each independent point con-straint according to its estimated uncertainty (see Section 2.1). The point constraints resulting from refraction and/or reflection profiling and some of the receiver function analyses are more strongly weighted since their estimated error is smaller than that of other crustal thickness estimates. To choose the relative weights of the point constraints and the Rayleigh wave fits, we opted for a balance between a smoothed Moho topography and an exact match between point constraints and the resulting crustal thickness values. For the chosen model, most point constraints are met by the Moho
0 20 40 60 Number of points -10 0 10 (a) 0 20 40 60 -10 0 10 (b) 0 2 4 6 8 10 -10 0 10 (c) 0 2 4 6 8 10 Number of points -10 0 10 Misfit (km) (d) 0 10 20 -10 0 10 Misfit (km) (e) 0 20 40 60 80 -10 0 10 Misfit (km) (f)
Figure 4. Distribution of the deviation of the previous crustal thickness observations from the values observed in EAM02 (Fig. 5). The 95 per cent confidence
interval is represented by the two vertical lines. (a) Data set of Mooney et al. (2002), (b) refraction and reflection profiles, (c) receiver function study of Van der Meijde et al. (2003), (d) other receiver function studies, (e) gravity studies and (f) a priori constraints on the crustal thickness in the Atlantic Ocean).
map within their double standard deviation (Fig. 4), while the Moho topography remains smooth. The discrepancies falling outside the double standard deviation interval are related to point measurements in regions where a strong gradient in the Moho topography can be expected (e.g. Calabrian and Hellenic arcs). The obtained Moho depth model has been forced to be smooth. If the weight of the point constraints is increased and they are forced to be matched within their single standard deviation, the obtained model shows strong gradients and small anomalies.
Fig. 4(f) shows how the values observed in EAM02 (Fig. 5) de-viate from the artificially imposed point constraints in the Atlantic Ocean (see Section 2.1). The distribution of the differences is shifted towards negative values and the maximum is observed at−5 km. This indicates that the surface waves travelling through the eastern Atlantic region require on average a 5 km thicker crust than the imposed standard oceanic crust of 6 km.
4 U N C E RT A I N T I E S E S T I M AT I O N
Uncertainties in the obtained Moho depth values arise from dif-ferent sources. First, the resolving power of a seismogram for the average Earth structure along its path is controlled by the Fresnel zone. If natural trade-offs between model parameters (e.g. the crustal velocity and the Moho depth) are not reduced by introducing addi-tional constraints, the obtained velocity and crustal structure along every single path as well as the final 3-D image can be blurred. Errors in the source parameters and excitation factors, as well as in modelling assumptions (neglection of scattering, multipathing and mode-coupling) and in the approximations made in the non-linear waveform fitting method also limit the resolving power of the data. Das & Nolet (1995) showed that for synthetic and real data with a very good signal-to-noise ratio, the Moho can be resolved within a kilometre, if frequencies as high as 0.125 Hz are fitted. As a result of the complexity of the Mediterranean region and limited
signal-to-noise ratio (mainly waveforms of moderate earthquakes have been used), in this study it was hardly possible to fit frequen-cies higher than 0.08 Hz. The expected uncertainty related to the average crustal thickness along each path is therefore higher than the ideal case shown in Das & Nolet (1995).
In the joint 3-D inversion of linear constraints provided by the waveform fitting and additional point constraints, further uncertain-ties are involved: errors in previous estimates of the crustal thickness and the variable resolving power of surface waves due to inhomo-geneous great circle ray path coverage and the different sensitivity of the modes to different parts of the crust and upper mantle. In ad-dition, the smoothness constraint is also responsible for averaging the Moho topography towards a mean value, which leads to under-estimating the small-scale Moho topography perturbations. Owing to different error sources and the barely quantifiable propagation of uncertainties in the inversion, a formal error estimate is impossible for the Moho depth values obtained here. Nevertheless, assessing the anomaly size and amplitude that can be recovered in the 3-D inversion as well as the spatially variable resolving power of the data is important for interpreting and using EAM02. For this reason resolution tests with synthetic anomalies have been performed.
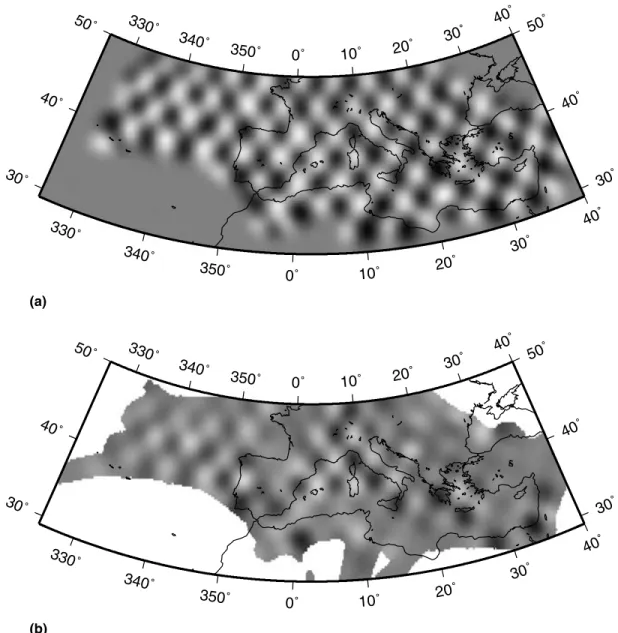
In Figs 6 and 7 two examples are shown: one with large anomalies (5◦) and one with small ones (3◦). As expected, large features are better resolved than small ones. The shape of Moho topography perturbations with an average size of 500 km are well resolved throughout the studied region. The anomaly amplitude is almost completely recovered in central-southern Europe, the central-western Mediterranean Sea and the Atlantic Ocean. In the remaining areas it is partly underestimated (Fig. 6). For features as small as∼300 km, the best resolving power is achieved for central-western Europe and the Mediterranean Basin: the region with the best path coverage and most point estimates of crustal thickness.we In these regions we recovered 83 per cent of the amplitude of the Moho perturbation, for other areas the anomaly amplitudes
330
˚
330
˚
340
˚
340
˚
350
˚
350
˚
0
˚
0
˚
10
˚
10
˚
20
˚
20
˚
30
˚
30
˚
40
˚
40
˚
30
˚
30
˚
40
˚
40
˚
50
˚
50
˚
20 20 30 30 30 30 3 0 30 40 40 40 400
5
10
15
20
25
30
35
40
45
50
km
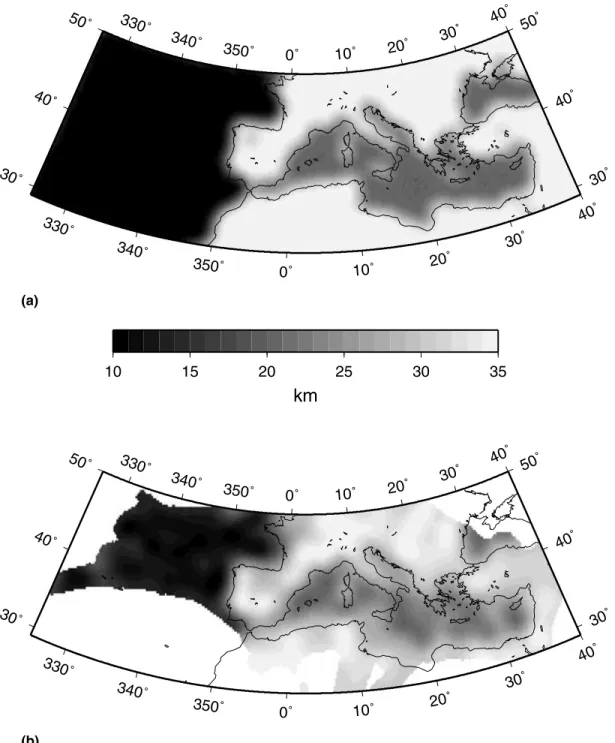
Figur e 5. Map of Moho depth (EAM02) obtained in the 3-D in v ersion.330
˚
330
˚
340˚
340˚
350˚
350˚
0˚
0˚
10˚
10˚
20˚
20˚
30˚
30˚
40˚
40˚
30˚
30˚
40˚
40˚
50˚
50˚
(a)330
˚
330
˚
340˚
340˚
350˚
350˚
0˚
0˚
10˚
10˚
20˚
20˚
30˚
30˚
40˚
40˚
30˚
30˚
40˚
40˚
50˚
50˚
(b)Figure 6. Chequerboard resolution test with 5◦anomaly size: (a) input model, (b) retrieved structure.
are underestimated. Although the surface wave path coverage is op-timal in eastern Europe, small-scale features of the synthetic input model are not well recovered (Fig. 7) owing to few point measure-ments of the Moho depth and insufficient high-frequency funda-mental mode surface waves generated by Romania’s intermediate to deep earthquakes.
To gain an idea of the resolving power for gross-scale features, we performed an additional resolution test with a realistic input structure: 10, 20 and 35 km Moho depth beneath the Atlantic Ocean, the Mediterranean Sea and Europe, respectively (Fig. 8). For regions with good path coverage and enough point constraints, the resolution is very good and the amplitude anomaly completely recovered (e.g. in the western Mediterranean). If the number of point constraints for the crustal thickness is limited, we observed an underestimation of the Moho topography perturbations by up to 4 km for regions constrained only by surface wave data.
Since a trade-off between crustal velocity and thickness exists, in-sufficient control of the crustal S-velocity structure could be wrongly mapped into the Moho topography. An inversion attempt, with ad-ditional independent constraints on upper crustal S velocities
ac-cording to the sediment information from Laske & Masters (1997), shows that in regions with an anomalously low average crustal ve-locity due to thick sedimentary deposits (up to 15 km), the crustal thickness can be overestimated by up to 8 km. In areas with a stan-dard upper crust, variations in the Moho depth related to whether or not sediments are included fall within the uncertainties. There-fore, and because of incomplete and imprecise sediment thickness and velocity information, we decided not to correct for this effect. No constraints on crustal velocity have been included in the joint 3-D inversion. However, overestimating the crustal thickness due to particularly thick sedimentary layers in the Mediterranean region is expected only in limited areas (eastern Mediterranean and Adriatic Sea). For the remaining region the sedimentary coverage is not thick enough to bias the results significantly.
5 R E S U L T S A N D D I S C U S S I O N
The obtained Moho map for the Eurasia–Africa plate boundary re-gion (EAM02) is shown in Fig. 5. The depth to the Moho in the area varies from less than 15 km beneath the Atlantic Ocean and in the
330
˚
330
˚
340˚
340˚
350˚
350˚
0˚
0˚
10˚
10˚
20˚
20˚
30˚
30˚
40˚
40˚
30˚
30˚
40˚
40˚
50˚
50˚
(a)330
˚
330
˚
340˚
340˚
350˚
350˚
0˚
0˚
10˚
10˚
20˚
20˚
30˚
30˚
40˚
40˚
30˚
30˚
40˚
40˚
50˚
50˚
(b)Figure 7. Chequerboard resolution test with 3◦anomaly size: (a) input model, (b) retrieved structure.
Algero-Proven¸cal Basin to over 43 km beneath the Alps. The spa-tially averaged value for the crust–mantle boundary depth is 28 km. Compared with the existing Moho map for the region by Meissner
et al. (1987), we extended the results to the southern Mediterranean
Basin, northern Africa and the Atlantic Ocean.
5.1 Mediterranean Sea
The Mediterranean Sea shows a strongly heterogeneous char-acter. In the western part, beneath the Ligurian Sea and the Algero-Proven¸cal Basin, a shallow Moho (<20 km) has been im-aged. The observed thin and on average fast crust, together with the low S velocities observed in the uppermost mantle (Marone et al. 2003) and the high heat flow measured (Burrus & Foucher 1986), all support the idea of oceanic crust present among the predomi-nantly extended continental crust, at least in limited locations (e.g. offshore Provence). The imaged thin crust of the region could be the result of extensional processes at the back of the retreating NW-dipping subducting oceanic lithospheric slab between∼30–22 Ma (Faccenna et al. 2001). Oceanic crust could have been emplaced
during the simultaneous 25◦–30◦counter-clockwise drifting of the Sardinia–Corsica block (Burrus 1984).
The westernmost part of the Mediterranean Basin or Alboran Sea, squeezed in between the Betics in the north, the Rif in the east and the Atlas Mountain Range in the south, has been locally af-fected by extensional processes since the Early Miocene (e.g. Platt & Vissers 1989; Seber et al. 1996), even though the deformation of the overall region is dominated by the converging and colliding African and Eurasian continents. While the Moho discontinuity be-neath the mountain belts in southern Spain and northern Africa is found at a depth of 35 to over 40 km, the Alboran Sea has a much shallower Moho at 25 km. According to resolution tests (Fig. 7), a feature as small as the Alboran Sea can be resolved by our data set. However, the Moho depths obtained for this region are possibly damped towards a mean value: in reality the crust–mantle boundary is deeper beneath the arcuate mountain belt and shallower in the centre beneath the Alboran Sea than shown in Fig. 5.
The central Mediterranean Basin can be divided into two regions following the bathymetry (Fig. 1), the Moho topography (Fig. 5) and the uppermost mantle S-velocity structure (Marone et al. 2003).
330
˚
330
˚
340˚
340˚
350˚
350˚
0˚
0˚
10˚
10˚
20˚
20˚
30˚
30˚
40˚
40˚
30˚
30˚
40˚
40˚
50˚
50˚
10
15
20
25
30
35
km
(a)330
˚
330
˚
340˚
340˚
350˚
350˚
0˚
0˚
10˚
10˚
20˚
20˚
30˚
30˚
40˚
40˚
30˚
30˚
40˚
40˚
50˚
50˚
(b)Figure 8. Resolution test with realistic input structure (10, 20 and 35 km Moho depth beneath the Atlantic Ocean, the Mediterranean Sea and Europe,
respectively): (a) input model, (b) retrieved structure.
North of the Malta escarpment, where the deep basins are, a shallow Moho is observed. Beneath the Ionian Basin the crust–mantle dis-continuity is shallower than 20 km, while eastward (below the Sirte Basin) it is found at 23 km. These results support the interpreta-tion of the deep central Mediterranean basins as relicts of Mesozoic oceanic crust covered by 6–8 km thick sedimentary layers (De Voogd
et al. 1992). To the south, offshore Libya, the Moho is present at
30 km depth. This suggests that the region could be an extension of the northern African margin beneath the Mediterranean Sea, an idea supported by its shallow bathymetry. Such a division of the central Mediterranean Sea into two parts is also observed in the upper-mantle structure, with a fast northern part, possibly
repre-senting oceanic lithosphere, while average velocities are present to the south (Marone et al. 2003).
The eastern Mediterranean shows the Moho at a depth of 30 km on average. A shallowing of the crust–mantle boundary (23 km) has been mapped beneath the Levantine Sea, while a deepening (>35 km) is observed at the Nile’s mouth, where sediments trans-ported by the river have accumulated. Reflection and refraction seismic profiling, gravimetric and magnetic studies have been per-formed in the region. However, the origin of this part of the Mediter-ranean Sea as well as the nature of its crust are still debated. For the easternmost Mediterranean Basin (Levantine Sea) particularly, two end-member hypotheses exist. The first one suggests that the crust,
of oceanic nature, formed during Mezosoic periods of rifting (e.g. Makris et al. 1983; Dercourt et al. 1986; Ben-Avraham et al. 2002). The second hypothesis postulates that a Precambrian continental basement with terranes of accreted Precambrian oceanic crust un-derlies the entire eastern Mediterranean (Hirsch et al. 1994). The original continental crust could have thinned through a change of its physical properties due to the accumulation of up to a 14 km thick pile of mainly Triassic and Jurassic sedimentary rocks as mapped in the region (Makris et al. 1983; Hirsch et al. 1994; Knipper & Sharaskin 1994). In spite of differences in the mechanism of crust formation and of the nature of the crust (continental or oceanic), both theories agree on the presence of thin crust covered by a thick sedimentary layer. Even if resolution in this part of the studied re-gion is limited by inhomogeneous data coverage, our results support the existence of thin crust, especially in the Levantine Basin, where a shallower Moho is observed compared with surrounding regions. Moreover, during the waveform fitting of the single seismograms in the first part of the PWI, the linear constraints obtained for this region indicate anomalously low velocities in the crust, consistent with a thick sedimentary layer.
5.2 Eastern Atlantic Ocean
The eastern Atlantic Ocean, the region between the Mid-Atlantic Ridge and western Europe, is characterized by a relatively homoge-neous structure, with the Moho at a depth of 15 km (with an average 4–4.5 km water layer, a crustal thickness of 10.5–11 km). Our results show a crust at least 4 km thicker than values obtained from seismic refraction and reflection profiles (Fowler & Keen 1979; Whitmarsh
et al. 1982; Ginzburg et al. 1985), and a difference of about 2.5 km
compared with results from rare element inversions of melt distri-bution in the mantle source region (White et al. 1992). The Moho is deepening to 27 km underneath the Azores archipelago. The origin of the thicker crust here could be an increased melt production due to the interaction of the spreading ridge and a possible mantle plume (White et al. 1992).
As can be seen in Fig. 1, the seafloor of the eastern Atlantic Ocean shows a perturbed relief. These heterogeneities could have formed at the Mid-Atlantic Ridge after magmatic and amagmatic periods, which alternate over a short temporal scale (∼100 ka) and are char-acteristic of low spreading ridges (Rommevaux et al. 1994; Canales
et al. 2000). Canales et al. (2000) also pointed out the extremely
vari-able thickness of the crust formed at such slow-spreading ridges: they measured≥2.2 km thickness variations over horizontal dis-tances of∼5 km. During periods of high magma supply, a crust thicker than standard oceanic crust could have been created. The study of rocks dredged along slowly spreading ocean ridges sug-gests lateral variability of the structure of the oceanic crust along the ridge, as a consequence of a non-uniform flow of melt out of the mantle and punctual ocean ridge magmatism (Dick 1989). Complex crustal thickness variability also results from 3-D numerical models of convection within the partially molten mantle beneath the ridge axis (Rabinowicz & Briais 2002). Moreover, underplated bodies and fragments of subcontinental lithospheric mantle residing shallowly in the oceanic mantle have been imaged with wide-angle seismic reflection techniques (Jacob et al. 1995) and postulated from the
187Os/188Os ratio measured in basalts (Shirey et al. 1987; Widom
& Shirey 1996). Together with such fragments, crustal pieces could also have detached from continental edges during the opening of the North Atlantic Basin and now lie within younger oceanic crust. Along with a mantle plume, these fragments of continental crust can explain the thicker crust observed in the Azores archipelago.
The serpentinization of the sub-Moho mantle at the Mid-Atlantic ridge could also contribute to the imaging of the anomalously thick oceanic crust in our model for the eastern Atlantic Ocean. It is likely that open fissures characteristic of slowly spreading ridges and non-constructive areas of ridge axes provide a path for seawater circu-lation, which easily penetrates the upper mantle lying at shallow levels (H´ebert et al. 1990; Blackman et al. 1998). Serpentinization of mantle rocks strongly decreases their density from 3.2 g cm−3 for mantle rocks to a density of 2.5 g cm−3for pure serpentine (e.g. Miller & Christensen 1995; Blackman et al. 1998; Fr¨uh-Green et al. 2001), as well as their S velocity. In fact, the shear wave velocity of serpentinized mantle rocks is close to crustal S velocities. Thus, rock serpentization in the uppermost mantle could create a low S-velocity layer just beneath the Moho, reducing the S-velocity contrast at the crust–mantle discontinuity and creating a stronger velocity gradient between the serpentinized sub-Moho mantle and the un-altered lithospheric mantle. Possibly this velocity discontinuity has been imaged and interpreted as the Moho, thus causing us to over-estimate the oceanic crustal thickness. Modelling single waveforms of S and surface waves travelling through the eastern Atlantic Ocean supports this interpretation. In fact, if a Moho at 10 km depth is cho-sen a priori, the surface waves require a 10–15 km thick sub-Moho layer characterized by S velocities as low as 4.15 km s−1. Moreover, a 1-D path-averaged velocity model characterized by a 5 km thick sub-Moho layer with extremely low S velocities (∼ 3.3 km s−1) is also
consistent with the observed waveforms. S velocities as low as 3.3 km s−1would suggest a degree of serpentinization as high as 50 per cent (Christensen 1966). Serpentinized uppermost oceanic mantle seems to be required in subduction zones, where dehydration could provide enough energy for unbending the slab (Seno & Yamanaka 1996; Peacock 2001). Dehydration embrittlement could be the cause of intermediate depth earthquakes occurring at mid-plate depths in the subducting slab. However, where serpentinization is taking place is still a matter of debate: Peacock (2001) suggests that serpentiniza-tion may occur in the trench–outer rise region, where faulting may promote infiltration of seawater several tens of kilometres into the oceanic lithosphere. In contrast Seno & Yamanaka (1996) propose that the hydration of the uppermost oceanic mantle could occur when the oceanic plate passes over plumes or superplumes. Here we show evidence that in the eastern Atlantic Ocean the sub-Moho mantle could be partially serpentinized so that hydration could partly occur at the Mid-Atlantic ridge.
Synthetic resolution tests preclude that the wave path coverage has contaminated the imaged structure of the Atlantic region with continental characteristics (Fig. 2).
5.3 Northern Africa
After installation of broad-band seismic stations along the north-ern African coast during the MIDSEA project (Van der Lee et al. 2001), it was possible to increase data availability significantly and consequently resolution, especially for the northernmost margin of Africa discussed here. However, the structure south of the margin is biased by smearing along the main path direction.
EAM02 shows on average the Moho discontinuity at 30 km depth beneath regions such as northern Egypt and northern Libya, which have not experienced important tectonic episodes since the Pale-ocene (a rifting phase in the Sirte Basin). A thickening of the crust is observed at the Nile delta, where thick sediments are present (Tawadros 2001). However, the western part of the African conti-nent is characterized by a rapid change from a relatively deep Moho (down to 42 km) below the Atlas Mountain Range to the thin crust of
the southwestern Mediterranean Sea (<20 km). These features are a consequence of past tectonic movements, such as subduction along northern Algeria (Dercourt et al. 1986). The tectonic activity of this area, still nowadays, is documented by seismicity (e.g. Buforn et al. 1995).
5.4 European continent
The main features observed for continental Europe (Fig. 5) are cor-related with surface topography (Fig. 1). In fact, EAM02 shows crustal roots beneath mountain belts such as the Alps, the Dinar-ides, the HellenDinar-ides, the Pyrenees and the Carpathians, where the Moho discontinuity is deeper than 40 km. A deep crust–mantle boundary (>35 km) is also found beneath Turkey. A shallow Moho (<30 km) is observed in relation with extensional settings beneath the Pannonian Basin, the Black Sea and along the Central European Rift. A similar feature is present beneath Bulgaria. We compared our results for Europe with Meissner’s (1987) map for the Moho depth, which he obtained by compiling several deep seismic and extensive reflection/refraction profiles. We observe strong similarities in the long-wavelength character.
Comparing well are the results for Italy, where a complex structure can be expected because of the interacting crust of the Adria micro-continent and the European Plate. Beneath Italy and the Corsica– Sardinia block the Moho discontinuity is found on average at 30 km depth. We also confirm that the crust of the Adria microplate is con-tinental with the Moho at a depth of 30–35 km, as found by Meissner
et al. (1987) and Morelli (1998). The seas west of Italy show a
shal-lower Moho than inferred by Meissner et al. (1987). In the Ligurian Sea the crust–mantle boundary is found at 20 km depth. This value agrees with the minimum Moho depth of 16 km for this region proposed by Morelli (1998). Probably the higher values found by Meissner et al. (1987) arise from interpolation due to lack of data. For the Tyrrhenian Sea as well, a thin and stretched crust has been found by several authors such as Calcagnile & Scarpa (1985) from regional dispersion of seismic surface waves and Locardi & Nicol-ich (1988) from deep seismic profiles and petrological studies. In EAM02 (Fig. 5) we also observe a shallow crust–mantle boundary beneath the Tyrrhenian Sea, confirming a stretched crust. However, the results in this area are constrained mainly by estimates of crustal thickness obtained in refraction and reflection profiles. The surface waves would prefer a thicker crust, probably because the recorded signals of deep earthquakes occurring beneath the Calabrian arc contain no fundamental-mode frequencies high enough to constrain the crustal thickness significantly. As a result, the value of the Moho depth stays close to the 30 km of the background model. The shal-low Moho discontinuity found beneath the Tyrrhenian Sea has been set in relation with the extensional backarc basin tectonics charac-terizing this area (e.g. Faccenna et al. 2001).
In eastern Europe more differences emerge compared with the Moho map by Meissner et al. (1987). First of all, beneath the Carpathian arc we find a deepening of the Moho to a maximum of 40 km along a NW–SE-striking feature. The NW–SE-trending structure with thickened crust that Meissner et al. (1987) found was narrower than what we observe. This difference is due to the smoothing effect of the surface waves. Our results agree with val-ues obtained from refraction seismic profiles (Hauser et al. 2001), showing an increased crustal thickness under the Carpathians. To the south, in Bulgaria, EAM02 (Fig. 5) shows the Moho at a depth of 25–27 km. The crust of this area is poorly known and only a few studies have been carried out in the region. Several authors (Dachev & Volvovsky 1985; Babu˘ska & Plomerov´a 1987; Shanov
et al. 1992) suggest a quite complex crustal structure, with a deep
Moho in the south, possibly related to a paleosubduction (Shanov
et al. 1992) and crustal thinning in the northern-central part related
to graben formation and a shallow asthenosphere. The zone of thin crust we imaged in Bulgaria is more elongated in the N–S direction compared with the studies mentioned above. The thickened crust in the southern part proposed by the authors above is possibly a small size perturbation which cannot be efficiently detected by the surface waves. However, since enough seismic waves travel across this area, we believe that this region is characterized on average by a thin crust.
Greece is characterized by complex tectonics, with compressional processes in the outer zone and extension in the backarc basin area (Dercourt et al. 1986) as reflected in its crustal structure (Fig. 5). In fact, we find the Moho to be deeper than 40 km beneath the Greek mainland and the Peloponnesus. The crust–mantle boundary beneath Crete is observed on average at 30 km. Moving from the col-lision zone to the backarc basin (southern Aegean Sea), we observe a shallowing of the Moho to a minimum of 20 km. In the northern Aegean Sea the average Moho depth is 30 km. Our results agree with the Moho map of Makris (1985) obtained by interpolating re-fraction and reflection seismic data with information from gravity data. The zone of thin crust we image in the southern Aegean Sea is more elongated in an E–W direction, reaching the coasts of Turkey. In Makris’ (1985) map this feature is limited to the region north of Crete, but his results on the eastern Aegean Sea are constrained by gravity data only. Similar features are also found in a smaller-scale study presented by Karagianni et al. (2002).
6 I S O S T AT I C C O M P E N S AT I O N
To assess Airy isostatic compensation in the Mediterranean region, the obtained Moho depth model (Fig. 5) has been compared with a Moho depth model computed assuming isostatic equilibrium. For this purpose, a synthetic crustal model has been constructed. In particular, detailed information concerning sedimentary deposits as well as appropriate upper, middle and lower crustal densities at each single node on a grid have been included according to the compilation of Laske & Masters (1997) and Bassin et al. (2000). The thickness of the sedimentary package and the ratio between the three crustal layers have been fixed at the values proposed by Laske & Masters (1997) and Bassin et al. (2000). The thicknesses of the single crustal units have been scaled according to the total crustal thickness in isostatic equilibrium. To obtain in the isostatic com-pensated model Moho depth variations of the same wavelength as observed (Fig. 5), the topography of the ETOPO5 data set (National Geophysical Data Center, 1988) has been smoothed.
In a first step, the Moho depth has been computed considering isostatic compensation only for the crust and assuming a constant density for the uppermost mantle (ρmantle= 3.33 g cm−3) (Fig. 9a).
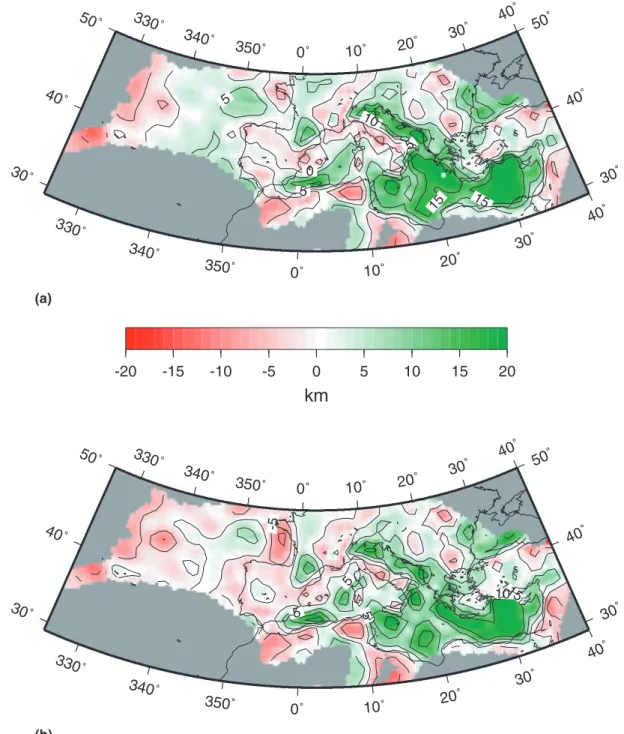
The continental regions are characterized by residuals smaller than 5 km: the difference between EAM02 (Fig. 5) and the Moho to-pography for an isostatically compensated crust is less than 5 km. Considering the uncertainties in estimating the Moho depth (see Section 4) and in the assumed densities, we conclude that the crust for the studied continental region is close to an isostatic equilibrium. The Mediterranean Basin is showing strong positive residuals com-pared with the continental regions, suggesting that either sub-Moho lithospheric densities are higher and/or crustal thickness has been overestimated. The Atlantic Ocean is also characterized mainly by positive residuals, possibly indicating that we underestimated the uppermost mantle density for an oceanic region.
330
˚
330
˚
340˚
340˚
350˚
350˚
0˚
0˚
10˚
10˚
20˚
20˚
30˚
30˚
40˚
40˚
30˚
30˚
40˚
40˚
50˚
50˚
0 5 5 5 10 15 15-20
-15
-10
-5
0
5
10
15
20
km
(a)330
˚
330
˚
340˚
340˚
350˚
350˚
0˚
0˚
10˚
10˚
20˚
20˚
30˚
30˚
40˚
40˚
30˚
30˚
40˚
40˚
50˚
50˚
-5 5 5 5 1015 (b)Figure 9. Moho depth residuals computed by subtracting the Moho depth calculated assuming isostatic equilibrium from the obtained Moho depth: (a)
assuming isostatic compensation only for the crust and a constant density for the uppermost mantle, (b) assuming a compensation depth of 60 km and using uppermost mantle densities derived from the S-velocity model of Marone et al. (2003).
In a second step, to include the effect of the lithosphere, we chose a compensation depth at 60 km and computed uppermost mantle densities, converting the S velocities obtained in Marone
et al. (2003) according to a velocity–density–depth relationship
provided by Cammarano et al. (2002). Also in this case, the ob-served residuals (Fig. 9b) for the continental region are smaller than 5 km almost everywhere, confirming isostatic equilibrium. In the Atlantic Ocean the observed and computed Moho topography differs less than in the previous case, which included only the crust. This confirms the necessity of considering the lithosphere with an appropriate oceanic density in isostatic computation. Considering that owing to a mainly E–W paths direction in the eastern Atlantic
Ocean (Fig. 2), the obtained Moho topography has been averaged out and that the age dependence of the oceanic lithospheric density has not been considered, we conclude that isostatic compensation reigns at 60 km depth beneath this region. Beneath the Bay of Bis-cay negative residuals are found. This anomaly, not present in Fig. 9(a), correlates with an anomalous high S-velocity body in the up-permost mantle (Marone et al. 2003). The over 5 km difference between the observed and computed Moho depths could possibly arise from overestimating the uppermost mantle densities. In fact, granulites representing at least partly, an Archaean crust with gran-ulite facies metamorphism have been found in the Bay of Biscay (Guerrot et al. 1989). The Archaean age of the Bay of Biscay rocks
compares to that of the west African craton, suggesting that the west European Plate belonged to west Africa during the Late Proterozoic (Guerrot et al. 1989). Although cratonic material shows high S ve-locities, it is characterized by lower densities than expected due to depletion and leads here to overestimating of the lithospheric density because of the constant velocity–density–depth relationship used. Decreased residual values with the inclusion of the lithosphere are also observed for the central Mediterranean (between southern Italy and Libya), while residuals over 5 km are still present in the eastern Mediterranean. In this latter region isostatic compensation would require higher densities in the uppermost mantle. Therefore, accord-ing to the velocity–density–depth relationship of Cammarano et al. (2002), we expect higher S velocities, which are, however, absent in Marone et al. (2003). Such large discrepancies between observed and computed Moho depths could arise from overestimating the crustal thickness in this region. In fact, the highest residuals corre-late with the area having thickest crust offshore of the Nile mouth. As pointed out in Section 4, synthetic tests show that a trade-off exists between crustal velocity and thickness. Overestimating the crustal velocity is responsible for overestimating the Moho depth. This effect is particularly important in the eastern Mediterranean Basin, where more than 10 km thick sediment deposits are present and the crustal thickness could have been overestimated by up to 8 km.
7 C O N C L U S I O N S
We are first to map the Moho depth (EAM02) covering the whole Mediterranean region, also with reliable results for the southern and eastern Mediterranean Basin and the northern African coasts, regions only occasionally considered in previous studies of the Mediterranean Basin. Information contained in surface waves has been used to interpolate between existing point estimates of the crustal thickness.
The heterogeneous crust of the Mediterranean Sea confirms the complex evolution of this plate boundary region. In the west, the Moho discontinuity has been observed to be as shallow as 15–20 km. This extensively stretched and partly oceanic crust may have formed from extension in the backarc of the retreating Calabrian slab. In contrast, the eastern Mediterranean region is characterized by 25– 30 km thick crust on average. It is interpreted either as Mesozoic oceanic or thinned Precambrian continental crust covered by a thick pile of Mesozoic sedimentary rocks.
Below the eastern North Atlantic Ocean our results show a crust up to 5 km thicker than the standard oceanic crust. From its highly perturbed relief, we interpreted the crust here to be heterogeneous, as a consequence of periods with different magma supply charac-teristic of slow-spreading ridges. An additional effect contributing to the imaging of an apparently anomalous thickness could be the serpentinization of the sub-Moho mantle.
In Europe the presence of crustal roots beneath the major moun-tain belts has been confirmed, while thinned crust has been found below extensional basins.
Comparing the Moho topography obtained with the Moho depth computed assuming isostatic compensation at 60 km depth shows that most of the Mediterranean and eastern Atlantic region appears in isostatic equilibrium. In the eastern Mediterranean Basin strong positive residuals are likely to be due to overestimating the crustal thickness, owing to an extremely low average S velocity in the upper crust. The lithospheric low density required for isostatic compensa-tion in the Bay of Biscay region, contrasting with observed high S
velocities in the top 50 km of the mantle, confirms the presence of Archaean cratonic material.
A C K N O W L E D G M E N T S
We are grateful to J. Ansorge for sharing his knowledge concerning previous studies on crustal thickness. We thank W. Mooney for pro-viding his Moho depth compilation and for constructive comments on the manuscript. Funding for this study was provided by the Swiss National Science Foundation (SNF). Financial support for MIDSEA came from the SNF, with additional support from the Carnegie In-stitution of Washington, the French National Scientific Research Center and the University of Nice at Sophia-Antipolis, the Italian National Institute of Geophysics and Volcanology and numerous lo-cal organizations (see Van der Lee et al. 2001). We thank the many individuals associated with MIDSEA (see Van der Lee et al. 2001); their support has been invaluable. Contribution number 1279 of the Institute of Geophysics, ETH Zurich.
R E F E R E N C E S
Babuka, V. & Plomerov´a, J., 1987. Deep structure of the lithosphere beneath the territory of Bulgaria, Studia geoph. geod., 31, 266–283.
Banda, E., Da˜nobeitia, J., Surinach, E. & Ansorge, J., 1981a. Features of crustal structure under the Canary Islands, Earth planet. Sci. Lett., 55, 11–24.
Banda, E., Surinach, E., Aparicio, A., Sierra, J. & Ruiz de la Parte, E., 1981b. Crust and upper mantle structure of the central Iberian Meseta (Spain), Geophys. J. R. astr. Soc., 67, 779–189.
Bassin, C., Laske, G. & Masters, G., 2000. The current limits of resolution for surface wave tomography in North America, in EOS, Trans. Am. geophys. Un., 81, F897, Fall Meet. Suppl.
Ben-Avraham, Z., Ginzburg, A., Makris, J. & Eppelbaum, L., 2002. Crustal structure of the Levant Basin, eastern Mediterranean, Tectonophysics, 346, 23–43.
Blackman, D., Cann, J., Janssen, B. & Smith, D., 1998. Origin of extensional core complexes: evidence from the Mid-Atlantic Ridge at Atlantis Fracture Zone, J. geophys. Res., 103, 21 315–21 333.
Bohnhoff, M., Makris, J., Papanikolaou, D. & Stavrakakis, G., 2001. Crustal investigation of the Hellenic subduction zone using wide aperture seismic data, Tectonophysics, 343, 239–262.
Braunmiller, J., Kradolfer, U., Baer, M. & Giardini, D., 2002. Regional moment tensor determination in the European–Mediterranean region— initial results, Tectonophysics, 356, 5–22.
Buforn, E., Sanz de Galdeano, C. & Ud´ıas, A., 1995. Seismotectonics of the Ibero-Maghrebian region, Tectonophysics, 248, 247–261.
Burrus, J., 1984. Contribution to a geodynamic synthesis of the Proven¸cal Basin (northwestern Mediterranean), Mar. Geol., 55, 247– 269.
Burrus, J. & Foucher, J., 1986. Contribution to the thermal regime of the Proven¸cal Basin based on FLUMED heat flow surveys and previous in-vestigations, Tectonophysics, 128, 303–334.
Calcagnile, G. & Panza, G., 1990. Crustal and upper mantle structure of the Mediterranean area derived from surface-wave data, Phys. Earth planet. Inter., 60, 163–168.
Calcagnile, G. & Scarpa, R., 1985. Deep structure of the European– Mediterranean area from seismological data, Tectonophysics, 118, 93– 111.
Cammarano, F., Goes, S., Vacher, P. & Giardini, D., 2002. Inferring upper mantle temperatures from seismic velocities, Phys. Earth planet. Inter., submitted.
Canales, J., Collins, J., Escart´ın, J. & Detrick, R., 2000. Seismic structure across the rift valley of the Mid-Atlantic Ridge at 23◦20(MARK area): implications for crustal accretion processes at slow spreading ridges, J. geophys. Res., 105, 28 411–28 425.
Christensen, N., 1966. Elasticity of ultrabasic rocks, J. geophys. Res., 71, 5921–5931.
Dachev, K. & Volvovsky, I., 1985. Deep structure of Bulgaria along the Petrich–Nikopol EMCM–DSS traverse, Boll. Geofis. Teor. Applic., 27, 263–278.
Das, T. & Nolet, G., 1995. Crustal thickness estimation using high-frequency Rayleigh-waves, Geophys. Res. Lett., 22, 539–542.
De Jonge, M., Wortel, M. & Spakman, W., 1994. Regional scale tectonic evolution and the seismic velocity structure of the lithosphere and upper mantle: the Mediterranean region, J. geophys. Res., 99, 12 091–12 108. De Voogd, B., Truffert, C., Chamot-Rooke, N., Huchon, P., Lallemant, S. &
Le Pichon, X., 1992. Two-ship deep seismic soundings in the basins of the Eastern Mediterranean Sea (Pasiphae cruise), Geophys. J. Int., 109, 536–552.
Dercourt, J. et al., 1986. Geological evolution of the Tethys Belt from the Atlantic to the Pamirs since the Lias, Tectonophysics, 123, 241–315. Dewey, J., Helman, M., Turco, E., Hutton, D. & Knott, S., 1989.
Kinemat-ics of the western Mediterranean, in Alpine TectonKinemat-ics, pp. 265–283, eds Coward, M., Dietrich, D. & Park, R., Blackwell, London.
Dick, H., 1989. Abyssal peridotites, very slow spreading ridges and ocean ridge magmatism, in Magmatism in the Ocean Basins, pp. 71–105, eds Saunders, A. & Norry, M., Blackwell, London.
Doser, D., Keler, G., Harder, S., Miller, K. & Dial, P., 1997. Development of a lithospheric model and geophysical database for North Africa, Final Report PL-T-97-2136, Department of energy, Office of non-proliferation and National Security Philips Laboratory, Directorate of Geophysics, Uni-versity of Texas/El Paso.
Du, Z., Michelini, A. & Panza, G., 1998. EurID: a regionalized 3-D seismo-logical model of Europe, Phys. Earth planet. Inter., 105, 31–62. Dziewonski, A., Ekstr¨om, G. & Salganik, M., 1994. Centroid-moment tensor
solutions for January–March 1994, Phys. Earth planet. Inter., 86, 253– 261.
Egger, A., 1992. Lithospheric structure along a transect from the northern Apennines to Tunisia derived from seismic refraction data, PhD thesis, ETH Zurich, Zurich, Switzerland.
Engdahl, E., Van der Hilst, R. & Buland, R., 1998. Global teleseismic earth-quake relocation with improved traveltimes and procedures for depth de-termination, Bull. seismol. Soc. Am., 88, 722–743.
Faccenna, C., Funiciello, F., Giardini, D. & Lucente, P., 2001. Episodic backarc extension during restricted mantle convection in the Central Mediterranean, Earth planet. Sci. Lett., 187, 105–116.
Fowler, C. & Keen, C., 1979. Oceanic crustal structure—Mid-Atlantic Ridge at 45◦N, Geophys. J. R. astr. Soc., 56, 219–226.
Fr¨uh-Green, G., Connolly, J., Kelley, D., Plas, A. & Grob´aty, B., 2001. Serpentinization of oceanic peridotites: implications for geochemical cy-cles and biological activity, in The Subseafloor Biosphere at Mid-Ocean Ridges, Special Publication, Am. geophys. Un., submitted.
Geiss, E., 1987. A new compilation of crustal thickness data for the Mediter-ranean area, Ann. Geophys., 5B, 623–630.
Ginzburg, A., Whitmarsh, R., Roberts, D., Montadert, L., Camus, A. & Avedik, F., 1985. The deep seismic structure of the northern continental margin of the Bay of Biscay, Ann. Geophys., 3, 499–510.
Guerrot, C., Peucat, J., Capdevila, R. & Dosso, L., 1989. Archean protoliths within Early Proterozoic granulitic crust of the west European Hercynian belt: possible relics of the west African craton, Geology, 17, 241–244. Hauser, F., Railenau, V., Fielitz, W., Bala, A., Prodehl, C., Polonic, G. &
Schulze, A., 2001. VRANCEA 99—the crustal structure beneath the southeastern Carpathians and the Moesian Platform from a seismic re-fraction profile in Romania, in Starkbeben: vom geowissenschaftlichen Grundlagen zu Ingenieurmassnahmen, pp. 1–4, Universit¨at Kalsruhe. H´ebert, R., Adamson, A. & Komor, S., 1990. Metamorphic petrology of ODP
Leg 109, Hole 670A serpentinized peridotites: serpentinization processes at a slow spreading ridge environment, in Proc. of the Ocean Drilling Program, Scientific Results, pp. 103–115, Vol. 106/109, eds Detrick, R., Honnorez, J., Bryan, W. & Juteau, T.
Hirsch, F., Flexer, A., Rosenfeld, A. & Yellin-Dror, A., 1994. Tectonic setting and crustal structure of the Eastern Mediterranean, in Annual Meeting, p. 40, eds Amit, R., Arkin, Y. & Hirsch, F., Israel Geological Society.
Jacob, A., Shannon, P., Makris, J., Hauser, F., Vogt, U. & O’Reilly, B., 1995. An overview of the results of the RAPIDS seismic project, North Atlantic, in The Petroleum Geology of Ireland’s Offshore Basins, pp. 429–431, eds Croker, P. & Shannon, P., Geological Society, London.
Karagianni, E. et al., 2002. Rayleigh wave group velocity tomography in the Aegean area, Tectonophysics, 358, 187–209.
Kennett, B. & Engdahl, E., 1991. Traveltimes for global earthquake location and phase identification, Geophys. J. Int., 105, 429–465.
Knipper, A. & Sharaskin, A., 1994. Tectonic evolution of the western part of the Peri-Arabian ophiolite arc, in Geological Structure of the North-eastern Mediterranean (Cruise 5 of the Research Vessel ‘Akademik Niko-laj Strakhov’), pp. 295–305, eds Krasheninnikov, V. & Hall, J., Hist. Productions-Hall, Jerusalem.
Laske, G. & Masters, G., 1997. A global digital map of sediment thickness, in EOS, Trans. Am. geophys. Un., 78, F483, Fall Meet. Suppl.
Locardi, E. & Nicolich, R., 1988. Geodinamica del Tirreno e dell’Appennino centro-meridionale: la nuova carta della Moho, Mem. Soc. Geol. Ital., 41, 121–140.
Makris, J., 1985. Geophysics and geodynamic implications for the evolution of the Hellenides, in Geological Evolution of the Mediterranean Basin, pp. 231–248, eds Stanley, D. & Wezel, F., Springer, Berlin.
Makris, J., Ben-Avraham, Z., Behle, A., Ginzburg, A., Giese, P., Steinmetz, L., Whitmarsh, R. & Eleftheriou, S., 1983. Seismic refraction profiles between Cyprus and Israel and their interpretation, Geophys. J. R. astr. Soc., 75, 575–591.
Marone, F., Van der Lee, S. & Giardini, D., 2003. Upper mantle shear-wave velocity structure in the Eurasia–Africa plate boundary region, Geophys. J. Int. submitted.
Meissner, R., Wever, T. & Fl¨uh, E., 1987. The Moho in Europe—implications for crustal development, Ann. Geophys., 5B, 357–364.
Mickus, K. & Jallouli, C., 1999. Crustal structure beneath the Tell and Atlas Mountains (Algeria and Tunisia) through the analysis of gravity data, Tectonophysics, 314, 373–385.
Miller, D. & Christensen, N., 1995. Velocity behaviour of the lower oceanic crust and upper mantle, in EOS, Trans. Am. geophys. Un., 76, Fall Meet. Suppl.
Mooney, W., Laske, G. & Masters, T., 1998. CRUST 5.1: a global crustal model at 5◦× 5◦, J. geophys. Res., 103, 727–747.
Mooney, W., Prodehl, C. & Pavlenkova, N., 2002. Seismic velocity structure of the continental lithosphere from controlled source data, in International Handbook of Earthquake and Engineering Seismology, Vol. 81A, pp. 887– 910, eds Lee, W., Kanamori, H., Jennings, P. & Kisslinger, C., Academic, Amsterdam.
Morelli, C., 1998. Lithospheric structure and geodynamics of the Italian peninsula derived from geophysical data: a review, Mem. Soc. Geol. It.,
52, 113–122.
National Geophysical Data Center, 1988. ETOPO-5, bathymetry/topography data, Data Announc. 88-MGG-02, Natl. Oceanic and Atmos. Admin., US Dept of Commerce, Washington, DC.
Nolet, G., 1990. Partitioned waveform inversion and 2-dimensional structure under the network of autonomously recording seismographs, J. geophys. Res., 95, 8499–8512.
Pasyanos, M. & Walter, W., 2002. Crust and upper mantle structure of North Africa, Europe, and the Middle East from inversion of surface waves, Geophys. J. Int., 149, 464–482.
Peacock, S., 2001. Are the lower planes of double seismic zones caused by serpentine dehydration in subducting oceanic mantle?, Geology, 29, 299–302.
Pinheiro, L., Whitmarsh, R. & Miles, P., 1992. The ocean–continent boundary off the western continental margin of Iberia—II. Crustal structure in the Tagus Abyssal Plain, Geophys. J. Int., 109, 106– 124.
Platt, J. & Vissers, R., 1989. Extensional collapse of thickened continental lithosphere: a working hypothesis for the Alboran Sea and Gibraltar Arc, Geology, 17, 540–543.
Potts, C., Calvert, A. & White, R., 1986. Crustal structure of Atlantic fracture zones—III. The Tydeman fracture zone, Geophys. J. R. astr. Soc., 86, 909– 942.