HAL Id: hal-02749663
https://hal.inrae.fr/hal-02749663
Submitted on 16 Dec 2020HAL is a multi-disciplinary open access archive for the deposit and dissemination of sci-entific research documents, whether they are pub-lished or not. The documents may come from teaching and research institutions in France or abroad, or from public or private research centers.
L’archive ouverte pluridisciplinaire HAL, est destinée au dépôt et à la diffusion de documents scientifiques de niveau recherche, publiés ou non, émanant des établissements d’enseignement et de recherche français ou étrangers, des laboratoires publics ou privés.
Model-assisted comparison of sugar accumulation
patterns in ten fleshy fruits highlights differences
between herbaceous and woody species
Coffi Belmys Cakpo, Gilles Vercambre, Valentina Baldazzi, Léa Roch, Zhanwu
Dai, Pierre Valsesia, Mohamed-Mahmoud Memah, Sophie Colombie, Annick
Moing, Yves Gibon, et al.
To cite this version:
Coffi Belmys Cakpo, Gilles Vercambre, Valentina Baldazzi, Léa Roch, Zhanwu Dai, et al.. Model-assisted comparison of sugar accumulation patterns in ten fleshy fruits highlights differences between herbaceous and woody species. Annals of Botany, Oxford University Press (OUP), 2020, 126 (3), pp.455-470. �10.1093/aob/mcaa082�. �hal-02749663�
Original Article
Title: Model-assisted comparison of sugar accumulation patterns in ten fleshy fruits highlights differences between herbaceous and woody species
Running title: Inter-species comparison of sugar and starch accumulation patterns
Authors: Coffi Belmys CAKPO1, Gilles VERCAMBRE1, Valentina BALDAZZI1,2,3, Léa
ROCH4, Zhanwu DAI6,7, Pierre VALSESIA1, Mohamed-Mahmoud MEMAH1, Sophie
COLOMBIÉ4, Annick MOING4,5, Yves GIBON4, Michel GENARD1,*
1 INRAE, UR1115, Unité Plantes et Systèmes de Culture Horticoles, Avignon,
France
2 Université Côte d’Azur, INRAE, CNRS, Institut Sophia Agrobiotech,
Sophia-Antipolis, France
3 Université Côte d’Azur, Inria, INRAE, Sorbonne Université, BIOCORE,
Sophia-Antipolis, France
4 INRAE, Univ. Bordeaux, UMR1332 Biologie du Fruit et Pathologie, Villenave
d’Ornon, France
5 Bordeaux Metabolome Facility– MetaboHUB, Villenave d’Ornon, France
6 EGFV, Bordeaux Sciences Agro, INRAE, Université de Bordeaux, Villenave
d’Ornon, France
7 Beijing Key Laboratory of Grape Science and Enology and Key Laboratory of
Plant Resources, Institute of Botany, Chinese Academy of Sciences, Beijing, 100093, China
* corresponding author: michel.genard@inrae.fr
Abstract
Background and Aims
Sugar composition is a key determinant of fruit quality. Soluble sugars and starch concentra-tions in fruits vary greatly from one species to another. The aim of this paper was to investi-5 10 15 20 25 30
gate similarities and differences in sugar accumulation strategies across ten contrasting fruit species using a modeling approach.
Methods
We developed a coarse-grained model of primary metabolism based on the description of the main metabolic and hydraulic processes (synthesis of other compounds than sugar and starch, synthesis and hydrolysis of starch, water dilution) involved in the accumulation of soluble sugars during fruit development.
Key Results
Statistical analyses based on metabolic rates separated the species into six groups accordingly to the rate of synthesis of compounds other than sugar and starch. Herbaceous species (cu-cumber, tomato, eggplant, pepper and strawberry) were characterized by a high synthesis rate than woody species (apple, nectarine, clementine, grape and kiwi). Inspection of the dynamics of the processes involved in sugar accumulation revealed that net sugar importation, metabo-lism and dilution processes were remarkable synchronous in most herbaceous plants, whereas in kiwifruit, apple and nectarine, processes related to starch metabolism were temporally sep-arated from other processes. Strawberry, clementine and grape showed a distinct dynamic compared to all other species.
Conclusions
Overall, these results provide new insights into species-specific regulatory strategies and on the role of starch metabolism in the accumulation of soluble sugars in fleshy fruits. In particu-lar, inter-specific differences in development period shape the coordination among metabolic processes and affect priorities for carbon allocation across species. The six metabolic groups identified by our analysis do not show a clear separation into climacteric and non-climacteric species, possibly suggesting that the metabolic processes related to sugar concentration are not tightly affected by ethylene-associated events.
35
40
45
50
Key words: sugar metabolism, starch metabolism, sugar uptake, water dilution, inter-species,
model, fleshy fruit, cross-species
Introduction
Soluble sugars are one of the major components of fruit pulp (Coombe, 1976) that provide essential precursors for the synthesis of many other compounds including organic acids, amino acids and structural components. In fleshy fruits, sugar content is most important in terms of fruit taste (Yin et al., 2010) as it largely determines their sweetness at harvest (Li
et al., 2012; Vizzotto et al., 1996; Kobashi et al., 2002). For a wide diversity of species,
consumers prefer fruits with high concentrations of total soluble solids, which mainly consist of soluble sugars (Kader, 1999; Crisosto et al., 2003, 2006, 2007; Crisosto and Crisosto, 2005; Grechi et al., 2008).
The amount of total soluble sugars usually changes with fruit development, peaking at ripening (Schaffer et al., 1999; Bertin et al., 2009; Dai et al., 2016). However, sugar
accumulation patterns and concentrations differ among species (Coombe 1976; Bertin et al. 2009; Nardozza et al. 2010; Dai et al. 2016). For example, Dai et al., (2016) observed a continuous and exponential increase in the concentration of soluble sugar in cherry tomato until maturity, while in peach, the concentration of soluble sugar fluctuated much less, and decreased during fruit development. At maturity, grape can attain elevated soluble sugar concentration ( 1.2 mmol/gFM; Coombe 1976), while peach and tomato have, respectively, moderate ( 0.5 mmol/gFM; Quilot et al. 2004) and low ( 0.1 mmol/gFM) soluble sugar concentrations (Biais et al. 2014).
In order to understand species differences in sugar concentrations, we must first understand the processes involved in the build-up of fruit composition and their variations across species. In recent years, numerous studies have reported that sugar concentrations vary 60 65 70 75 80 85
throughout fruit development according to three major processes (Génard et al., 2003; Quilot
et al., 2004; Dorey et al., 2015; Dai et al., 2016).
First, photoassimilates are imported into the fruit, following different phloem
unloading mechanisms (Lalonde et al., 2003; Ma et al., 2018). The nature of photoassimilates itself as well as their concentration can vary across species (Zimmermann and Milburn, 1975), although sucrose remains the main form of carbon found in the phloem of most species (Walker and Ho, 1978; Zanon et al., 2015; Jensen et al., 2013).
Second, once imported, photoassimilates are metabolized into others types of compounds to fuel fruit growth and development (Walker and Ho, 1978; Sturm, 1999; Dai et al., 2016). Although the metabolism of the photoassimilates shares similar reaction pathways associated with common enzymes, such as sucrose synthase, invertase or hexokinases, variations exist among species depending on the nature of the imported soluble sugars (e.g., sorbitol in Rosacea fruit) (Dai et al., 2016). In addition, the evolution of enzymatic activities during fruit development may differ significantly from one species to another (Hawker, 1969; Moriguchi et al., 1990, 1992; Gao et al., 1999; Dai et al., 2013; Nardozza et al., 2013;
Desnoues et al., 2014; Wang et al., 2018). The metabolism of photoassimilates imported from the phloem is in fact a complex process that is generally characterized by three steps
interrelated by feedback loops. The first step converts imported sugars from the phloem into hexoses and UDP-glucose in different compartments of the fruit such as apoplasm, symplasm or vacuole (Yamaki, 2010). The second step consists in the synthesis of many different metabolic compounds, such as starch, organic acids, cell walls and secondary metabolic compounds from previously formed hexoses (Walker and Ho, 1978; Sturm, 1999; Dai et al., 2016). The third step consists in the remobilization of certain metabolic compounds such as starch (Nardozza et al., 2010), organic acids (Matsui et al., 1979) and lipids (Wind et al., 2010) during fruit development. Although the remobilization of organic acids (Matsui et al., 1979) and lipids (Wind et al., 2010) may influence the concentration of soluble sugars during 90
95
100
105
fruit development, starch remobilization represents by far the main source of soluble sugars re-synthesis, particularly during the last developmental stages (Beaudry et al., 1989; Knee, 1993; Defilippi et al., 2004; Saraiva et al., 2013). For example, numerous studies on tomato have found a positive correlation between the maximum starch content accumulated at the beginning of fruit development and the final content of soluble sugars during fruit ripening (Davies and Cocking, 1965; Ho and Hewitt, 1986; Ho, 1988; Robinson et al., 1988; Bertin et
al., 2009; Bertin and Génard, 2018). In bananas, the total soluble sugar content increased from
1.8 to 18.6% between the beginning of development and fruit maturity, with a concomitant decrease in starch content during ripening (Prabha and Bhagyalakshmi, 1998). Thus, increasing the starch pool in immature fruits, could be a strategy to increase sugar levels in mature fruits (Petreikov et al., 2009). It is important to note that the accumulation of starch varies greatly depending on the species. For some species, such as citrus fruit (El-Otmani et
al. 2011), grape (Hunter et al. 1995), pineapple (Moyle et al. 2005), melon (Rosa 1928) or
muskmelon (Hubbard et al. 1990), starch accumulation is almost absent or limited to the very early developmental stages. In these species the synthesis of soluble sugars is mainly driven by the import of external photoassimilats (Hubbard et al. 1990). On the opposite, large
amounts of starch could be accumulated during fruit development, up to more than 85% of the dry mass for banana (Gibert et al. 2009). Between these extremes, large variations occur, in term of content and pattern (Stevenson et al. 2006; Gibert et al. 2009; Bertin et al. 2009; Nardozza et al. 2010; Bertin and Génard 2018).
The third and last mechanism that contributes to sugar concentration is water dilution, which results from an increase of the fruit volume (Génard et al., 2003, 2014). Many studies showed that sugar concentration in fruit usually decreases in proportion to water supply (Blanco et al., 1989; Li et al., 1989; Crisosto et al., 1994; Wei et al., 2017) but the importance of water dilution depends on the dynamics of the fruit growth and thus varies with the species and environmental conditions.
115
120
125
130
Understanding the differences and similarities of sugar accumulation strategies across fruit species can help to identify key physiological processes, common regulatory mechanisms as well as possible trade-offs, in the perspective of improving fruit quality (Roch
et al. 2019). In spite of such a potential, only few works have addressed the issue of species
comparison to date. One reason for this resides in the difficulty of resuming differences both in the nature of the physiological process involved (diversity of the molecules and enzymes) as well as in their duration, across different species. In Klie et al. (2014), the temporal evolution of 16 common metabolites (including soluble sugars, organic acids and amino acids) were compared across 4 different species using a statistic approach. In Dai et al.
(2016), process-based modelling was applied to different varieties of peach, tomato and grape and used to dissect the accumulation of soluble sugars into 3 elementary processes (sugar importation, metabolism and water dilution). In addition to these interspecific comparison work, intra-specific comparisons have been carried out in several species (peach: Quilot et al., 2004; grape: Sadras et al., 2008; tomato: Prudent et al., 2011) using an ecophysiological modelling approach.
Genotype and species-specific strategies were highlighted corresponding to different
contributions of the various processes along fruit development. However, none of these works has taken into account the role of starch metabolism in the build-up of sugar concentration. The aim of this study was to extend the work of Dai et al (2016) to account for the role of starch metabolism in sugar accumulation in fruits. For this aim, we proposed a generic sugar model explicitly describing the variation in sugar and starch concentration over time. The model was successfully calibrated on 10 contrasting species of fleshy fruits and the estimated parameters used to group or separate species according to their metabolic profile.
Finally the model was used to determine the relative contribution of five potential drivers to the observed inter-species variability in soluble sugar and starch concentrations. These five 140
145
150
155
potential drivers are: (1) sugar importation, (2) synthesis of compounds other than sugar and starch, (3) synthesis of starch, (4) hydrolysis of starch and (5) dilution.
Materials & Methods
Fruit Material and Growth Conditions
This study was conducted on strawberry (Fragaria × ananassa. cv Gariguette), cucumber (Cucumis sativus L. cv Aljona), tomato (Solanum lycopersicum L. cv. Moneymaker), eggplant (Solanum melongena L. cv Monarca RZ), kiwifruit (Actinidia deliciosa Chev. cv Hayward), pepper (Capsicum annuum L. cv Gonto Clause), apple (Malus x domestica Borkh. cv Golden), nectarine (Prunus persica L. cv Nectarlove), grape (Vitis vinifera L. cv Cabernet Sauvignon) and clementine (Citrus clementina hort. cv SRA 63). The choice of the variety was made either because of their commercial interest or of the exhaustive studies already carried out on them (Biais et al., 2014; Colombié et al., 2015, 2017). Experiments were performed in France on orchard for nectarine (INRA Avignon), apple (INRA Gotheron), kiwifruit (at a commercial orchard near INVENIO Sainte Livrade) and clementine (INRA San Giuliano), in plastic tunnel for pepper (INVENIO Sainte Livrade) and in greenhouse for grape (INRA Bordeaux), cucumber (CTIFL Carquefou), tomato, eggplant and strawberry (all three of them in INVENIO Sainte Livrade). All species have been grown according to commercial practices except for grape (Ollat et al. 1998), cultivated as fruiting cuttings (see
Supplementary table 1 for culture conditions). These species are representative of different types of fleshy fruit, such as non-climacteric (strawberry, pepper, eggplant, cucumber, grape, clementine) and climacteric fruits (apple, kiwifruit, tomato, nectarine), making them
biologically significant for comparison.
Fruit Harvest and Sample Processing
165
170
175
180
Depending on the species, 9 to 16 sampling dates were monitored along fruit development. Tomato (Biais et al. 2014), strawberry, cucumber, eggplant, kiwifruit, pepper, apple and nectarine fruits were collected from anthesis or during their young age after flowering to their physiological stage of maturity. For each species, the developmental stage was identified as the number of days after anthesis (DAA). At each harvesting date, five biological replicates were prepared, with a minimum of four fruits per replicate except for cucumber which has at least 2 fruits per replicate. During sample preparation, physical measurements (fresh mass, height and diameters) were quickly taken on each of the fruits. Pericarps were then deep frozen in liquid nitrogen and stored at -80°C before cryogrinding, lyophilisation and
biochemical analyses. Lyophilisation allowed measuring the dry matter content. Sample dry matter was calculated from the dry matter content and measured fresh mass.
Metabolite Measurements
Metabolite were measured as in Biais et al. (2014). Briefly, the metabolites were extracted from 20 mg fresh weight aliquots using an ethanol-based fractionation protocol. Assays were performed with microplates using a pipetting robot (Star 96 ML 6649 Hamilton, Villebon sur Yvette, France) to quantify major metabolic traits. Glucose, fructose and sucrose were
determined in the supernatants according to Stitt et al. (1989), sorbitol according to Desnoues et al. (2014). Starch was determined in the pellets after NaOH solubilization and enzymatic hydrolysis (Hendriks et al. 2003).
Description of the model
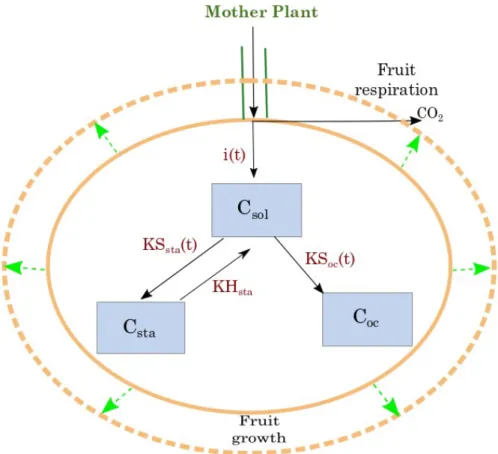
The proposed generic model (see Fig.1) is a modification of the SUGAR model previously developed on peach by Génard and Souty (1996) and Génard et al. (2003). The fruit pericarp is described as a single compartment connected to the mother plant, from which it receives 190
195
200
205
carbon and water. Water uptake is responsible for fruit volume expansion. Indeed, fruit volume is not constant but increases in time according to experimental measurements (fruit fresh mass, FM), thus progressively diluting metabolic concentration inside the fruit, a process not taken into account in classical metabolic models. The net carbon inflow (i(t)) to the fruit is defined as the difference between the carbon flow from the mother plant minus the fruit respiration. It can be computed from the experimentally measured fruit dry mass (DM) and fresh mass (FM) as:
(1)
where γDM is the pericarp carbon concentration [γγDW = 0.45 gC gDM-1; mean value calculated
from literature data (Supplementary table 2)], FM (g) is the fresh mass of the fruit and
dDM/dt (in gDM h-1) is the pericarp growth rate in dry mass.
The net carbon inflow to the fruit is then used as substrate for (i) the synthesis of soluble sugars (Csol, in gC gFM-1), ii) the synthesis of starch (Csta, in gC gFM-1) and iii) for the
metabolic pathways involved in the synthesis of compounds other than soluble sugars and starch (Coc in gC gFM-1, e.g., acids, structural carbohydrates, and proteins) . Moreover, the
starch in the fruit could be degraded to provide carbon back in the form of soluble sugars (see Fig. 1, for a schematic representation of the model)
Recycling of organic acids or cell wall components into soluble sugars have been reported in some species, especially during the last developmental phases (Beauvoit et al., 2018). Recent studies on tomato and grape, however, showed that these processes contribute only for a small percent to soluble accumulation and that glycolysis remain the main process, all over fruit development (Colombié et al. 2015, Walker et al. 2015, Famiani et al. 2016). For sake of simplicity, we neglect the possible hydrolysis of other compounds back into soluble sugars for the time being.
215
220
225
230
Accordingly, the rate of variation of soluble sugar [γdCsol/dt (in gC gFM-1 h-1)], starch [γdCsta /dt
(in gC gFM-1 h-1)] and other compounds [γdC
oc /dt (in gC gFM-1 h-1)] concentrations can be
decomposed into the contribution of five physiological processes, following a linear kinetics, (2)
(3)
(4)
Where
is the net carbon uptake (gC gFM-1 h-1),
is the starch hydrolysis, is the starch synthesis,
is the synthesis of compounds other than soluble sugars and starch, and
is the relative fruit growth rate in fresh mass, used for the computation of the dilution effect.
KHsta (gC.gFM-1.h-1) is the starch hydrolysis rate defined as a constant according to Hall et al.,
(2006), KSsta (t) (gC.gFM-1.h-1) is the starch synthesis rate, and KSoc (t) (gC.gFM-1.h-1) is the
rate of consumption of sugars for synthesis of compounds other than sugar and starch. 240
245
250
Following Prudent et al. (2011), KSoc (t) was assumed to depend on the fruit relative growth
rate as:
(5)
where and η (both dimensionless) are species-dependent parameters.
Following Hall et al. (2006), we assumed that (t) varied according to the fruit age as:
(6)
From the above equations, we can define the mean contribution to sugar soluble accumulation of the different processes (IMP, the carbon importation, Hsta, the starch hydrolysis, Ssta, the
starch synthesis, Soc, the synthesis of others compounds and DIL, the dilution) as:
(7)
where Tm is the maturity date [γhours after anthesis].
In addition, we define the mean increment of sugar concentration (SUG) as
(8)
260
265
270
For any compound (soluble sugars, starch or other compounds) and process (IMP, Hsta, Ssta,
Soc or DIL), the concentration in gx 100gFM-1 ( x= sugar or starch) was calculated by
multiplying all computations by 100 and applying the conversion factors for soluble sugars (0.4 gC g-1) and starch (0.444 gC g-1) according to Figueroa-Torres et al. (2017).
Model inputs
280
285
290
For each species, the dynamics of fruit dry and fresh mass were smoothed (Supplementary figure 1) from the experimental measurements using the constrained B-splines nonparametric regression quantiles (COBS), implemented by the cobs function in the R package “cobs” (Ng and Maechler 2007). In the case of grape and clementine, data smoothing started respectively shortly before veraison and at the formation of vesicles. Depending on the species, we varied the lambda and nknots parameters of the cobs function between the intervals [γ0 - 2] and [γ2 - 7] respectively and the degree of the splines was set at 2.
Model calibration
On the basis of the estimated values of dry mass and fresh mass along the fruit growth, the model calibration for a given species consisted in the estimation of six parameters
. The performance index used in the model calibration is the Normalized Root Mean Squared Error (NRMSE), a dimensionless indicator. As defined by Wallach et al. (2014), Normalized Root Mean Squared Error can be computed as:
(9)
with Oi and Si being respectively the observed and simulated values of fruit flesh soluble sugars or starch content, and n the number of observations. Two objective functions were related to the soluble sugars (NRMSESSC) and to the starch content (NRMSESTC) of the fruit.
They are defined as follows:
(10) (11) 300 305 310 315
where is the vector of parameters to be estimated. The model calibration was therefore formulated as a multi-objective minimization problem as follows:
(12)
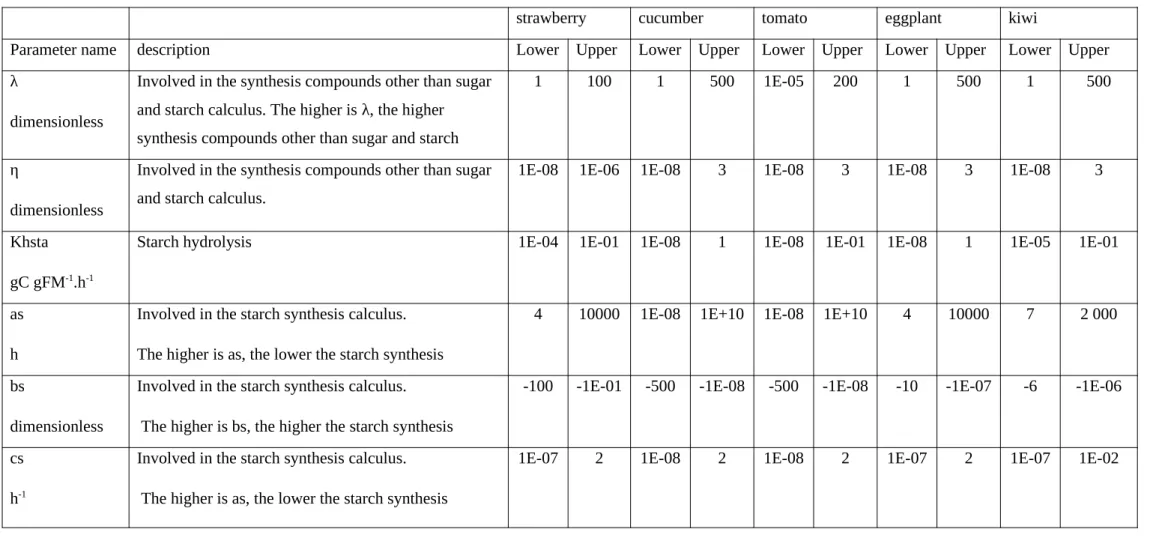
Where D is the possible search space defined by the boundaries of the parameters set according to experts' declarations and/or the literature (see Table 1).
This is a difficult multi-objective optimization problem that resists classical optimization algorithms. The Non-dominated Sorting Genetic Algorithm II (NSGA-II) developed by Deb
et al. (2002) has proven to be an effective and efficient multiobjective optimization algorithm.
This algorithm is considered as a reference in the multi-objective optimization community. Therefore, we used this algorithm for sugar model calibration. NSGA-II algorithm was applied through the Java package jMetal with a population size set at 200 and a number of generations set at 300. As the NSGA-II algorithm is stochastic, the optimization process was repeated 200 times in the calibration phase. All solutions resulting from the calibration of the model were first pooled together and then filtered thanks to the is_dominated function of the “emoa” package (developed for R) in order to identify the Pareto-optimal set i.e. solutions allowing the best tradeoffs between calibration objectives. Then, from the Pareto-optimal set, we selected 100 solutions i.e. parameters’ combinations that minimize the sum of the
objectives functions (NRMSESSC+ NRMSESTC).
Parameter data set analysis
Due to the differences in order of magnitude between species for five parameters ( , as,
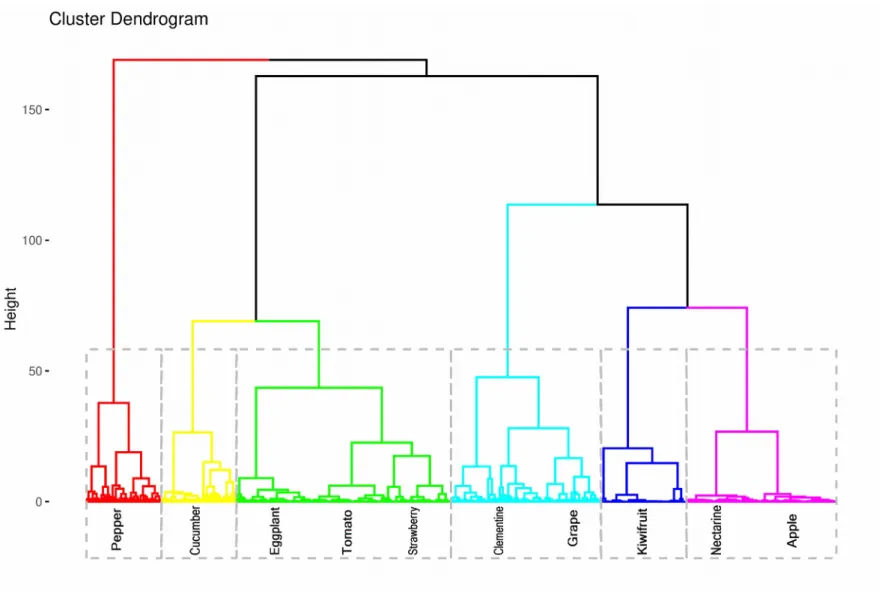
bs and cs), a log transformation on the values of these parameters was performed for the 100 solutions selected as explained above. A hierarchical cluster analysis (HCA) was performed on parameter data set using an Euclidean distance matrix as processed with Ward’s clustering 320
325
330
335
method (Murtagh and Legendre, 2014) to identify groups of species with similar parameter combinations. Principal Component Analysis using normalized and centered data (“ade4” package developed for R, Dray and Dufour, 2007) was also performed on parameter data sets in order to group or separate species according to their metabolic function.
The values of the different processes involved in the concentration of soluble sugars, namely IMP, Hsta, Ssta, Soc and DIL, were computed for each species according to Equation 7.
RESULTS
Model catches differences in dynamic patterns of soluble and insoluble carbohydrates across a contrasted panel of fruit species
The temporal evolution of sugar and starch concentration was monitored on ten fruit species during fruit development (Fig. 2). The duration and dynamic patterns were strikingly different from species to species. For most of the species, the sugar concentration reached a plateau during the growth period, with the exception of strawberry, apple and nectarine whose sugar concentration increased almost linearly until fruit maturity (Fig. 2 A, G and H). The sugar concentration of tomato (Fig. 2 C) stabilized very early (before 30% of their development) compared to kiwifruit, pepper, grape and clementine (Fig. 2 E, F, I and J), which stabilized around or after 50% of fruit development. The sugar concentration of cucumber and eggplant (Fig. 2 B and D) decreased after 30% of their development. At maturity, a large difference in sugar concentration was observed across species, with a decreasing concentration ranging from grape (15.6 g/100g FM ± 0), followed by nectarine (12.4 g/100g FM ± 1.5), apple (10.2 g/100g FM ± 0.9), clementine (7.7 g/100g FM ± 0.8), kiwifruit (5.9 g/100g FM ± 0.2), strawberry (5.6 g/100g FM ± 0.5), pepper (5 g/100g FM ± 0.2), eggplant (2.3 g/100g FM ± 0.2), tomato (2.2 g/100g FM ± 0.1) and cucumber (1.3 g/100g FM ± 0.2). Analogous variations were also observed in fruit sugar content but the ranking among species was modified: nectarine moved to the first place with a sugar content of (78.8 g/100g DM ± 11.4) whereas kiwifruit ranked last with only (35.6 g/100g DM ± 1.2) of sugar (Supplementary figure 2).
As for soluble sugars, the dynamics of starch also showed inter-species variations, especially in the onset of starch hydrolysis. In tomato, eggplant, kiwifruit, apple and nectarine, starch concentration showed a clear increase up to a maximum value, followed by a progressive decrease until fruit maturity (Fig.2 M, N, O, Q and R). However, for the other species net starch hydrolysis started very early, so that the maximum starch concentration was reached 350
355
360
365
before 30% of their development. As a consequence, for these species, the period of starch synthesis could not be fully observed in our dataset (Fig. 2 K, L, P, S, and T). Nonetheless, a large difference in the maximum measured starch concentration was observed for kiwifruit having the highest value (3.3 g/100g FM ± 0.2 ), followed by apple (1.9 g/100g FM ± 0.3), nectarine (0.8 g/100g FM ± 0.1), pepper (0.6 g/100g FM ± 0.1), strawberry (0.5 g/100g FM ± 0.1), tomato (0.5 g/100g FM ± 0.1), cucumber (0.1 g/100g FM ± 0), eggplant (0.1 g/100g FM ± 0), clementine (0 g/100g FM 0) and grape (0 g/100g FM ± 0). At maturity, the starch concentration of most species was close to zero, except for apple that kept a substantial starch concentration, close to half of its maximum value.
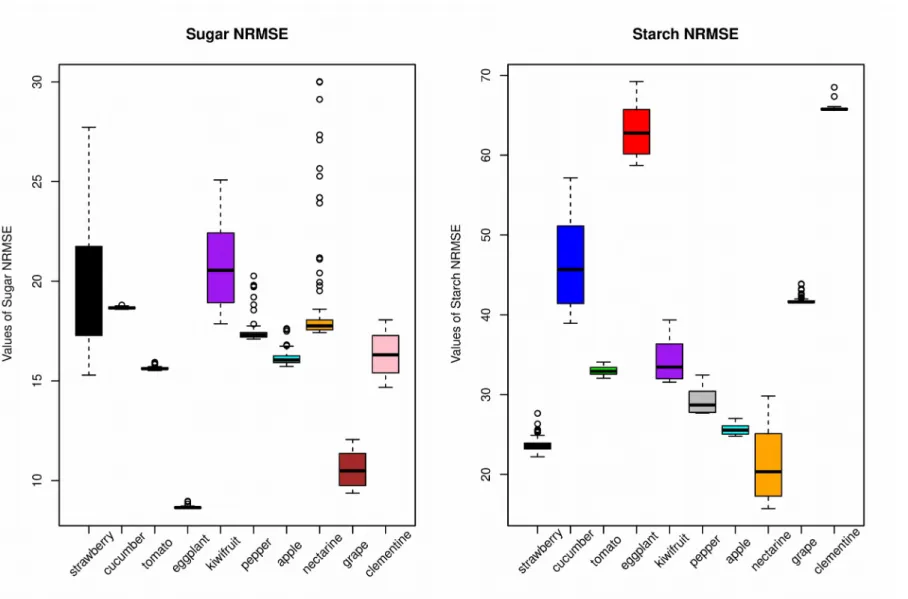
A generic dynamic model of sugar and starch metabolism was built based on previous works on individual species (Génard et al., 2003; Quilot et al., 2004; Dai et al., 2009; Prudent et al., 2011; Wu et al., 2012) and calibrated for the ten fruit species. The proposed model is coarse-grained enough to bypass existing differences among the underlying metabolic pathways of various fruit species, but yet able to catch a large variety of dynamical patterns. Regardless of the species, indeed, the simulations of soluble sugars and starch concentrations or contents matched the experimental results fairly well (Fig.2, Supplementary figure 2). However, the quality of the fit to sugar content was generally better for soluble sugars (median NRMSE between 9 - 21%) than for starch (median NRMSE between 20 - 66%) (Fig. 3). The NRMSE values of starch were especially high for cucumber, eggplant, grape and clementine (Fig. 3). For these species, the maximum measured starch content was always very low (less than 2g/100gMS) giving rise to large NRMSE value even for a small deviation from the measured data (Supplementary figure 2).
To ensure a good exploration of the parameter space, model calibration was repeated 200 times for each species. The best 100 estimates are presented in Supplementary figure 3. The range of estimated values for parameters related to the synthesis of other compounds than 375
380
385
390
sugar and starch ( and η), was narrow for a given species but large differences appeared between species. The values of these two parameters were high for clementine, grape, apple, nectarine and pepper species compared to kiwifruit, tomato, cucumber, eggplant and
strawberry. Concerning starch metabolism, all species except pepper had starch hydrolysis
parameter values (KHsta) in the same order of magnitude and with low variability between the
different estimations. For a given starch synthesis parameter (as, bs and cs), the estimated values presented a large variation between and within species.
Inter-species comparison: classification based on model parameters
A hierarchical cluster analysis (HCA) was applied to the estimated parameter sets, in order to quantify the distance among species (Fig. 4). Six clusters were identified. The first one includes tomato, eggplant and strawberry, the second one apple and nectarine, the third one clementine and grape and the three last ones cucumber, kiwifruit and pepper, respectively (one species by cluster).
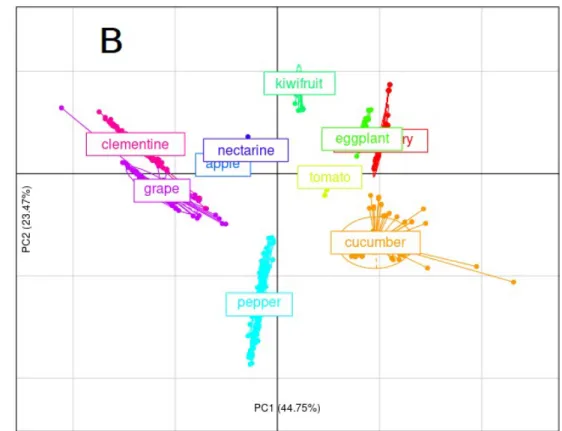
To better investigate the link between parameters and sugar accumulation patterns, a principal component analysis (PCA) was performed on parameter values estimated for all species. The first three principal components accounted for 85.5% of the total variance (44.7% PC1, 23.5% PC2 and 17.3% PC3). The inter-species variability of parameter values was generally higher than the intra-species variability. Fig. 5 shows the first two principal components (PC1 and PC2). The parameters related to the synthesis of the other compounds were strongly
negatively correlated ( and η) with PC1, while parameters related to starch metabolism (KHsta, as, bs, cs) spanned the whole PC1 x PC2 plane. The projections of the synthesis rate
functions as supplemental variables indicated that PC1 mainly describes the synthesis of the other compounds, while PC2 deals with starch synthesis and hydrolysis.
Interestingly, the PC1 x PC2 plane separates species into six groups similar to those observed by the clustering analysis (Fig. 4). On PC1, cucumber, strawberry, eggplant and tomato, have 400
405
410
415
a high synthesis rate for compounds other than sugar and starch, followed by kiwifruit, pepper, nectarine and apple, and next by grape and clementine which have very low synthesis rate. PC2 mainly opposes kiwifruit to pepper on the basis of starch metabolism
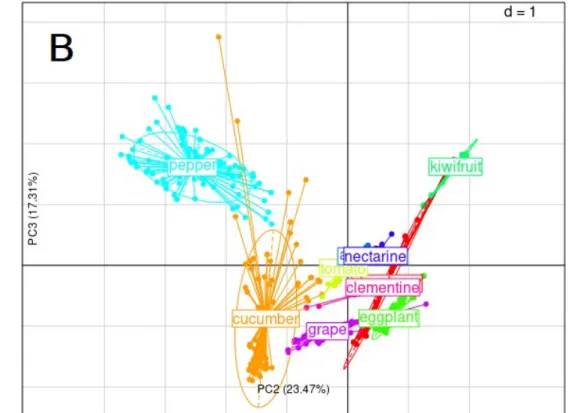
(Synthesis/Hydrolysis). Starch synthesis and hydrolysis were further separated on the PC2 x PC3 plane which clearly separate kiwifruit, cucumber and pepper, as shown in Fig. 6.
Projection of individual species (Fig. 6-B) on PC2 x PC3 plane shows that kiwifruit has both high starch synthesis and hydrolysis rates when pepper is characterized by a very low rate of starch hydrolysis. Cucumber is characterized by a low starch synthesis. All other species were close together and showed an intermediate starch synthesis.
Carbon allocation patterns across species agrees with classification based on parameter values
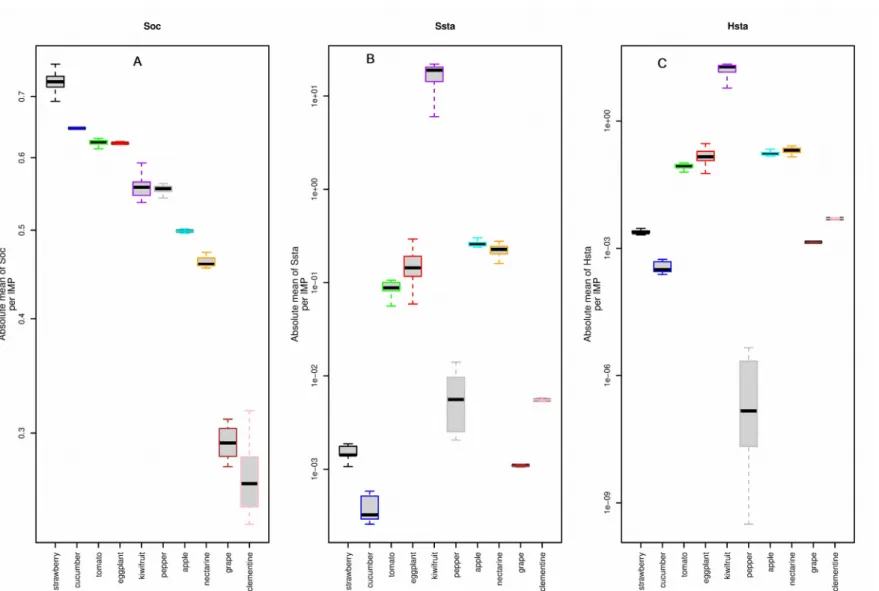
HCA and PCA were based on kinetics parameters, but metabolic fluxes also depend on substrates and network structure. In order to better understand the functional consequences of the observed difference in parameter values, we estimated the carbon allocation pattern to each metabolic flux as a percentage of the net carbon uptake. Fig.7 shows that the synthesis of other compounds is a major metabolic process in all species, accounting for 25 to 75% of the imported carbon. In particular, strawberry, cucumber, tomato and eggplant species were characterized by a high allocation to synthesis of other compounds (> 60% of imported carbon) compared to grape and clementine species characterized by a low allocation value (< 30%). Kiwifruit, pepper, apple and nectarine were intermediate species, with an allocation about half of the imported sugar. It is interesting to notice that the distribution of species on PC1 axis (Fig. 5 B) was strongly correlated (r=0.95) to the inter-specific variation of the allocation for the synthesis of other compounds.
Carbon allocation to starch synthesis was much smaller for all species except kiwifruit. In tomato, eggplant, apple and nectarine, the allocation of carbon to starch metabolism was 100 times lower than in kiwifruit, whereas in strawberry, cucumber, pepper, grape and clementine, 425
430
435
440
the difference was even stronger, with allocation values about 10,000 times lower than that for kiwifruit (Fig. 7).
Different degree of coordination among processes driving sugar concentration
Fruit taste is mainly determined by sugar concentrations and depends not only on metabolism but also on water import and fruit transpiration. Moreover, both physiological and hydraulic processes are dynamic so that their importance may vary over time, depending on the species and the developmental stage.
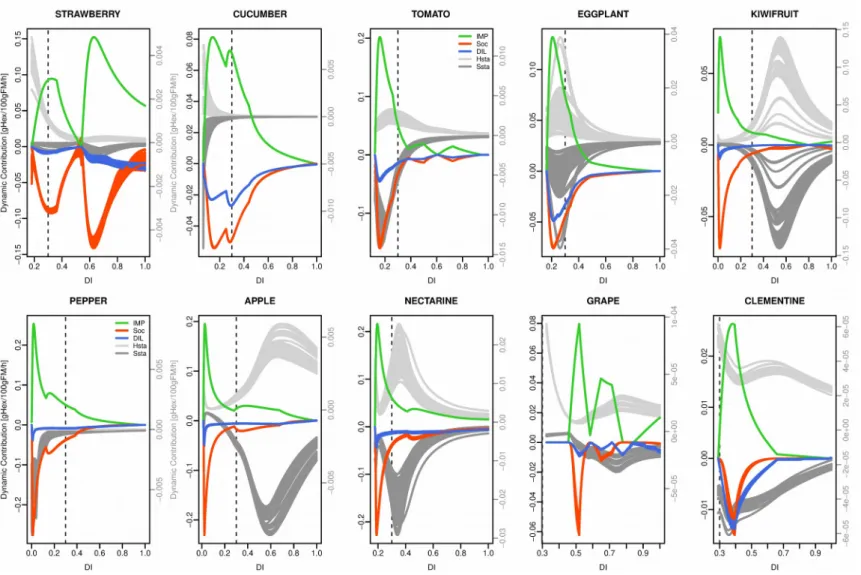
Equation 2 was used to decompose the hourly variation of soluble sugar concentration into five physiological processes: net sugar importation to the fruit, synthesis of other compounds than sugar and starch, starch synthesis, starch hydrolysis and dilution by water uptake (Fig. 8). Among the five physiological processes, net sugar importation and starch hydrolysis
contribute to the gain in sugar, while synthesis of other compounds, starch synthesis and dilution by water lead to a decrease in sugar concentration. An interesting point is that synthesis of other compounds and dilution were both negatively correlated to net sugar importation and that all the species followed the same curve (Supplementary figure 4) which means that these processes are highly coordinated.
When looking at the dynamic patterns, different degrees of coordination among processes can be observed. In cucumber, tomato, eggplant and pepper net sugar importation, metabolic and dilution processes showed a remarkable synchrony. Sugar importation, water dilution, synthesis of other compounds and starch -related processes all increased early and reached a peak before 30% of development time except for starch hydrolysis in pepper, which remained close to zero during the whole fruit development.
In contrast, in kiwifruit, apple and nectarine, processes related to starch metabolism were temporally separated from other processes. In early developmental phases, fruits essentially invested the imported carbon into other compounds (cell walls, organic acids, protein…) 450
455
460
465
whereas starch synthesis was low. It is only when net carbon uptake started to slow down that starch metabolism began, peaking between 35% and 70% of developmental period, depending on the species. During the last developmental phase, all processes eventually decreased to zero except for starch hydrolysis in apple, which remained active until fruit maturity.
Strawberry, clementine and grape showed a dynamic that was different from that of the other species. Indeed, in these three species, observed starch dynamics were mainly led by starch hydrolysis whereas starch synthesis was quite stable over time. In addition, strawberry and grape showed clear biphasic dynamics for both net sugar importation and the synthesis of other compounds with two distinct peaks after 30% of developmental period.
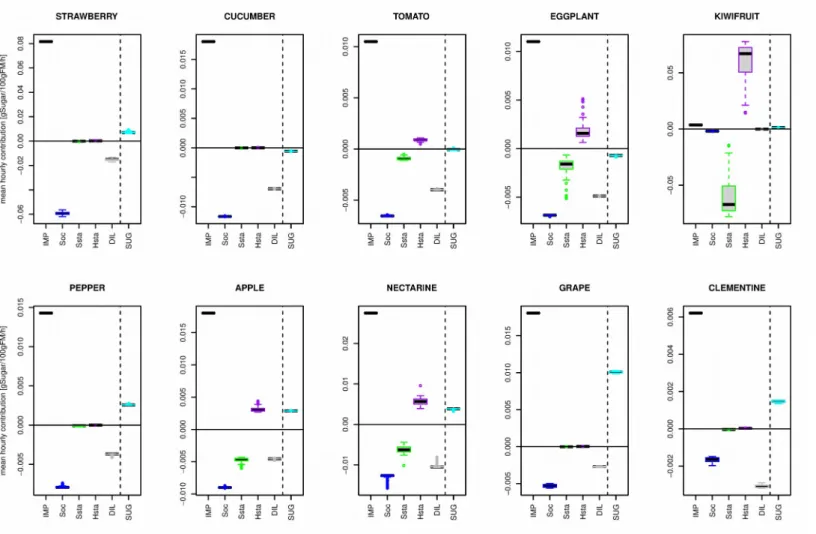
Contribution of the processes involved in sugar concentration.
Mean hourly contribution of the five processes (Fig. 9) were calculated over the period encompassed between 30% of the development time to maturity in order to identify, for each species, the processes that most influenced the final sugar concentration.
In most species, except kiwifruit, sugar import was the dominant process involved in sugar concentration, followed by synthesis of other compounds. The contribution of starch metabolism strongly varied between species. In kiwifruit, starch synthesis and starch hydrolysis exceeded by far the other processes conditioning sugar concentration whereas in strawberry, cucumber, pepper, grape and clementine, the contribution of starch metabolism was close to zero. For tomato, eggplant, apple and nectarine, starch synthesis and hydrolysis also influenced sugar concentration but to a lower extent than in kiwifruit.
Interestingly, over the studied developmental period, the flow balance related to the five processes (SUG) is positive for most species except cucumber, tomato and eggplant, which showed a negative flow balance. Thus, in the latter three species, the sugar concentration decreased from the developmental index 0.3 to maturity. This decrease was the result of higher starch synthesis, high dilution by water, high synthesis of compounds other than sugar 475 480 485 490 495 500
and starch in comparison to net sugar import. On the opposite grape showed a high increment of sugar concentration (SUG), which was the result of low synthesis of other compounds than sugar and starch, and fairly low dilution in comparison to net sugar import.
Discussion
The concentration of soluble sugars is a key determinant of the quality of fleshy fruits (Dai et
al., 2016). The aim of this article was to investigate similarities and differences in fruit
accumulation strategies among ten contrasting fruit species using a carbohydrate model. For this purpose, we developed a generic sugar model based on the description of the main metabolic and hydraulic processes (synthesis of other compounds than sugar and starch, synthesis and hydrolysis of starch, water dilution) involved in the accumulation of soluble sugars during fruit development. Using this approach, it was possible to classify fruit species on the basis of their metabolic rates and to quantify the effects of major physiological and dilution processes that affect sugar concentration in fruits.
Inter-species comparison on basis of metabolic rates
Results of the statistical analyses (Clustering and PCA) on the estimated parameter sets showed that the ten species of this study can be split up into 6 groups based on their metabolic profiles. According to our analysis, the species are better separated according to their
allocation to the synthesis of other compounds. Interestingly, species with a high synthesis rate (cucumber, strawberry, tomato and eggplant) have a relatively short development time (<100 days after flowering) and are all herbaceous species while those with a low synthesis rate of other compounds than sugar and starch have a long development time (>100 days after flowering) and represent woody species (clementine, nectarine, apple and grape). Kiwifruit and pepper lie between the two groups.
The link between growth and synthesis of other compound was not completely unexpected though. Indeed, the function (equation 5) describing the synthesis rate of compounds other 505
510
515
520
than sugar and starch in the model is dependent on the fruit relative growth rate (RGR) which can vary from species to species. Our results suggest that the development time of the species is inversely associated to their relative growth rate and to the synthesis of structural and metabolic compounds other than sugar and starch. Indeed, melon, an herbaceous species with a total development time of 40-50 days (Gao et al., 1999) has a much higher max RGR (80% day-1) than grape (14% day-1, Ollat and Gaudillere, 1998) and pear (6% day-1, Shiratake et al.,
1997) two woody species with development time over 120 days. The positive relation
between synthesis of other compounds and RGR can be interpreted assuming that fast growth needs to be supported by rapid synthesis of structural compounds (cell wall, but also proteins) in order to support cell division and ensure the appropriate mechanical and functional
properties.
For a better understanding of the difference between woody and herbaceous species, it would be interesting to analyze the nature of the other compounds. This could help to identify the carbon content and the physiological functions (structural, storage, cellular machinery, …) of the different metabolites that make up the pool of other compounds.
The statistical analyses by PCA and HCA do not show a clear separation of the species into climacteric (tomato, apple, nectarine and kiwifruit) and non-climacteric (strawberry, eggplant, pepper, cucumber, clementine and grapes) groups. This could suggest that the three metabolic processes (synthesis of other compounds, starch synthesis and starch hydrolysis) related to sugar concentration are not tightly affected by ethylene-associated events that characterize the climacteric and non-climacteric categories of fruits, or that they do not describe metabolism with enough detail.
Strong differences may exist among varieties, though. Surprisingly, the first group identified by clustering includes climacteric tomato and non-climacteric strawberry and eggplant species, in line with what has been observed by Klie et al., (2014) for the tomato cultivar M82, but not for the cultivar Alisa Craig. Indeed, genotypic differences can significantly 530
535
540
545
affect the estimation of model parameters, possibly resulting in different classifications. Most of the species considered here have been subjected to intensive breeding programs, that may have favored specific metabolic processes, depending on the expected end-use (e.g. fleshy ketchup tomato vs more juicy salad tomatoes). In the future, the impact of genotypic
variability on inter-species comparison should be explicitly accounted for, in order to evaluate the robustness of the above-mentioned patterns and identify common regulatory principles across species.
Inter-species comparison based on the dynamics of physiological fluxes
The sugar concentration in fleshy fruits is influenced by incoming and outgoing sugar and water flows (Guichard et al., 2001), and by the rate of metabolic transformations. The model developed here allowed to compare the dynamics of sugar accumulation based on the
contribution of five key processes (Fig. 8): the sugar net importation to the fruit, the metabolic transformation of sugars into compounds other than sugar and starch, the metabolic
transformation of sugars into starch, the hydrolysis of starch into sugars and the dilution of sugars by water.
The model showed (Fig. 8) that species can display distinct degrees of coordination among processes. In typical herbaceous vegetables such as tomatoes, cucumber, eggplant and pepper, all five processes have a synchronous dynamic, with a peak during the early stages of fruit development. In these species the maximum starch accumulation coincides with the peak of synthesis of structural compounds (cell walls, enzymes, organics acids...), suggesting that starch remobilization helps sustaining the fruit during the active period of cell division. However, in woody plants such as kiwifruit, apple and nectarine species, the increase in starch synthesis and hydrolysis fluxes only occurs after the drop in sugar import fluxes, dilution and 555
560
565
570
synthesis of compounds other than sugar and starch (Fig. 8). In these species, the conversion of starch into soluble sugars is one of the most important events during ripening and directly affects the final sugar composition of the fruits (Berüter 1985; Wang et al. 1993; Richardson
et al. 1997; Moing et al. 2001; Petreikov et al. 2009).
The dynamics of sugar import, metabolism and dilution are consistent with the results previously obtained by Luengwilai and Beckles, (2009) and Dai et al., (2016) in tomato. Results on the dynamics of starch metabolism agree with the observations reported in the literature on citrus fruits (Mehouachi et al., 1995; Mesejo et al., 2013), strawberry (Moing et
al., 2001; Souleyre et al., 2004) , grape (Lebon et al., 2004), apple (Berüter, 1985; Brookfield et al., 1997; Ackerman and Samach, 2015), tomato (Luengwilai and Beckles, 2009; Petreikov et al., 2009) and kiwifruit (Richardson et al., 1997).
Among all species monitored, strawberry, clementine and grape showed a distinct dynamics compared to all other species. In the case of grape and clementine, such a difference could be partly due to our model input that started at 30% of their development and that did not allow a proper observation of the starch synthesis phase. The strawberry differs from other species in its ability to grow and accumulate sugar during the last stages of fruit development, when most species tend to reach a plateau (Fig.2 and Supplementary figure 1). The analysis of the underlying physiological processes revealed a second, late peak of sugar import and synthesis of other compounds after 60% of development time. In their work, Moing et al., (2001) observed an increase in organic acid concentration reaching maximum values during the later growth stages which suggests that the second peak observed in strawberries could at least partly be related to an accumulation of organic acids.
It is interesting to notice that species partition according to process dynamics does not
coincide with the metabolic groups defined by PCA and HCA, suggesting that the inclusion of the dilution effect is important to correctly interpret the different sugar accumulation
strategies. 580 585 590 595 600
Metabolic modeling such as flux balance analysis (FBA) can predict steady-state fluxes with a fine biomass composition as the main output constraint and ignoring changes in cell volume. For instance, FBA has been previously used to model steady-state snapshots of tomato fruit metabolism at different stages of development (Colombié et al., 2015). This model of primary metabolism declined under water-stress and shading conditions, revealed a peak of fluxes involved in respiration and energy dissipation mechanisms suggesting a crucial role of starch hydrolysis in the respiratory climacteric of tomato fruit (Colombié et al., 2017). Flux
predictions with this computational approach are a direct consequence of the constraints imposed thus recently Shameer et al., (2020) developed GrOE-FBA (Growth by Osmotic Expansion - Flux Balance Analysis) a framework that accounts for osmotic constraints needed to drive cell expansion. Interestingly this model showed similar energetic costs for metabolite biosynthesis and accumulation in dividing and expanding cells. An interesting result is that again, transitory starch accumulation, associated with the phloem influx and metabolic demand, has a crucial role to ensure an optimal fruit development.
The results obtained in this study represent a first step in order to understand the modes of the regulation of the major processes involved in sugar accumulation. In a next step, it would be interesting to dissociate the acids from the cell walls in the model in order to better assess the respective contribution to carbohydrates accumulation during the early phases of fruit
development.
The complex interplay between metabolic processes, water balance and fruit growth should also be better addressed. Indeed, the concentration in soluble compounds (sugars, acids...) can affect the fruit osmotic potential and the resulting water uptake. Differences in skin
conductance across species (from 30 cm/h in tomato to 800 cm/h for peaches according to Dai
et al. 2016) can affect fruit transpiration, in turn modifying the impact of dilution over
metabolic concentration. 605 610 615 620 625
In the present model, although the effect of water dilution on metabolite concentrations was explicitly included, the water flux was imposed (based on the observed fruit growth) and did not depend on the dynamics of metabolite concentrations. Coupling of our generic sugar model with a biophysical model of fruit growth (Fishman and Génard, 1998; Lescourret and Génard, 2005; Génard et al., 2007) would permit to predict fruit growth from metabolism in a dynamic way.
At term, a better understanding of the different mechanisms involved in the control of fruit composition, from the biophysical to the metabolic aspects, will help to identify the major regulatory steps, improving our ability to manage and select new high-quality products.
Supplementary Data
Supplementary Data and Figures consist of the following files. Supplementary table 1: Culture conditions for the ten fruit species.
Supplementary table 2. Literature data used to compute the pericarp carbon concentration. Supplementary figure 1: Smoothing curves of the dynamics of the fresh and dry mass of ten fruit species.
Supplementary figure 2: Temporal evolution of sugar and starch content during the ten fruit species development.
Supplementary figure 3: Distribution of the best 100 estimated values for parameters of model.
Supplementary figure 4: The relation between net sugar importation and synthesis of other compounds and dilution processes.
630
635
640
645
Acknowledgements
We thank Valérie Serra, Cécile Thomas, Patricia Ballias and Cédric Cassan for their technical
help. For fruit culture, we thank Dr Daniel Plenet and INRAE PSH, Dr Sylvaine Simon and INRAE UE695, Dr Olivier Pailly and INRAE UE CITRUS, Dr Vincent Truffault and CTIFL Carquefou, Pierre Gaillard, Henri Clerc, Eric Sclaunich, Daniel Chabot and Invenio, Jean-Pierre Petit, Prof. Eric Gomès, Prof. Serge Delrot, Dr. Philippe Vivin, Dr. Ghislaine Hilbert, Christel Renaud, Messa Meddar. Coffi Belmys Cakpo and Léa Roch were funded by
FRIMOUSS (ANR-15-CE20-0009-01). The biochemical analyses were performed at Bordeaux Metabolome Facility, MetaboHUB - PHENOME-EMPHASIS (ANR-11-INBS-0010, ANR-11-INBS-0012).
Literature Cited
Ackerman M, Samach A. 2015. Doubts regarding carbohydrate shortage as a trigger toward
abscission of specific Apple (Malus domestica) fruitlets. New Negatives in Plant Science 1–2: 46–52.
Beaudry RM, Severson RF, Black CC, Kays SJ. 1989. Banana ripening: implications of
changes in glycolytic intermediate concentrations, glycolytic and gluconeogenic carbon flux, and fructose 2,6-bisphosphate concentration. Plant physiology 91: 1436–1444.
Beauvoit B, Belouah I, Bertin N, Cakpo CB, Colombié S, Dai Z, Gautier H, Génard M, Moing A, Roch L, Vercambre G, Gibon Y 2018. Putting primary metabolism into
perspective to obtain better fruits, Annals of Botany 122 (1): 1–21.
Bertin N, Causse M, Brunel B, Tricon D, Génard M. 2009. Identification of growth
processes involved in QTLs for tomato fruit size and composition. Journal of Experimental
Botany 60: 237–248. 655 660 665 670 675
Bertin N, Génard M. 2018. Tomato quality as influenced by preharvest factors. Scientia Horticulturae 233: 264–276.
Berüter J. 1985. Sugar Accumulation and Changes in the Activities of Related Enzymes
during Development of the Apple Fruit. Journal of Plant Physiology 121: 331–341.
Biais B, Benard C, Beauvoit B, Colombié S, Prodhomme D, Ménard G, Bernillon S, Gehl B, Gautier H, Ballias P, Mazat JP, Sweetlove L, Génard M, Gibon Y. 2014.
Remarkable Reproducibility of Enzyme Activity Profiles in Tomato Fruits Grown under Contrasting Environments Provides a Roadmap for Studies of Fruit Metabolism. Plant
Physiology 164: 1204–1221.
Blanco MJS, Torrecillas A, León A, Amor F del. 1989. The effect of different irrigation
treatments on yield and quality of Verna lemon. Plant and Soil 302: 299–302.
Brookfield P, Murphy P, Harker R, MacRae E. 1997. Starch degradation and starch
pattern indices; interpretation and relationship to maturity. Postharvest Biology and
Technology 11: 23–30.
Colombié S, Beauvoit B, Nazaret C, Bénard C, Vercambre G, Le Gall S, Biais B, Cabasson C, Maucourt M, Bernillon S, Moing A, Dieuaide-Noubhani M, Mazat JP, Gibon Y. 2017. Respiration climacteric in tomato fruits elucidated by constraint-based
modelling. New Phytologist 213: 1726–1739.
Colombié S, Nazaret C, Bénard C, Biais B, Mengin V, Solé M, Fouillen L, Dieuaide-Noubhani M, Mazat JP, Beauvoit B, Gibon Y. 2015. Modelling central metabolic fluxes by
constraint-based optimization reveals metabolic reprogramming of developing Solanum lycopersicum (tomato) fruit. Plant Journal 81: 24–39.
Coombe BG. 1976. The development of fleshy fruits. Annual Review of Plant Physiology
27:1, 207-228 680 685 690 695 700
Crisosto CH, Crisosto G. 2005. Understanding Tree Fruit Quality Based on Consumer
Acceptance. Acta Horticulturae 712: 865–870.
Crisosto CH, Crisosto GM, Echeverria G, Puy J. 2006. Segregation of peach and nectarine
(Prunus persica (L.) Batsch) cultivars according to their organoleptic characteristics.
Postharvest Biology and Technology 39: 10–18.
Crisosto CH, Crisosto GM, Echeverria G, Puy J. 2007. Segregation of plum and pluot
cultivars according to their organoleptic characteristics. Postharvest Biology and Technology
44: 271–276.
Crisosto CH, Crisosto GM, Metheney P. 2003. Consumer acceptance of ‘ Brooks ’ and ‘
Bing ’ cherries is mainly dependent on fruit SSC and v isual skin color. Postharvest Biology
and Technology 28: 159–167.
Crisosto CH, Johnson RS, Luza JG, Crisosto GM. 1994. Irrigation Regimes Affect Fruit
Soluble Solids Concentration and Rate of Water Loss of ‘ O ’ Henry ’ Peaches. Horticultural
Science 29: 1169–1171.
Dai ZW, Léon C, Feil R, Lunn JE, Delrot S, Gomès E. 2013. Metabolic profiling reveals
coordinated switches in primary carbohydrate metabolism in grape berry (Vitis vinifera L.), a non-climacteric fleshy fruit. Journal of Experimental Botany 64: 1345–1355.
Dai ZW, Vivin P, Robert T, Milin S, Li SH, Génard M. 2009. Model-based analysis of
sugar accumulation in response to sourcesink ratio and water supply in grape (Vitis vinifera) berries. Functional Plant Biology 36: 527–540.
Dai Z, Wu H, Baldazzi V, van Leeuwen C, Bertin N, Gautier H, Wu B, Duchêne E, Gomès E, Delrot S, Lescourret F, Génard M. 2016. Inter-Species Comparative Analysis of
Components of Soluble Sugar Concentration in Fleshy Fruits. Frontiers in Plant Science 7: 649.
705
710
715
Davies JW, Cocking ECO. 1965. Changes in carbohydrates, proteins and nucleic acids
during cellular development in tomato fruit locule tissue. Planta 253: 242–253.
Deb K, Member A, Pratap A, Agarwal S, Meyarivan T. 2002. A Fast and elitist
multiobjective genetic algorithm : NSGA-II. IEEE Transactions on Evolutionary
Computation 6(2): 182–197.
Debord C, Maucourt M, Baldet P, Bernillon S, Biais B, Talon G, Ferrand C, Jacob D, Fezzy-Dumazet H, de Daruvar A, Rolin D, Moing A. 2009. Proton NMR quantitative
profiling for quality assessment of greenhouse-grown tomato fruit. Metabolomics 5: 183–198.
Defilippi BG, Dandekar AM, Kader AA. 2004. Impact of Suppression of Ethylene Action
or Biosynthesis on Flavor Metabolites in Apple ( Malus domestica Borkh) Fruits. Journal of
Agricultural and Food Chemistry 52: 5694–5701.
Desnoues E, Gibon Y, Baldazzi V, Signoret V, Génard M, Quilot-Turion B. 2014.
Profiling sugar metabolism during fruit development in a peach progeny with different fructose-to-glucose ratios. BMC plant biology 14: 336.
Dorey E, Fournier P, Léchaudel M, Tixier P. 2015. Modeling sugar content of pineapple
under agro-climatic conditions on Reunion Island. European Journal of Agronomy 73: 64-72
Dray S, Dufour A-B. 2007. The ade4 Package: Implementing the Duality Diagram for
Ecologists Stéphane. Journal of Statistical Software 22(4)
El-Otmani M, Ait-Oubahou A, Zacarías L. 2011. Citrus spp .: orange, mandarin, tangerine, clementine, grapefruit, pomelo, lemon and lime. Editor(s): Elhadi M. Yahia, In
Woodhead Publishing Series in Food Science, Technology and Nutrition, Postharvest Biology and Technology of Tropical and Subtropical Fruits, Woodhead Publishing Limited: 437-516
Famiani, F., Farinelli, D., Frioni, T., Palliotti, A., Battistelli, A., Moscatello, S., & Walker, R. P. (2016). Malate as substrate for catabolism and gluconeogenesis during
725
730
735
740
ripening in the pericarp of different grape cultivars. Biologia Plantarum, 60(1) : 155–162.
Figueroa-Torres GM, Pittman JK, Theodoropoulos C. 2017. Kinetic modelling of starch
and lipid formation during mixotrophic, nutrient-limited microalgal growth. Bioresource
Technology 241: 868–878.
Fishman S, Génard M. 1998. A biophysical model of fruit growth: Simulation of seasonal
and diurnal dynamics of mass. Plant, Cell and Environment 21: 739–752.
Gao Z, Petreikov M, Zamski E, Schaffer AA, Ec UP. 1999. Carbohydrate metabolism
during early fruit development of sweet melon ( Cucumis melo ). Physiologia Plantarum 106: 1–8.
Geigenberger P, Lerchi J, Stitt M, Sonnewald U. 1996. Phloem-specific expression of
pyrophosphatase inhibits long- distance transport of carbohydrates and amino acids in tobacco plants. Plants Cells and Environment 19: 43–55.
Génard M, Baldazzi V, Gibon Y. 2014. Metabolic studies in plant organs: don’t forget
dilution by growth. Frontiers in Plant Science 5: 1–5.
Génard M, Bertin N, Borel C, Bussières P, Gautier H, Habib R, Léchaudel M, Lecomte A, Lescourret F, Lobit P, Quilot B. 2007. Towards a virtual fruit focusing on quality:
Modelling features and potential uses. Journal of Experimental Botany 58: 917–928.
Génard M, Lescourret F, Gomez L, Habib R. 2003. Changes in fruit sugar concentrations
in response to assimilate supply , metabolism and dilution : a modeling approach applied to peach fruit ( Prunus persica ). Tree Physiology: 373–385.
Génard M, Souty M. 1996. Modeling the peach sugar contents in relation to fruit growth. Acta Horticulturae 701 II: 517–522.
Gibert O, Dufour D, Giraldo A, Sanchez T, Reynes M, Pain JP, Gonzalez A, Fernandez A, Diaz A. 2009. Differentiation between Cooking Bananas and Dessert Bananas. 1.
750
755
760
765
Morphological and Compositional Characterization of Cultivated Colombian Musaceae ( Musa sp . ) in Relation to Consumer Preferences. Journal of Agricultural Food Chemistry
57: 7857–7869.
Grechi I, Hilgert N, Génard M, Lescourret F. 2008. Assessing the Peach Fruit
Refractometric Index at Harvest with a Simple Model Based on Fruit Growth. Journal of the
American Society for Horticultural Science 133: 178–187.
Guichard S, Bertin N, Leonardi C, Gary C. 2001. Tomato fruit quality in relation to water
and carbon fluxes. Agronomie 21: 385–392.
Hall AJ, Richardson AC, Snelgar WP. 2006. Modelling fruit development in “Hayward”
kiwifruit. Acta Horticulturae 707: 41–47.
Hawker JS. 1969. Changes in the activities of enzymes concerned with sugar metabolism
during the development of grape berries. Phytochemistry 8: 9–17.
Hendriks JHM, Kolbe A, Gibon Y, Stitt M, Geigenberger P. 2003. ADP-Glucose
Pyrophosphorylase Is Activated by Posttranslational Redox-Modification in Response to Light and to Sugars in Leaves of Arabidopsis and Other Plant Species. Plant Physiology 133: 838–849.
Ho LC. 1988. Metabolism and Compartmentation of Imported Sugars in Sink Organs in
Relation to Sink Strength. Annual Review of Plant Physiology and Plant Molecular Biology
39: 355–378.
Ho LC, Hewitt JD. 1986. Fruit development. 201–239. In: J. G. Atherton and J. Rudich
(eds.), The Tomato Crop: A scientific basis for improvement. Chapman & Hall, New York.
Hubbard NL, Pharr DM, Huber SC. 1990. Sucrose Metabolism in Ripening Muskmelon
Fruit as Affected by Leaf Area. Journal of the American Society for Horticultural Science
115: 798–802. 775 780 785 790 795
Hunter JJ, Ruffner HP, Volschenk CG. 1995. Starch concentrations in grapevine leaves,
berries and roots and the effect of canopy management. South African Journal of Enology and
Viticulture 16: 35–40.
Jensen KH, Savage JA, Holbrook NM. 2013. Optimal concentration for sugar transport in
plants. Journal of the Royal Society, Interface / the Royal Society 10: 20130055.
Kader AA. 1999. Fruit maturity, ripening, and quality relationships. Acta Horticulturae 485:
203–208.
Klie S, Osorio S, Tohge T, Drincovich M, Fait A, Giovannoni J, Fernie A, Nikoloski Z. 2014. Conserved changes in the dynamics of metabolic processes during fruit development
and ripening across species. Plant physiology 164: 55–68.
Knee M. 1993. Pome fruits. Biochemistry of Fruit Ripening: 325–346.
Kobashi K, Sugaya S, Fukushima M, Iwahori S. 2002. Sugar accumulation in highbush
blueberry fruit as affected by artificial pollination with different pollen sources in relation to seed number, invertase activities and ABA content. Acta Horticulturae: 47–51.
Lalonde S, Tegeder M, Throne-Holst M, Frommer WB, Patrick JW. 2003. Phloem
loading and unloading of sugars and amino acids. Plant, Cell and Environment 26: 37–56.
Lebon G, Duchêne E, Brun O, Magné C, Clément C. 2004. Flower abscission and
inflorescence carbohydrates in sensitive and non-sensitive cultivars of grapevine. Sexual
Plant Reproduction 17: 71–79.
Lescourret F, Génard M. 2005. A virtual peach fruit model simulating changes in fruit
quality during the final stage of fruit growth. Tree physiology 25: 1303–1315.
Li S-H, Huguet J-G, Schoch PG, Orlando P. 1989. Response of peach tree growth and
cropping to soil water deficit at various phenological stages of fruit development. Journal of
Horticultural Science 64: 541–552. 800 805 810 815 820
Luengwilai K, Beckles DM. 2009. Starch Granules in Tomato Fruit Show a Complex Pattern
of Degradation. Journal of Agricultural Food Chemistry 57: 8480–8487.
Ma S, Li Y, Li X, Sui X, Zhang Z. 2018. Phloem Unloading Strategies and Mechanisms in
Crop Fruits. Journal of Plant Growth Regulation 38:494-500.
Matsui H, Yuda E, Nakagawa S. 1979. Physiological studies on the ripening of Delaware
grapes, 1: Effects of the number of leaves and changes in polysaccharides or organic acids on sugar accumulation in berries. Journal of the Japanese Society for Horticultural Science 48:4-18
Mehouachi J, Serna D, Zaragoza S, Agusti M, Talon M, Primo-Millo E. 1995. Defoliation
increases fruit abscission and reduces carbohydrate levels in developing fruits and woody tissues of Citrus unshiu. Plant Science 107: 189–197.
Mesejo C, Yuste R, Martínez-Fuentes A, Reig C, Iglesias DJ, Primo-Millo E, Agusti M. 2013. Self-pollination and parthenocarpic ability in developing ovaries of self-incompatible
Clementine mandarins (Citrus clementina). Physiologia Plantarum 148: 87–96.
Moing A, Renaud C, Gaudillère M, Raymond P, Roudeillac P, Denoyes-Rothan B. 2001.
Biochemical changes during fruit development of four strawberry cultivars. Journal of the
American Society for Horticultural Science 126: 394–403.
Moriguchi T, Abe K, Sanada T, Yamaki S. 1992. Levels and role of Sucrose Synthase,
Sucrose-phosphate Synthase, and Acid Invertase in sucrose accumulation in fruit of Asian pear. Journal of the American Society for Horticultural Science 117: 274–278.
Moriguchi T, Sanada T, Yamaki S. 1990. Seasonal fluctuations of some enzymes relating to
sucrose and sorbitol metabolism in peach fruit. Journal of the American Society of
Horticultural Science 115: 278–281.
Moyle R, Fairbairn DJ, Ripi J, Crowe M, Botella JR. 2005. Developing pineapple fruit has
825
830
835
a small transcriptome dominated by metallothionein. Journal of Experimental Botany 56: 101–112.
Murtagh F, Legendre P. 2014. Ward’s Hierarchical Agglomerative Clustering Method:
Which Algorithms Implement Ward’s Criterion? Journal of Classification 32: 46–62.
Nardozza S, Boldingh HL, Osorio S, Höhne M, Wohlers M, Gleave A, MacRae EA, Richardson AC, Atkinson R, Sulpice R, Fernie A, Clearwater MJ. 2013. Metabolic
analysis of kiwifruit (Actinidia deliciosa) berries from extreme genotypes reveals hallmarks for fruit starch metabolism. Journal of Experimental Botany 64: 5049–5063.
Nardozza S, Boldingh HL, Richardson AC, Costa G, Marsh H, MacRae EA, Clearwater MJ. 2010. Variation in carbon content and size in developing fruit of Actinidia deliciosa
genotypes. Functional Plant Biology 37: 545–554.
Ng P, Maechler M. 2007. A fast and efficient implementation of qualitatively constrained
quantile smoothing splines. Statistical Modelling 7: 315–328.
Ollat N, Gaudillere JP. 1998. The Effect of Limiting Leaf Area During Stage I of Berry
Growth on Development and Composition of Berries of Vitis vinifera L. cv. Cabernet Sauvignon. American Journal of Enology and Viticulture: 251–258.
Ollat N, Geny L, Soyer P. 1998. Grapevine fruiting cuttings: validation of an experimental
system to study grapevine physiology. I. Main vegetative characteristics. Journal
International des sciences de la vigne et du vin 32: 1–9.
Petreikov M, Yeselson L, Shen S, Levin I, Schaffer AA, Efrati A, Bar M. 2009.
Carbohydrate balance and accumulation during development of near-isogenic tomato lines differing in the AGPase-L1 allele. Journal of American Society of Horticulture Science 134: 134–140.
Prabha N, Bhagyalakshmi N. 1998. Carbohydrate Metabolism in Ripening Banana Fruit.
845
850
855
860
Phytochemistry 37: 804–808.
Prudent M, Lecomte A, Bouchet J, Bertin N, Causse M, Génard M. 2011. Combining
ecophysiological modelling and quantitative trait locus analysis to identify key elementary processes underlying tomato fruit sugar concentration. Journal of Experimental Botany 62: 907–919.
Quilot B, Génard M, Kervella J, Lescourret F. 2004. Analysis of genotypic variation in
fruit flesh total sugar content via an ecophysiological model applied to peach. Theoretical
Applied Genetics 109: 440–449.
Richardson AC, Mcaneney KJ, Dawson TE. 1997. Carbohydrate dynamics in kiwifruit. Journal of Horticultural Science 72: 907–917.
Robinson NL, Hewitt JD, Bennett AB. 1988. Sink Metabolism in Tomato Fruit 1.
Developmental changes in carbohydrate metabolizing enzymes Plant Physiology 87: 727– 730.
Rosa JT. 1928. Change in composition during ripening and storage of melons. Hilgardia 3:421-443
Sadras VO, Collins M, Soar CJ. 2008. Modelling variety-dependent dynamics of soluble
solids and water in berries of Vitis vinifera. Australian Journal of Grape and Wine Research
14: 250–259.
Saraiva LDA, Castelan FP, Shitakubo R, Hassimotto NMA, Purgatto E, Chillet M, Cordenunsi BR. 2013. Black leaf streak disease affects starch metabolism in banana fruit. Journal of Agricultural and Food Chemistry 61: 5582–5589.
Schaffer AA, Petreikov M, Miron D, Fogelman M, Spiegelman M, Bnei-Moshe Z, Shen S, Granot D, Hadas R, Dai N, Bar M, Friedman M, Pilowsky M, Gilboa N, Chen L. 1999. Modification of carbohydrate content in developing tomato fruit. HortScience 34:
870
875
880
885