HAL Id: hal-01911062
https://hal.archives-ouvertes.fr/hal-01911062
Submitted on 27 Aug 2020
HAL is a multi-disciplinary open access
L’archive ouverte pluridisciplinaire HAL, est
Erosion of the chronic myeloid leukaemia stem cell pool
by PPARγ agonists
Stéphane Prost, Francis Relouzat, Marc Spentchian, Yasmine Ouzegdouh,
Joseph Saliba, Gérald Massonnet, Jean-Paul Beressi, Els Verhoeyen, Victoria
Raggueneau, Benjamin Maneglier, et al.
To cite this version:
Stéphane Prost, Francis Relouzat, Marc Spentchian, Yasmine Ouzegdouh, Joseph Saliba, et al..
Ero-sion of the chronic myeloid leukaemia stem cell pool by PPARγ agonists. Nature, Nature Publishing
Group, 2015, 525 (7569), pp.380-383. �10.1038/nature15248�. �hal-01911062�
Erosion of the chronic myeloid leukaemia
stem cell pool by PPARc agonists
Ste´phane Prost
1, Francis Relouzat
1, Marc Spentchian
2, Yasmine Ouzegdouh
1, Joseph Saliba
1, Ge´rald Massonnet
3,
Jean-Paul Beressi
4, Els Verhoeyen
5,6, Victoria Raggueneau
7, Benjamin Maneglier
8, Sylvie Castaigne
9, Christine Chomienne
3,
Stany Chre´tien
1,10*, Philippe Rousselot
3,9*
& Philippe Leboulch
1,11,12*
Whether cancer is maintained by a small number of stem cells or is
composed of proliferating cells with approximate phenotypic
equi-valency is a central question in cancer biology
1. In the stem cell
hypothesis, relapse after treatment may occur by failure to
erad-icate cancer stem cells. Chronic myeloid leukaemia (CML) is
quint-essential to this hypothesis. CML is a myeloproliferative disorder
that results from dysregulated tyrosine kinase activity of the fusion
oncoprotein BCR–ABL
2. During the chronic phase, this sole genetic
abnormality (chromosomal translocation Ph
1: t(9;22)(q34;q11)) at
the stem cell level causes increased proliferation of myeloid cells
without loss of their capacity to differentiate. Without treatment,
most patients progress to the blast phase when additional oncogenic
mutations result in a fatal acute leukaemia made of proliferating
immature cells. Imatinib mesylate and other tyrosine kinase
inhibi-tors (TKIs) that target the kinase activity of BCR–ABL have
improved patient survival markedly. However, fewer than 10% of
patients reach the stage of complete molecular response (CMR),
defined as the point when
BCR-ABL
transcripts become
undetect-able in blood cells
3. Failure to reach CMR results from the inability
of TKIs to eradicate quiescent CML leukaemia stem cells (LSCs)
2–4.
Here we show that the residual CML LSC pool can be gradually
purged by the glitazones, antidiabetic drugs that are agonists of
peroxisome proliferator-activated receptor-c (PPARc). We found
that activation of PPARc by the glitazones decreases expression of
STAT5 and its downstream targets HIF2a
5and CITED2
6, which are
key guardians of the quiescence and stemness of CML LSCs. When
pioglitazone was given temporarily to three CML patients in chronic
residual disease in spite of continuous treatment with imatinib, all of
them achieved sustained CMR, up to 4.7 years after withdrawal of
pioglitazone. This suggests that clinically relevant cancer eradication
may become a generally attainable goal by combination therapy that
erodes the cancer stem cell pool.
Cell division tracking with carboxyfluorescein
diacetate-succinimi-dyl ester (CFSE) indicates that non-cycling CML cells are poorly
sens-itive to TKIs
7,8and that the quiescent TKI-resistant subpopulation is
enriched in CD34
138
2cells
9. CML LSCs are hence similar to normal
quiescent haematopoietic stem cells (HSCs), although they are
cyto-kine-independent
7. Because failure to reach CMR occurs even when
BCR–ABL remains sensitive to TKIs
2, we searched for possible
‘non-oncogene addiction (NOA)’ of CML LSCs as a novel therapeutic target.
NOA indicates that a given malignant cell is abnormally sensitive to
quantitative variations in an otherwise normal molecular pathway
10.
We previously reported that the Nef proteins of the
immuno-deficiency viruses impair haematopoiesis by activating peroxisome
proliferator-activated receptor gamma (PPARc)
11. This effect was
reproduced by the thiazolidinediones, a class of synthetic PPARc ligands
(Extended Data Fig. 1a), although it is compensated in individuals with
otherwise normal haematopoiesis
12. We then became intrigued with our
observation that the CML cell line K562 is particularly sensitive to Nef
and thiazolidinediones
11. The involvement of PPARc was also more
recently reported in haematopoietic stress response
13.
We turned to a cohort of 29 chronic phase (CP) CML patients at
diagnosis whose CD34
1cells were .95% Ph
1. Combining imatinib
and pioglitazone showed evidence of synergy with a decrease in the
number of colony-forming cells (CFC) sixfold more pronounced
(P , 0.0001) than with imatinib alone (Extended Data Fig. 2a). A
similar trend was observed when normal CD34
1cells were transduced
with a lentiviral vector expressing p210 BCR–ABL (Extended Data
Fig. 2b). Whereas imatinib alone was unable to reduce significantly
the frequency of CP-CML long term culture-initiating cells (LTC-ICs)
(P 5 0.067), we found that pioglitazone was able to do so, either as a
single agent by 2.4-fold (P 5 0.008) or with an improved effect by
3.5-fold in the presence of imatinib (P , 0.001) (Fig. 1a, b). Similar results
were obtained with the second generation TKI dasatinib or with
another thiazolidinedione, rosiglitazone (Extended Data Fig. 2c, d).
CFSE assays were then performed with CP-CML CD34
1cells in the
absence of cytokines (Fig. 1c–e and Extended Data Table 1). Untreated
control CP-CML CD34
1cells proliferated and differentiated actively.
Imatinib exposure resulted in the elimination of actively dividing cells
but also in the accumulation of viable CFSE-bright CD34
1cells that
never divided (‘P’) or had divided only once (Fig. 1d). Pioglitazone
alone was less effective than imatinib to deplete the bulk of dividing
CML cells but triggered exit from quiescence (Fig. 1c–e and
Extended Data Table 1). Combining pioglitazone with either imatinib
or dasatinib acted in synergy to deplete both proliferating and
non-proliferating cells (Fig. 1c–e, Extended Data Table 1 and Extended
Data Fig. 2e). Imatinib alone was effective at decreasing the number
of Ph
1CD34
1CD38
1progenitors but failed to reduce the more
immature CD34
1CD38
2population, opposite to pioglitazone alone
(Extended Data Fig. 3b).
We then investigated the possible molecular pathways that mediate
pioglitazone activity against CML LSCs. We previously reported that
PPARc is a negative transcriptional regulator of STAT5 (A and B)
11.
STAT5 is known to be critical for maintenance and fitness of both
normal HSCs
14and CML cells, where STAT5 is activated upon direct
phosphorylation by the BCR–ABL kinase
15. STAT5 expression levels
were abnormally high in both total CP-CML CD34
1cells and
qui-escent LSC (Fig. 2a). In CFSE-bright cells (that is, P and 1 division of
*These authors contributed equally to this work.
1CEA, Institute of Emerging Diseases and Innovative Therapies (iMETI), F-92265 Fontenay-aux-Roses, France.2De´partement de biologie me´dicale, Hoˆpital Mignot, F-78150 Le Chesnay, France.3Unite´ de
Biologie Cellulaire, UMR-S-940 Institut Universitaire d’He´matologie, Hoˆpital Saint Louis, F-75010 Paris, France.4Service d’Endocrinologie et de Diabe´tologie, Hoˆpital Mignot, F-78150 Le Chesnay, France. 5CIRI, International Center for Infectiology Research, EVIR team, Inserm, U1111, CNRS, UMR5308, Universite´ de Lyon-1, ENS de Lyon, 69007 Lyon, France.6Inserm, U895, Centre de Me´decine
Mole´culaire (C3M), e´quipe 3, 06204 Nice, France.7Laboratoire d’he´matologie, Centre Hospitalier de Versailles, F-78150 Le Chesnay, France.8Unite´ de Pharmacologie, Service de Biologie Me´dicale, Centre
Hospitalier de Versailles, F-78150 Le Chesnay, France.9Service d’He´matologie et d’Oncologie, Hoˆpital Mignot, Universite´ Versailles Saint-Quentin-en-Yvelines, F-78150 Le Chesnay, France.10Inserm,
Institute of Emerging Diseases and Innovative Therapies (iMETI), F-92265 Fontenay-aux-Roses, France.11Genetics Division, Brigham & Women’s Hospital and Harvard Medical School, Boston,
CP-CML CD34
1cells) purified at 14 days of culture without
cytokines, STAT5B messenger RNA levels decreased by 8.5-fold
(P , 0.0001), 1.5-fold (P 5 0.08) and 10.5-fold (P , 0.0001) in the
presence of pioglitazone, imatinib and the drug combination,
respect-ively (Fig. 2a). Similar values were obtained for STAT5A (not shown).
We then compared mRNA levels of four known STAT5 targets
genes. Addition of pioglitazone to imatinib significantly reduced
expression of BCL2L1 (also known as BCL-X
L)
16(3.3-fold), BCL2
16(4.8-fold), PIM1
17(1.6-fold) and CISH (also known as CIS)
18(1.6-fold),
thus suggesting that imatinib alone is not able to inhibit STAT5
transcriptional activity to completion (Fig. 2b). Supplementary studies
with the bromodomain inhibitor JQ1
19confirmed the pivotal role
played by STAT5 in CML LSCs (Supplementary Data and Extended
Data Fig. 2f).
The effect of pioglitazone was negated by a short interfering RNA
against PPARc (also known as PPARG) mRNA (Fig. 2c and control
Extended Data Fig. 1b, c). Decreased clonogenicity of CP-CML
1
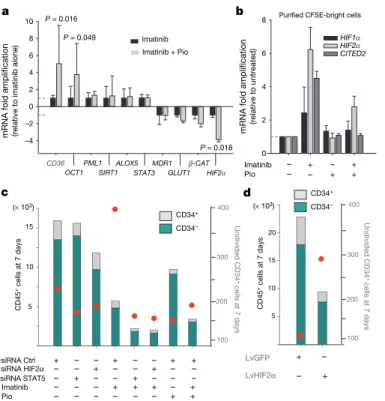
We then examined, in 7-day cultures without cytokines of CP-CML
CD34
1cells from 11 patients, mRNA expression levels for 9 putative
downstream transcriptional targets of STAT5 and/or PPARc (Fig. 3a).
These included OCT1 (also known as POU2F1)
20, PML, SIRT1,
ALOX5, STAT3, MDR1 (also known as ABCB1), GLUT1 (also known
as SLC2A1), b-catenin (also known as CTNNB1) and HIF2a (also
known as EPAS1)
17. CD36, known to be upregulated by PPARc
ago-nists, was used as a positive control
21. Only OCT1 and HIF2a
express-ion levels were significantly altered after culture in the presence of
pioglitazone 1 imatinib versus imatinib alone (Fig. 3a). Although
upregulation of OCT1 expression may increase the cellular uptake of
imatinib
20, we found that erosion of the CP-CML LSC pool was not
improved in the presence of imatinib alone when OCT1 was
over-expressed by lentiviral transfer (Extended Data Fig. 6).
In contrast to OCT1, HIF2a was downregulated by pioglitazone
(Fig. 3a). Importantly, HIF2a and to a lesser degree HIF1a were found
upregulated in imatinib-resistant CFSE-bright cells (P and 1 cell
divi-sion), while pioglitazone counteracted this phenomenon (Fig. 3b).
LTC-IC Frequencies CI Untreated 1/303 (1/244 to 1/376) Imatinib 1/495 (1/386 to 1/635) Pio 1/715 (1/537 to 1/950) Imatinib + Pio 1/1,052 (1/753 to 1/2,026) LTC-IC (LDA) a b 0 50 100 150 200 250 300 20 40 60 80 10 100 Untreated Pio Imatinib Imatinib + Pio Negative wells (%) 10 30 50 70 0 20 40 60 80 c d Untreated Imatinib + Pio P Number of CD34
+ cells at 14 days of culture
e Undivided CD34 + cells at 14 days Imatinib + Pio D3 D7 D14 D3 D7 D14 D3 D7 D14 D3 D7 D14
Untreated Imatinib Pio
0 (× 103) 50 100 600 300 400 500 CD34+ CD34– -CD45 + cells at 14 days Imatinib Pio
Number of mitosis (CFSE)
CI, 95% confidence interval
No. of Ph+CD34+ seeded per well
8 7 6 5 4 3 2 1 Untreated 0 0 0.3 4.3 23 33 25.6 9.8 3.4 Imatinib 0 0 0.7 6.2 13 26 20 23 13 Pio 0.1 2.5 16 27 25 16 7.9 3 1.1 Imatinib + Pio 0 0 0.3 5.23 24 33 26 6.5 2.9
Cell division numbers
CD34+ cells distribution at 14 days (%) P
40 80 120 160 200
Figure 1
|
Pioglitazone purges quiescent CML stem cells. a, Limited dilutionanalysis (LDA) of CML LSCs by LTC-IC assay. Pio, pioglitazone. b, LTC-IC frequencies calculated from a (n 5 4). c, CFSE analysis (patient 4) after liquid culture in serum-free medium without cytokines. P (red), colcemid arrested
‘parent-cells’. d, Distribution (%) of CD341cells in each mitosis peak shown in
c. e, Identical culture conditions as in c, but for patient 2. Left scale (black) and histograms show cell counts. Right scale (red) and red dots and lines show
the number of undivided CD341
cells (P in CFSE assay). Also see Extended Data Table 1 (n 5 6). See statistics in Methods.
0 1 2 3 4 * * * * Imatinib Imatinib + Pio BCLx BCL2 PIM1 CIS 0 50 100 150 200 250 CFC numbers Pio – – + + – + – + + – + – LvSTAT5 0 20 CD45 + cells at 10 days LvSTAT5 Pio LvGFP CD34+ CD34– 250 0 50 100 150 200 5 1 + + – + – + – – + Undivided CD34 + cells at 10 days 10 LvGFP P = 0.0047 0 20 40 60 80 100 120 d e 30 (× 103) 0 20 40 60 80 100 Pio Imatinib – + + + + – STAT5B mRNA (% of untreated ) P < 0.0001 a Purified CFSE-bright cells Pio siPPARγ – + + – * STAT5B mRNA (% of untreated) + + c b
mRNA expression after imatinib ± Pio treatment
Figure 2
|
Pioglitazone targets the PPARc–STAT5 pathway in CML LSCs.a, Normalized STAT5B quantitative PCR with reverse transcription (RT–qPCR) on CFSE-bright cells (that is, P and 1 division) at 14 days of culture. b, Percent mRNA expression of STAT5 target genes in CFSE bright cells
after drug exposure. c, CP-CML CD341
cells cultured with an anti-PPARc siRNA before RT–qPCR. d, Colony-forming cell (CFC) assays with CP-CML
CD341cells after transduction with enhanced green fluorescent
protein-(eGFP; negative control) or a STAT5B-expressing lentivectors (Lv). e, Absolute cell count together with CFSE analysis (patient 2 in triplicate). Red dots,
undivided CD341
cells (P in CFSE assay). Data show means 6 s.d., n 5 5. See statistics in Methods.
Data Fig. 8a, b). Because CITED2 is a known master gene of HSC
quiescence that regulates stemness-associated genes such as BMI1
22,
HES1
23and p57 (also known as CDKN1C)
23, we studied the expression
of these genes in CD34
1cells from CP-CML patients and in murine Ba/
F3 cell lines we generated to express, by means of retroviral vector
transduction and ubiquitous promoter driven expression, the
consti-tutively active forms of murine Stat5a or Stat5b 1*6 (H299R, S711F).
After 10 days of culture in the presence of imatinib, TKI-resistant
CD34
1cells from CP-CML patients showed an increase in endogenous
expression of both CITED2 itself (4.5-fold) and the known CITED2
target genes BMI1 (2.8-fold), HES1 (3.1-fold) and p57 (16.5-fold).
Addition of pioglitazone fully counteracted said increase in CITED2,
BMI1 and HES1 expression and reduced the increase in p57 expression
by fourfold (Extended Data Fig. 9a). Ba/F3 cell studies corroborated this
evidence (Extended Data Fig. 9b and c). Taken together, we propose
here that the CML-LSC is critically dependent (NOA) on a PPARc–
STAT5–HIF2a–CITED2 pathway, directly and effectively inhibited by
pioglitazone (Fig. 4a), thus extending the contention that equivalent
murine leukaemias are addicted (NOA) to STAT5 (ref. 15).
Because mouse models are poorly suited to investigate CML LSCs
24and pioglitazone is an approved drug for the treatment of diabetes
mellitus type 2 in humans, we initially sought to validate pioglitazone
directly on two patients diagnosed with both diabetes and CML who
never reached CMR in spite of long-term imatinib treatment. Before
filing a formal clinical trial application, we prescribed pioglitazone
off-label and under approved informed consent to a third CML patient,
this time non-diabetic, who never reached CMR either under
long-term imatinib therapy (Fig. 4b).
Pioglitazone was added to the treatment after 5, 6 and 4 years of
uninterrupted imatinib therapy for patients 1, 2 and 3, respectively.
None of the 3 patients ever reached CMR before introduction of
pioglitazone. Pioglitazone was added to the treatment of patient 1
during two brief exposures of 10 and 8 months each with an interval
of 28 months (Fig. 4b). CMR was achieved 10 months after initial
pioglitazone addition, and patient 1 has remained in CMR for at least
56 months, the last time-point collected for this study, which is 53
months (4.5 years) after first stopping pioglitazone administration
(Fig. 4b). For patient 2, CMR was obtained after 1 year of pioglitazone
addition and maintained for 32 months at which time they withdrew
(Fig. 4b). For patient 3, CMR was achieved after 6 months of
piogli-tazone addition. At this time point, the level of STAT5 mRNA in
CD34
1cells from the bone marrow of patient 3 was decreased by
11.9 fold. Patient 3 has remained in CMR for at least 38 months, the
last time-point collected for this study, which is 28 months after
stop-ping pioglitazone administration (Fig. 4b). Furthermore, patient 3
decided to stop imatinib for the last 6 months of the aforementioned
observation period and has remained in CMR during this period
with-out any treatment (Fig. 4b and Supplementary Data).
Regulatory approval was then obtained for multi-centre Phase II
clinical trials, and the first (EudraCT 2009-011675-79) aimed at
assessing the short-term cumulative incidence of CMR conversion
0 2 4 6 8 –4 –2 0 2 4 6 8 10 P = 0.049 P = 0.016 CD36
OCT1PML1SIRT1ALOX5STAT3MDR1GLUT1β-CATHIF2α P = 0.018
mRNA fold amplification (relative to imatinib alone)
Pio Imatinib – + + + + – –
mRNA fold amplification
(relative to untreated) – HIF2α HIF1α a b CITED2 Purified CFSE-bright cells Imatinib Imatinib + Pio Imatinib – – – + + + – + siRNA Ctrl + – – + – – + + siRNA STAT5 – + – – + – – – siRNA HIF2α – – + – – + – – Pio – – – – – – + + CD45 + cells at 7 days 5 10 15 (× 103) 100 200 300 400 CD45 + cells at 7 days 100 200 300 400 Undivided CD34 + cells at 7 days Undivided CD34 + cells at 7 days 5 10 15 20 d (× 103) c LvGFP LvHIF2α + – – + CD34+ CD34– CD34+ CD34–
Figure 3
|
Expression of target genes in CP-CML cells exposed topioglitazone and imatinib. a, RT–qPCR assays on CP-CML CD341
cells after 7 days without serum or cytokines. Data show means 1s.d., n 5 11. b, RT– qPCR assays in purified 12–14 days CFSE-bright cells (that is, P and 1 division). Data show means 1s.d., n 5 6. c, Absolute cell count together with CFSE analysis of representative CP-CML patient 8 (triplicate). Undivided cells (red dots). Also see Extended Data Fig. 7 and Extended Data Fig. 1c. d, Same as in
c, but after transduction of cord blood CD341
cells with lentivectors (Lv) (triplicate). Undivided cells (red dots). See statistics in Methods.
a –30 –20 –10 0 10 20 30 40 50 60 Patient 1 Patient 2 Patient 3 b Months 0.1% 0.01% CMR4.5 BCR-A BL/ A BL mRNA ( IS) Imatinib Pioglitazone Imatinib Imatinib (Stop imatinib 6 months) Imatinib Pio PPARγ Normoxia Normoxia I I+P I I+P Hypoxia BCR-ABL STAT5 HIF2α CITED 2 HIF2α CITED 2 Medullary vascular sinus CML LSC Quiescence Quiescence in niche Self renewal and/or
differentiation pO2 Normal HSC Phospho-ST A T5 CML ‘bulk’ CML LSC
Figure 4
|
Pioglitazone induces complete and sustained molecular response(CMR) in CML patients. a, Model of CML LSC addiction to the PPARc– STAT5–HIF2a pathway. (Top insert) for the bulk of dividing CML cells, imatinib (I) alone is able to bring phopho-STAT5 levels below a threshold (dotted line) at which apoptosis occurs (cross). For CML LSCs, only the combination of imatinib and pioglitazone (I1P) is able to bring cells below a threshold at which cells leave their state of quiescence before undergoing apoptosis. b, RT–qPCR assays for BCR-ABL/ABL on nucleated blood cells from the first three patients. See Supplementary Information for details.
for patients who never reached CMR under imatinib alone (https://
www.clinicaltrialsregister.eu/ctr-search/trial/2009-011675-79/FR#E).
Scoring by quantitative PCR was performed over the course of the first
12 months after trial initiation during concurrent and brief exposure
(3 to 12 months) to the imatinib-pioglitazone combination
25. Out of
24 assessable patients, the cumulative incidence rate in the treated
group reached 57% versus 27% (P 5 0.02) for an historical group of
patients having received imatinib alone, thus indicating that clinical
evidence of efficacy can already be detected even after very brief
treatment and early analysis. Post-trial follow-up confirmed stability
of CMR status in data collected to date. Therapy with pioglitazone was
accompanied by a stable reduction of STAT5 mRNA in patient
sam-ples as early as month 6 (2.3-fold, P 5 0.0003) and by a reduction of
the clonogenic potential of bone marrow CD34
1cells (1.54-fold,
P 5 0.0003).
Although both imatinib and pioglitazone decrease STAT5 activity,
they act by different mechanisms. Imatinib inhibits STAT5
activa-tion by BCR–ABL phosphorylaactiva-tion, whereas pioglitazone decreases
STAT5 expression. It seems that imatinib alone is sufficient to induce
effective clearance of the bulk of more differentiated CML cells, but
fails to bring STAT5 activity below a threshold for CML LSC to exit
from quiescence and to undergo subsequent apoptosis. Pioglitazone is
effective at doing so in synergy with imatinib (Fig. 4a, top insert). As in
this example with CML, progressive erosion of cancer stem cell pools
may prove ultimately achievable pharmacologically, bringing hope of
obtaining cancer eradication in a variety of human malignancies by
combination therapy.
Online Content Methods, along with any additional Extended Data display items and Source Data, are available in the online version of the paper; references unique to these sections appear only in the online paper.
Received 17 March 2014; accepted 28 July 2015. Published online 2 September 2015.
1. Nguyen, L. V., Vanner, R., Dirks, P. & Eaves, C. J. Cancer stem cells: an evolving concept. Nature Rev. Cancer12, 133–143 (2012).
2. Chomel, J. C. & Turhan, A. G. Chronic myeloid leukemia stem cells in the era of targeted therapies: resistance, persistence and long-term dormancy. Oncotarget 2, 713–727 (2011).
3. de Lavallade, H. et al. Imatinib for newly diagnosed patients with chronic myeloid leukemia: incidence of sustained responses in an intention-to-treat analysis. J. Clin. Oncol.26, 3358–3363 (2008).
4. Corbin, A. S. et al. Human chronic myeloid leukemia stem cells are insensitive to imatinib despite inhibition of BCR-ABL activity. J. Clin. Invest.121, 396–409 (2011). 5. Hu, C. J., Sataur, A., Wang, L., Chen, H. & Simon, M. C. The N-terminal
transactivation domain confers target gene specificity of hypoxia-inducible factors HIF-1a and HIF-2a. Mol. Biol. Cell18, 4528–4542 (2007).
6. Du, J. & Yang, Y. C. Cited2 in hematopoietic stem cell function. Curr. Opin. Hematol. 20, 301–307 (2013).
7. Graham, S. M. et al. Primitive, quiescent, Philadelphia-positive stem cells from patients with chronic myeloid leukemia are insensitive to STI571 in vitro. Blood99, 319–325 (2002).
8. Jørgensen, H. G., Allan, E. K., Jordanides, N. E., Mountford, J. C. & Holyoake, T. L. Nilotinib exerts equipotent antiproliferative effects to imatinib and does not induce apoptosis in CD341
CML cells. Blood109, 4016–4019 (2007).
9. Copland, M. et al. Dasatinib (BMS-354825) targets an earlier progenitor population than imatinib in primary CML but does not eliminate the quiescent fraction. Blood107, 4532–4539 (2006).
10. Luo, J., Solimini, N. L. & Elledge, S. J. Principles of cancer therapy: oncogene and non-oncogene addiction. Cell136, 823–837 (2009).
11. Prost, S. et al. Human and simian immunodeficiency viruses deregulate early hematopoiesis through a Nef/PPARc/STAT5 signaling pathway in macaques. J. Clin. Invest.118, 1765–1775 (2008).
12. Berria, R. et al. Reduction in hematocrit and hemoglobin following pioglitazone treatment is not hemodilutional in Type II diabetes mellitus. Clin. Pharmacol. Ther. 82, 275–281 (2007).
13. Avagyan, S., Aguilo, F., Kamezaki, K. & Snoeck, H. W. Quantitative trait mapping reveals a regulatory axis involving peroxisome proliferator-activated receptors, PRDM16, transforming growth factor-b2 and FLT3 in hematopoiesis. Blood118, 6078–6086 (2011).
14. Wang, Z., Li, G., Tse, W. & Bunting, K. D. Conditional deletion of STAT5 in adult mouse hematopoietic stem cells causes loss of quiescence and permits efficient nonablative stem cell replacement. Blood113, 4856–4865 (2009).
15. Hoelbl, A. et al. Stat5 is indispensable for the maintenance of bcr/abl-positive leukaemia. EMBO Mol. Med.2, 98–110 (2010).
16. Kieslinger, M. et al. Antiapoptotic activity of Stat5 required during terminal stages of myeloid differentiation. Genes Dev.14, 232–244 (2000).
17. Fatrai, S., Wierenga, A. T., Daenen, S. M., Vellenga, E. & Schuringa, J. J. Identification of HIF2a as an important STAT5 target gene in human hematopoietic stem cells. Blood117, 3320–3330 (2011).
18. Matsumoto, A. et al. CIS, a cytokine inducible SH2 protein, is a target of the JAK-STAT5 pathway and modulates JAK-STAT5 activation. Blood89, 3148–3154 (1997). 19. Liu, S. et al. Targeting STAT5 in hematologic malignancies through inhibition of the bromodomain and extra-terminal (BET) bromodomain protein BRD2. Mol. Cancer Ther.13, 1194–1205 (2014).
20. Wang, L., Giannoudis, A., Austin, G. & Clark, R. E. Peroxisome proliferator-activated receptor activation increases imatinib uptake and killing of chronic myeloid leukemia cells. Exp. Hematol.40, 811–819 (2012).
21. Szanto, A. & Nagy, L. Retinoids potentiate peroxisome proliferator-activated receptor gamma action in differentiation, gene expression, and lipid metabolic processes in developing myeloid cells. Mol. Pharmacol.67, 1935–1943 (2005). 22. Chen, Y., Haviernik, P., Bunting, K. D. & Yang, Y. C. Cited2 is required for normal
hematopoiesis in the murine fetal liver. Blood110, 2889–2898 (2007). 23. Du, J. et al. HIF-1a deletion partially rescues defects of hematopoietic stem cell
quiescence caused by Cited2 deficiency. Blood119, 2789–2798 (2012). 24. Koschmieder, S. & Schemionek, M. Mouse models as tools to understand and
study BCR-ABL1 diseases. Am. J. Blood Res.1, 65–75 (2011).
25. Rousselot, P. et al. Targeting STAT5 expression resulted in molecular response improvement in patients with chronic phase CML treated with imatinib. ASH Annual Meeting Abstracts, (2012).
Supplementary Information is available in the online version of the paper. Acknowledgements We thank C. Costa, V. Tran Chau, F. Goullieux, A. Krief, P. Raynal, C. Terre´, S. Tabore and T. Andrieu for their experimental contributions. This work was supported by the Association Laurette Fugain, Paris, France, by the Association pour la Recherche sur le Cancer, Villejuif, France to S.P., P.R. and P.L. and by the Chaire industrielle de l’Agence Nationale pour la Recherche (ANR) to P.L.
Author Contributions S.P. lead the project, designed and performed experiments, and analysed data. P.L. and S.Ch. designed experiments and analysed data. P.L. wrote the paper. F.R., M.S., Y.O., J.S., E.V., V.R., B.M. and G.M. contributed experimentally. P.R., J.-P.B., C.C. and S.Ca. contributed clinically. P.R., S.Ch. and P.L. have contributed equally to this work; P.R. in a clinical capacity, S.C. and P.L. in a scientific capacity.
Author Information Reprints and permissions information is available at www.nature.com/reprints. The authors declare no competing financial interests. Readers are welcome to comment on the online version of the paper. Correspondence and requests for materials should be addressed to S.P. (stephane.prost@cea.fr) and P.L. (pleboulch@rics.bwh.harvard.edu).
METHODS
Reagents. For in vitro assays, PPARc agonists were provided by Cayman
Chemical (PPARc-PAK; Bertin-pharma). Imatinib mesylate was provided by Novartis and was used at 1 mM in culture, a well-established inhibitory concen-tration in vitro that also approaches the achievable drug level in patients’ plasma. Dasatinib and JQ1 were provided by Bristol-Myers Squibb and Sigma and were used in culture at 0.146 mM and 1 mM, respectively. Murine pro-B cell line Ba/F3 and human chronic myelogenous leukaemia cell line K562 were provided by the American Type Culture Collection (ATCC; Ref. CRL-12015 and CCL-243, respectively). These cell lines were tested for mycoplasma contamination every 3 months using Venor Gem Advance Pre-aliquoted Mycoplasma Detection Kit (Minerva biolabs).
Cell culture and proliferation assays.CD341
cells from patients in CP-CML at diagnosis or umbilical cord blood were immunoselected (CD34 microBead Kit, Miltenyi Biotec) according to the manufacturer’s instructions. Enrichment for
CD341cells was ascertained by flow cytometry using an anti-CD34 monoclonal
antibody (clone 581; BD Pharmingen). Ph11-CD341cells were cultured in serum
free medium (SFM) StemSpan (StemCell Technologies) without growth factors. Colony forming cell (CFC) and long term culture-initiating cell (LTC-IC)
assays.For CFC assays, CD341cells were suspended (1 3 104) in 3 ml of
alpha-MEM based methylcellulose medium (GF H4434, StemCell Technologies). Cells
were scored and collected after 14 days incubation at 37uC and 5% CO2. After
scoring, colonies were washed with PBS and kept frozen in RNAlater (Invitrogen) for subsequent analysis. LTC-IC with limiting dilution assays (LDA) were per-formed in StemSpan SFM (Stemcell technologies) on irradiated MS5 monolayers
at several dilutions of CD341cells (300, 150, 75, or 37 cells per well for Ph11
CD341
cells and 200, 100, 50, or 25 cells per well for CD341
from healthy donors) in 96-well plates with 16 replicate wells per concentration. After five weeks with weekly change of one half medium volume, all cells were transferred in alpha-MEM based methylcellulose medium (GF H4434, Stemcell technologies) to determine the total clonogenic cell content of each LTC. LTC-IC frequencies were determined using the L-Calc software (Stemcell technologies).
Flow cytometry.The following antibodies were used: fluorescein isothiocyanate
(FITC)-conjugated IgG1 (clone 679.1Mc7, Beckman Coulter), Alexa Fluor 488-conjugated-IgG1 (clone MOPC-21, BD Pharmingen), allophycocyanin (APC)-IgG1 (clone MOPC-21, BD Pharmingen), peridinin chlorophyll protein–cyanin 5.5 (PerCP–Cy5.5)-conjugated IgG1 (clone X40, BD Pharmingen), phycoerythrin cyanin (PE–Cy7)-conjugated IgG1 (clone MOPC-21, BD Pharmingen), (PerCP– Cy5.5)-conjugate CD45 (clone 2D1, BD Pharmingen), (APC)-conjugated CD34 (clone 581, BD Pharmingen), (PE–Cy7)-conjugated CD38 (clone HB7, BD Pharmingen), Alexa Fluor 488-conjugated anti-STAT5 (pY694) (clone 47, BD Pharmingen), (PE)-conjugated anti-GLUT1 (FAB1418P, R&D systems). For all experiments, cell viability was assessed using SYTOX Blue dead cell stain (Invitrogen Life Technologies).
Intracellular STAT5 phosphorylation assays.In brief, 3 3 105K562 cells per ml
cultured in complete Dulbecco’s modified Eagle medium supplemented with 10% fetal calf serum (PAA) alone and with or without pioglitazone (10 mM) or imatinib
(1 mM) at 37uC in 5% CO2were harvested at variable time as indicated. Cells were
fixed and permeabilized using Cytofix/Cytoperm kit (BD Pharmingen) and stained with Alexa Fluor 488-anti-phospho-STAT5 monoclonal antibody (BD Phosflow) or Alexa Fluor 488-isotype-matched control to obtain fluorescence minus comparative in each experiment. Analysis was carried on a minimal num-ber of 50,000 events in the viable cell gate. The delta mean fluorescence intensity of p-STAT5 after drug treatment (p-STAT5DMFI) was determined as follow: (untreated cells p-STAT5 MFI – non-treated cells isotype-control MFI) 2 (drug treated cells p-STAT5 MFI 2 drug treated cells isotype-control MFI).
CSFE assays.Fresh CD341-enriched cells were stained with 2 mM of 5- (and 6-)
carboxyfluorescein diacetate succinimidyl diester (CFSE, Invitrogen). Cells were
then cultured (seeded 5.105per ml) in SFM StemSpan (StemCell Technologies)
without growth factors and with or without pioglitazone (10 mM) or imatinib
(1 mM). Cells cultured in the presence of Colcemid (100 ng ml21, Invitrogen
Life Technologies) were used to establish the range of fluorescence exhibited by cells that had not divided during post-labelling incubation. Cells were harvested at variable time points as indicated, collected in BD Trucount tubes for absolute count (BD Biosciences) and labelled with anti-CD45 and anti-CD34. Then, cells were diluted in 1 ml of phosphate-buffered saline (PBS, Invitrogen Life Technologies) containing 2% fetal calf serum (PAA) and stained for viability. All analyses were carried out on a BD FACS Canto2 Flow Cytometer.
DNA synthesis assay.Cell proliferation rate was measured by incorporation of
5-ethynyl-29-deoxyuridine (EdU), a thymidine nucleoside analogue, in DNA dur-ing active DNA synthesis (two hours). Staindur-ing was performed accorddur-ing to the manufacturer’s protocol (Click-iT EdU Flow Cytometry Assay Kit, Invitrogen). All analyses were carried out on a BD FACS Canto2 Flow Cytometer.
RNA extraction and RT–qPCR analysis.RNA was extracted from 2 3 105cells
using RNAqueous-4PCR (Ambion). Reverse transcription was carried out for 1 h
at 42uC using SuperScript Vilo cDNA Synthesis kit (Invitrogen Life Technologies)
according to the manufacturer’s instructions. Real-time PCR was performed in an iCycler thermocycler (CFX, Bio-Rad). The primers and probes sequences for
GAPDH, STAT5B, STAT5A, BCR-ABL, ABL, HIF1a, CITED2, OCT120, MDR126,
SIRT127, STAT328, ALOX529, GLUT130, b-catenin31, PML32, HIF2a17, Bcl-XL, Bcl-2,
PIM-1, CIS19, BMI122, HES-123, p57 (CDKN1C)23, CD3621(known to be
upregu-lated by PPARc agonists, was used as a positive control) are reported in Supplementary Table 1. The primer pairs used with TaqMan Gene Expression Master mix (Applied Biosystems) and iQ Supermix SYBR GRN (Bio-Rad) are listed in Supplementary Table 1a and Supplementary Table 1b, respectively. The
comparative CTmethod (DDCT) was used to compare gene expression levels
between the different culture conditions (relative to GAPDH).
BCR-ABL/ABLquantification.qPCR experiments were performed on cDNA
using the 7000 Sequence Detection System (Applied Biosystems). The BCR-ABL/ ABL ratio was determined using FusionQuant standards (Ipsogen) according to
the Europe Against Cancer protocol33. CMR is defined as undetectable minimal
residual disease (negative BCR–ABL transcripts) while showing a sensitivity level of at least 40,000 amplified copies of the ABL control gene, that is to say more than 4.5 log reduction by standardized International Scale (IS) RT–qPCR (that is,
BCR-ABL/ABLISmRNA ratio , 0.0025%); relapse from CMR is to be declared when at
least 2 consecutive positives occur 6 months apart. These criteria are consistent with the level of sensitivity routinely applied within laboratories participating in the French GBMHM Network (Group of Molecular Biologists for Hematological Malignancies).
Interphase FISH probe assay.Fluorescent in situ hybridization (FISH) was
per-formed on interphase nuclei, following standard procedures and using specific probe for the t(9;22) (MetaSystems, Germany). The probe is designed as a dual-fusion assay. The red labelled probe detects an extended region at the ABL1 locus on 9q34 and a green labelled probe hybridizes specifically to regions at the BCR gene on 22q11. Preparations were counterstained with 4,6-diamidino-phenyl-indole (DAPI) and a minimum of 50 interphase nuclei were examined. Results were recorded using a fluorescence microscope (Nikon) fitted with appropriate filters, and digital-imaging software Lucky (CaryoSystems, France).
Western blot analysis.For STAT5 protein analysis, K562 cells (2.5 3 105) were
lysed in RIPA lysis buffer on ice. Whole-cell extracts were boiled for 5 min in Laemmli sample buffer and subjected to SDS–PAGE in 4–12% acrylamide gels (Nupage, Invitrogen Life Technologies). Proteins were transferred to Hybond N1 filters (Amersham). Membranes were probed with the following antibodies: STAT5 (sc-1656), ACTIN (sc-8432), PPARc (H-100:sc-7196), goat anti-mouse IgG-HRP (sc-2005) (Santa Cruz Biotechnology Inc.) and Anti-HIF2a (SMC-185C/D). Antibody binding was detected by the enhanced chemiluminescence ECL1 (Amersham).
Lentiviral vector production and transduction.STAT5B lentiviral vector. The
cDNA encoding STAT5B was cloned, sequenced (GenBank accession number DQ267926), and inserted into the SIN-cPPT-PGK-WHV lentiviral transfer vector
as previously described34. A SIN-cPPT-PGK-eGFP-WHV lentiviral vector was
used for control.
OCT-1 and HIF2a lentiviral vectors.OCT-1 (SLC22A1, accession number
BC126364) and HIF2a (EPAS1, accession number BC051338) lentiviral vectors were provided by Applied Biological Materials, Inc. (catalogue nos LV309003 and LV149063).
Constitutively active murine Stat5a and Stat5a.Stat5a(1*6)(H299R, S711F) and
Stat5b(1*6)(H299R, S711F) retroviral vectors were provided by Cell Biolabs, Inc. (catalogue nos RTV-333 and RTV-335).
shRNA lentiviral vector anti-PPAR-c.The PPAR-c mRNA pairing sequence
59-TGTTCCGTGACAATCTGTC-39 (GenBank accession number L40904) was designed and synthesized as follows within an shRNA structure comprising unique restriction sites at each end: sense 59-GATCTCCTGTTCCGTGACA ATCTGTCTTCAAGAGAACAGATTGTCACGGAACATTTTTGGAAGAATT CC-39; antisense 59-CTGAGGAATTCTTCCAAAAATGTTCCGTGACAAT CTGTAAGTTCTCTACAGATTGTCACGGAACAGGA-39. Oligonucleotides were annealed and ligated into BglII and XhoI sites of linearized pSuper plasmid. PolIII H1 promoter-shRNA PPAR-c was then subcloned in the pTRIP lentiviral
vector. Vectors were produced as previously described34.
BCR–ABL lentiviral vector.Total RNA from K562 cells was extracted using
TRIzol (Invitrogen Life Technologies). Reverse transcription was carried out for
1 h at 50uC using SuperScript III (Invitrogen Life Technologies). Two independent
PCR were performed using BCR-ABL F 1, 59- ATGGTGGACCCGGTGGGCTT-39 with ABL R 2831, 59-CTGCTACCTCTGCACTATGTCACTG-39 and BCR-ABL F 2685, TCCGCTGACCATCAATAAGGA-39 with BCR-BCR-ABL R 6097, 59-CTGCTACCTCTGCACTATGTCACTG-39 respectively. Specific amplification
bands were pooled, heated to 95uC during 3 min and ramp cooled to 25 uC over a period of 45 min. Annealing product was submitted to a third PCR with LA Taq DNA polymerase (Takara) using the following primer pair: BCR-ABL F 1 asc1: 59-AGGCGCGCCATGGTGGACCCGGTGGGCTT-39 and BCR-ABL R 6097 sbf1: 59-CCTGCAGGCTGCTACCTCTGCACTATGTCACTG-39. Amplification pro-duct was subcloned into a pCR-XL-TOPO plasmid (Invitrogen Life Technologies) before being inserted into the SIV GAE-SSFV lentiviral transfer vector, followed by DNA sequencing. An SIV GAE-SSFV-eGFP vector was used as a control. The SIV
vectors were produced as previously described34.
CD341 cell transduction.
Cells were suspended (1 3 106ml21) in StemSpan
(StemCell Technologies, France) supplemented with protamine sulphate
(4 mg ml21), SCF (100 ng ml21), FLT-3-L (100 ng ml21), IL-3 (20 ng ml21), and
IL-6 (20 ng ml21), in a 96-well plate coated with RetroNectin (Takara Shuzo Co.,
Japan). Cell suspensions were incubated for 16 h. Lentiviral vectors were then added and cell suspensions incubated for 12 h. Cells were washed twice before being seeded.
siRNA assays.siRNA targeting the human PPARc sequence 59-TGTTCCGTG
ACAATCTGTC-39 were synthesized (Sigma-Aldrich Proligo). siRNAs targeting the human STAT5 sequence 59-AAACTCAGGGACCACTTGC-39, human HIF2a sequence ATTAGAGCAAAGAGTCAGC-39 and murine Cited2 sequence 59-CGAGGAAGTGCTTATGTCCTT-39 were synthetized (eurofins MWG/operon).
CD341BM cells were transfected with specific siRNA (25 nM) or control siRNA in
the presence of Lipofectamine 2000 (Invitrogen) and maintained for 48 h before CFC assay. Control siRNA was purchased from Invitrogen Life Technologies (BLOCK-iT). Transfection efficiency was assessed using a fluorescein-labelled, double-strand RNA duplex (BLOCK-iT FluorescentOligo; Invitrogen).
Human patients.Fresh bone marrow from patients with chronic-phase CML at
diagnosis, umbilical cord blood cells from heathy donors, and blood or bone marrow samples from diabetes patients and patient given pioglitazone off-label were obtained with informed consent approved by the hospital’s Institutional Review Board (Comite´ de protection des personnes Ile-de-France XI) under approved protocol EudraCT number: 2009-011675-79. Imatinib levels were mea-sured in patients’ plasma using a previously described high-performance liquid
chromatography (HPLC) method35.
Statistical analysis.No statistical methods were used to predetermine sample size,
the experiments were not randomized and the investigators were not blinded to allocation during experiments and outcome assessment. For culture assays and quantitative real-time PCR, values were calculated as mean 6 standard deviation for at least three separate experiments performed in triplicate. Paired and unpaired comparisons were made, using the nonparametric Wilcoxon rank test and the Mann–Whitney test, respectively. Limiting dilution analysis was carried out with L-Calc software (StemCell Technologies). All statistical analyses were carried out with StatView software (SAS Institute Inc., Cary, NC).
Statistical information on samples described in figures.For all culture assays,
paired and unpaired comparisons were made using the nonparametric Wilcoxon rank test and the Mann–Whitney test, respectively. Fig. 1a, b, plotted are means for
CD341
cells from 4 CP-CML patients, 16 replica for each. Data with imatinib alone are not statistically different from those for the untreated control (P 5 0.067), whereas pioglitazone as a single agent reduced LTC-IC frequencies by 2.4-fold (P 5 0.008) or by 3.5-fold in combination with imatinib (P , 0.001). LTC-IC frequencies were established using L-Calc software (StemCell Techno-logies). Fig. 1c–e, All patients and statistical analysis are presented in Extended Data Table 1 (n 5 6). Fig. 2a, STAT5B RT–qPCR normalized to GAPDH mRNA. Shown are means with standard deviations (s.d.) for 5 CP-CML patients. STAT5B mRNA levels decreased by 8.5-fold (P , 0.0001), 1.5-fold (P 5 0.08) and 10.5-fold (P , 0.0001) in the presence of pioglitazone, imatinib and the drug combination, respectively. Fig. 2b, Compared to imatinib alone, RT–qPCR analysis shows that addition of pioglitazone induces a significant reduction in mRNA levels by 3.3 and 4.8 fold for BCL-xLand BCL-2, respectively, and 1.6 fold for PIM1 and CIS. mRNA
quantification are normalized to GAPDH levels (n 5 5 CP-CML patients, *P , 0.05). Fig. 2c, Means with s.d. for 5 CP-CML patients. The effect of piogli-tazone was negated by an siRNA against PPARc (P 5 0.043); siRNA validated in Extended Data Fig. 1c. Fig. 2d, Means with s.d. for 5 CP-CML patients. STAT5 overexpression counteract pioglitazone effect (P 5 0.0047); LvSTAT5 validated in Extended Data Fig. 1c. Fig. 3a, results are normalized to GAPDH mRNA levels and represented relative to mRNA expression for the ‘‘Imatinib alone’’ condition (means of 11 patients with s.d. for each mRNA assessed). Fig. 3b, results are normalized to GAPDH mRNA levels and represented relative to mRNA express-ion of ‘‘untreated cells’’ (means of 6 patients with s.d.). As compared to untreated controls, cells treated with imatinib alone show a 6.2-fold increase of HIF2a relative to control (P , 0.011) and a 4.5-fold increase of CITED2 (P 5 0.0277). The addition of pioglitazone reduced the imatinib-mediated HIF2a increase to 2.8-fold (P 5 0.027). Pioglitazone significantly reduced HIF2a induction by 2.2-fold (P 5 0.027) and fully counteracted CITED2 induction. Pioglitazone alone has no effect compared to control. Fig. 4b, According to IS, relapse was declared 2 consecutive positives, 6 months apart. For Extended Data Figures, statistical information is included in their legends.
Statistical information regarding synergy determination.The putative
syn-ergistic effect of multiple drugs was determined by the algorithm and definitions
of the Chou–Talalay medium-effect method36. The imatinib concentration
required for 50% inhibition of the number of colonies obtained after CFC assay,
IC50imatinib, was first determined in CD341
cells from 5 CP-CML patients at
dia-gnosis. There was marked variability between patients (0.6 mM , IC50,2 mM with
a median at 1 mM). Accordingly, at 1 mM imatinib concentration, the percentage inhibition was 47.1% 6 24 of untreated CFC numbers in our full cohort of 29 CP-CML patients (Extended Data Figure 1). Percentages of inhibition were 65.7% 6 26 and 12% 6 15 of untreated CFC numbers for pioglitazone alone (10 mM) and combination (imatinib 1 mM, pioglitazone 10 mM), respectively. A combination
index (CI) , 1 defined synergy. We calculated IC50and CI values with the
Calcusyn software (Biosoft, Cambridge, UK). Imatinib and pioglitazone were assumed as having independent modes of action. In these conditions, CI were always less than 0.248, thus indicating synergy between the two drugs.
26. Davies, G. F., Juurlink, B. H. & Harkness, T. A. Troglitazone reverses the multiple drug resistance phenotype in cancer cells. Drug Des. Devel. Ther.3, 79–88 (2009). 27. Yuan, H. et al. Activation of stress response gene SIRT1 by BCR-ABL promotes
leukemogenesis. Blood119, 1904–1914 (2012).
28. Pitulis, N., Papageorgiou, E., Tenta, R., Lembessis, P. & Koutsilieris, M. IL-6 and PPARc signalling in human PC-3 prostate cancer cells. Anticancer Res.29, 2331–2337 (2009).
29. Chen, Y., Hu, Y., Zhang, H., Peng, C. & Li, S. Loss of the Alox5 gene impairs leukemia stem cells and prevents chronic myeloid leukemia. Nature Genet.41, 783–792 (2009).
30. Kominsky, D. J. et al. Abnormalities in glucose uptake and metabolism in imatinib-resistant human BCR-ABL-positive cells. Clin. Canc. Res.15, 3442–3450 (2009). 31. Lu, D. & Carson, D. A. Repression of beta-catenin signaling by PPAR gamma
ligands. Eur. J. Pharmacol.636, 198–202 (2010).
32. Ito, K. et al. A PML–PPAR-d pathway for fatty acid oxidation regulates hematopoietic stem cell maintenance. Nature Med.18, 1350–1358 (2012). 33. Gabert, J. et al. Standardization and quality control studies of ’real-time’
quantitative reverse transcriptase polymerase chain reaction of fusion gene transcripts for residual disease detection in leukemia — a Europe Against Cancer program. Leukemia17, 2318–2357 (2003).
34. Ne`gre, D. et al. Characterization of novel safe lentiviral vectors derived from simian immunodeficiency virus (SIVmac251) that efficiently transduce mature human dendritic cells. Gene Ther.7, 1613–1623 (2000).
35. Roth, O. et al. Imatinib assay by HPLC with photodiode-array UV detection in plasma from patients with chronic myeloid leukemia: comparison with LC-MS/ MS. Clin. Chim acta.411, 140–146 (2010).
36. Chou, T. C. Drug combination studies and their synergy quantification using the Chou-Talalay method. Cancer Res.70, 440–446 (2010).
Extended Data Figure 1
|
Clonogenicity assays in the presence of various PPARc agonists and validation of STAT5B overexpression and anti-PPARc, anti-STAT5 and anti-HIF2a siRNA. a, Clonogenic capacities of BMCD341
cells were assayed following pre-incubation for 2 days with culture
medium alone (control) or supplemented with PPARc agonists, PGJ2,
troglitazone (Tro), ciglitazone (Cig), rosiglitazone (Ros), pioglitazone (Pio) or MCC-555 (MCC) (25 mM each) (samples from 4 donors in triplicate). The number of colonies scored is expressed as percentage of control (untreated) values with standard deviation (s.d.), *P , 0.05 using the nonparametric
Wilcoxon rank test. b, Validation of anti-PPARc siRNA used in Fig. 2b. CD341
cells were transfected with irrelevant or PPARc targeting siRNA (25 nM each). An anti-PPARc shRNA was used as a positive control. PPARc transcripts were normalized to GAPDH transcripts and expressed relative to the levels measured in untransfected cells. c, Western blot analysis with PPARc, pan-STAT5, HIF2a and anti-actin antibodies (Ab). Validation of siRNA against PPARc or STAT5 and lentivector expressing STAT5B (LvSTAT5B)
were realized on CD341cells from human UCB. Validation of siRNA against
HIF2a was realized on K562 cell line. Ctrl, scrambled siRNA; 2, untreated. Quantification of western blot signal was realized with ImageJ software (http:// rsb.info.nih.gov/ij/). Histograms show mean values with s.d., n 5 3.
Extended Data Figure 2
|
Differential and synergistic effects of pioglitazoneand TKIs on CML cells. a, CFC assays with CD341CP-CML cells from
patients at diagnosis. Imatinib and/or pioglitazone were added for 48h before CFC assays. Means of 29 patients with standard deviation (s.d.). b, CFC assays after lentivector-mediated expression of BCR–ABL or eGFP (negative
control) in human cord blood CD341
cells. Imatinib and/or pioglitazone were added for 48 h before CFC assays. Means of 3 individuals in triplicate with s.d. c, d, Limited dilution analysis (LDA) of CML LSCs by LTC-IC and
frequency analysis. Plotted are means for CD341
cells from 2 CP-CML patients, 16 replica each. Imatinib 1 mM, Rosi 10 mM. e, f, CFSE analysis of
CD341
cells (.96% Ph1
) from CP-CML patients (for all experiments, imatinib 1 mM, dasatinib 0.146 mM, pioglitazone and rosiglitazone 10 mM, JQ1 1 mM. imat, imatinib; dasa, dasatinib; pio, pioglitazone; (P), undivided). To confirm the pivotal role played by STAT5 in the mechanism of action of pioglitazone in eroding the pool of TKI-resistant CML-LSCs, we investigated here the effect of the bromodomain inhibitor JQ1, which inhibits the transcriptional function of STAT5 by decreasing its activity through targeting the bromodomain-containing protein 2 (BRD2), a key cofactor of STAT5. Although this study with JQ1 is corroborative, one cannot completely exclude the possibility that these effects are coincidental, as targeting BRDs may cause a series of effects independent of STAT5.
Extended Data Figure 3
|
Pioglitazone slowly decreases STAT5 expression whereas imatinib rapidly inhibits STAT5 phosphorylation. a, Differentialkinetics of action of imatinib and pioglitazone. CD341CP-CML cells
(patient 4) in liquid culture in serum-free medium without cytokines. b, Rate of apoptosis in CP-CML cell populations after 4 days of culture with imatinib
and/or pioglitazone (n 5 5; *P , 0.05). Solid bars (black for CD382
and grey
for CD381
), percentage of recovery relative to input and normalized to untreated controls. Hatched bars, percentage of apoptosis, defined by the expression of annexin V. c, Flow cytometry analysis of permeabilized K562 cells with IgG against phosphorylated (Tyr694) STAT5. Untreated (black) and drug treated (red or blue). Control panel, no drug treatment but irrelevant IgG isotype control (grey peak). d, Western blot analysis with pan-STAT5 and anti-actin antibodies, showing a decrease of STAT5 by 3.5 fold 6 0.5 (s.d.) in lane 4 (n 5 3). Lanes 1 and 2 for imatinib (15 and 30 min exposure, respectively); lanes 3 and 4 for Pio (72 and 96 h exposure, respectively). Ratio indicates ratio of STAT5 expression/b-actin expression relative to lane 1. Quantification of western blot signals (n 5 3 for each condition) was realized with ImageJ software (http://rsb.info.nih.gov/ij/).
Extended Data Figure 4
|
Forced expression of STAT5 in CP-CML CD341 cells increases the compartment of quiescent cells. a, CFSE analysis ofCP-CML CD341
cells treated with pioglitazone after transduction with lentivectors (Lv) expressing eGFP or STAT5B, whose transcription is PPARc-independent. Representative CP-CML patient 2 in triplicate (data for all patients are in Extended Data Fig. 2e). One coloured peak for each cell division
number. P, colcemid arrested ‘‘parent-cells’’. b, Distribution (%) of CD341
cells in each division peak shown in Extended Data Fig. 3a. c, STAT5 mRNA expression analysis. d, Transduction efficiency of STAT5 lentivector. (5 replica with s.d.). e, Data for the 3 patients tested.
Extended Data Figure 5
|
High toxicity of pioglitazone for CML LSCs vs.low toxicity for normal HSCs. LTC-IC (LDA) showing differential
toxicity of pioglitazone for CP-CML vs. normal CD341
cells (n 5 3, 16 replica for each).
Extended Data Figure 6
|
Erosion of undivided and imatinib-resistantCD341CP-CML cells is OCT1-independent. a, Efficiency of LvOCT1
transduction (D8). b, OCT1 mRNA expression. Results are normalized to GAPDH mRNA levels and represented relative to mRNA expression for the ‘‘imatinib alone’’ condition. c, CFSE analysis and absolute cell count in the presence of imatinib, with or without OCT1 overexpression. Left scale (black),
total cells showing CD341vs. CD342cells (histograms). Right scale (red),
Extended Data Figure 7
|
The viability of undivided (P) andimatinib-resistant CD341CP-CML cells depend on HIF2a expression.Representative
CP-CML patient 8 in triplicate (data for all patients are in Extended Data Fig. 6e). a, CFSE analysis in presence of siRNA against STAT5 or HIF2a in
CD341-Ph1cells treated or not with imatinib. One colored peak for each cell
division number. P, colchemid arrested ‘parent-cells’. b, Distribution (%) of
CD341
cells in each division peak. c, HIF2a mRNA expression 72 h after siHIF2a transfection. d, STAT5 A and B mRNA expression 72 h after siSTAT5
transfection into human UCB CD341cells. Results are normalized to
GAPDH mRNA levels (means of 5 experiments with s.d. for each gene assessed). e, Data for the 5 patients tested (*P , 0.05 relative to siCtrl; #P , 0.05
relative to Imatinib 1 siCtrl). f, CFSE analysis of cord blood CD341
cells after transduction with lentivectors (Lv) expressing HIF2a or eGFP. One coloured peak for each cell division number. P, colchemid arrested
‘parent-cells’. g, Distribution (%) of CD341cells in each division peak (n 5 5).
h, Transduction efficiency of HIF2a Lv. i, HIF2a mRNA expression (means of 5 experiments with s.d.).
Extended Data Figure 8
|
Expression of target genes in CD341cells and Ba/F3 cell line CML-models. a, mRNA expression of target genes in CD341
cells from UCB transduced or not by BCR–ABL expressing lentivector (Lv).
BCR–ABL1cells were cultured in serum-free medium without cytokines for 7
days with either imatinib alone (1 mM) or imatinib and pioglitazone (1 mM and 10 mM, respectively) (means of 5 experiments with s.d. for each gene assessed). Results are normalized to GAPDH mRNA levels and represented relative to mRNA expression for the ‘untreated’ condition. Overexpression of BCR–ABL
in CD341cells from umbilical cord blood induced expression of STAT5 and
HIF1a mRNAs by 2.7- and 2.8-fold, respectively (P 5 0.043), while HIF2a and CITED2 mRNAs were increased by 12.5-fold and 9-fold (P 5 0.043), respectively. In the presence of imatinib, STAT5 and HIF1a mRNAs were increased by 7.5- and 4.9-fold (P 5 0.043), respectively, while HIF2a and CITED2 were increased by 19.3- and 22-fold (P 5 0.043), respectively. Either pioglitazone or an siRNA against STAT5 (A and B) significantly reduced the levels of HIF2a and CITED2 mRNAs, while an siRNA against HIF2a significantly reduced CITED2 mRNA expression (.threefold each, P , 0.05). b, mRNA expression of target genes in Ba/F3 cell sub-lines independent of IL3 for viability after transduction with LvBCR–ABL or constitutively activated Stat5A1*6 (A*) or Stat5B1*6 (B*). Results are normalized to GAPDH mRNA levels and represented relative to mRNA expression for the original Ba/F3 cell line (means of 5 experiments with s.d. for each gene assessed). Forced expression of BCR-ABL increased the level of murine endogenous Stat5 (a and b) mRNAs by 2.7 fold (P 5 0.043). When BCR-ABL or constitutively activated murine Stat5 1*6 (a or b) were overexpressed, murine endogenous Hif1a mRNA level was decreased by threefold (P 5 0.043) and murine endogenous Hif-2a and Cited2 mRNAs increased by more than eightfold each (P 5 0.043).
Extended Data Figure 9
|
The key regulator of HSC quiescence,CITED2, isoverexpressed in TKI-resistant CD341cells from CP-CML patients.
a, mRNA expression of CITED2 and target genes thereof BMI1, HES1 and p57 after 9 days of culture with or without imatinib and pioglitazone. Results are normalized to GAPDH (n 5 4). b, mRNA expression of endogenous murine Cited2 and its target genes Bmi1, Hes1 and p57 in Ba/F3 cell line with or without forced expression of BCR–ABL or constitutively active Stat5A 1*6 (A*) in the presence or not of siRNA against Cited2. Results are normalized to GAPDH (mean 6 s.d. of 3 independent experiments in triplicate). Forced expression of a constitutively active form of murine Stat5 1*6 (A or B) in Ba/F3 cells, in and of itself, was sufficient to increase endogenous expression of murine Cited2 markedly (52-fold) as well as that of its target genes Bmi1 (2.5-fold), Hes1 (13-fold) and p57 (18-fold) c, Proliferation analysis by EdU incorporation assay of the Ba/F3 cell line that expresses or not constitutively active forms of Stat5 A 1*6 (A*) or B 1*6 (B*) in the presence or not of siRNA against Cited2 (representative result of 5 independent experiments).
Extended Data Table 1
|
CFSE analysis of CD341cells (.96% Ph1