HAL Id: hal-02649976
https://hal.inrae.fr/hal-02649976
Submitted on 29 May 2020
HAL is a multi-disciplinary open access
archive for the deposit and dissemination of
sci-entific research documents, whether they are
pub-lished or not. The documents may come from
teaching and research institutions in France or
abroad, or from public or private research centers.
L’archive ouverte pluridisciplinaire HAL, est
destinée au dépôt et à la diffusion de documents
scientifiques de niveau recherche, publiés ou non,
émanant des établissements d’enseignement et de
recherche français ou étrangers, des laboratoires
publics ou privés.
strength
M. Fattet, Murielle Ghestem, W. Ma, M. Foulonneau, Jérome Nespoulous,
Yves Le Bissonnais, Alexia Stokes
To cite this version:
M. Fattet, Murielle Ghestem, W. Ma, M. Foulonneau, Jérome Nespoulous, et al.. Effects of
vegeta-tion type on soil resistance to erosion: relavegeta-tionship between aggregate stability and shear strength.
CATENA, Elsevier, 2011, 87 (1), pp.60-69. �10.1016/j.catena.2011.05.006�. �hal-02649976�
Other uses, including reproduction and distribution, or selling or
licensing copies, or posting to personal, institutional or third party
websites are prohibited.
In most cases authors are permitted to post their version of the
article (e.g. in Word or Tex form) to their personal website or
institutional repository. Authors requiring further information
regarding Elsevier’s archiving and manuscript policies are
encouraged to visit:
Effects of vegetation type on soil resistance to erosion: Relationship between
aggregate stability and shear strength
M. Fattet
a, Y. Fu
b, M. Ghestem
c, W. Ma
b, M. Foulonneau
d, J. Nespoulous
d, Y. Le Bissonnais
e, A. Stokes
f,⁎
aUniversité Montpellier 2, 34095 Montpellier Cedex 5, FrancebChinese Academy of Science, Xishuangbanna Tropical Botanic Garden, Mengla 666300, Yunnan, PR China c
AgroParisTech, AMAP, 34398 Montpellier Cedex 5, France
d
Université de Savoie, 73000 Le Bourget du Lac, France
e
INRA, UMR LISAH, 34060 Montpellier, France
f
INRA, AMAP, 34398 Montpellier Cedex 5, France
a b s t r a c t
a r t i c l e i n f o
Article history: Received 14 July 2010
Received in revised form 22 April 2011 Accepted 6 May 2011
Keywords: Erosion Shallow landslides Roots
Soil organic carbon Soil cohesion China
Soil water erosion and shallow landslides depend on aggregate stability and soil shear strength. We investigated the effect of vegetation on both soil aggregate stability and shear strength (through direct shear tests) in former croplands converted to vegetated erosion protection areas within the context of China's sloping land conversion programme. Four treatments were analysed in plots comprised of (i) 4 year old crop trees, Vernicia fordii, where understory vegetation was removed; (ii) V. fordii and the dominant understory species Artemisia codonocephala; (iii) only A. codonocephala and (iv) no vegetation. Soil samples were taken at depths of 0–5 cm and 45–50 cm. Root length density (RLD) in five diameter classes was measured, soil organic carbon (SOC), hot water extractable carbon (HWEC), texture and Fe and Al oxides were also measured. We found that mean weight diameter after slow wetting (MWDSW) in the A-horizon, was significantly greater
(0.94–1.01 mm) when A. codonocephala was present compared to plots without A. codonocephala (0.57– 0.59 mm). SOC and RLD in the smallest diameter class (b0.5 mm), were the variables which best explained variability in MWDSW. A significant positive linear relationship existed between MWDSWand soil cohesion but
not with internal angle of friction. As herbaceous vegetation was more efficient than trees in improving aggregate stability, this result suggests that the mechanisms involved include modifications of the cohesive forces between soil particles adjacent to plant roots and located in the enriched in SOC rhizosphere, thus also affecting shear strength of the corresponding soil volume. Thus, vegetation stabilised soil under different hierarchical levels of aggregate organisation, i.e. intra- and inter-aggregate. Our results have implications for the efficacy of techniques used in land conversion programs dedicated to control of soil erosion and shallow landslides. We suggest that mixtures of different plant functional types would improve soil conservation on slopes, by reducing both surface water erosion and shallow substrate mass movement. Planting trees for cropping or logging, and removing understory vegetation is most likely detrimental to soil conservation.
© 2011 Elsevier B.V. All rights reserved.
1. Introduction
Soil degradation on steep slopes throughout the world has accelerated hugely over the last 50 years. In particular, countries such as China have experienced a rapid increase in population density, as well as development and industry. Soil degradation has largely been attributed to poor farming practices, deforestation, road and dam construction (Liang et al., 2009; Stokes et al., 2010; Yu et al., 2006; Zhang et al., 2004). Rehabilitation programs for the reduction of soil erosion can encourage the conversion of cropland to forest and orchards (Cao et al., 2009; Trac et al., 2007). However, one of the assumptions of such conversion programs is that by simply planting trees, erosion processes will be arrested (Trac et al., 2007; Wang et al., 2007; Weyerhaeuser et al., 2005). Thus, trees have been planted for cropping e.g. Vernicia fordii or logging purposes, e.g. Eucalyptus sp. and
Catena 87 (2011) 60–69
Abbreviations: γ, dried unit weight; Φ, internal friction; AlDCB, Aluminum oxides
obtained by dithionite-citrate-bicarbonate extraction; c, cohesion; FeDCB, Iron oxides
obtained by dithionite-citrate-bicarbonate extraction; HWEC, Hot water extractable carbon; MWD, Mean weight diameter; MWDFW, Mean weight diameter after fast
wetting; MWDSW, Mean weight diameter after slow wetting; MWDMB, Mean weight
diameter after mechanical breakdown; RLD, total root length density; RLDb 0.5, Root
length density for diameter class equivalent orb0.5 mm; RLD0.6–1.0, Root length density
for diameter class 0.6–1.0 mm; RLD1.1–2.0, Root length density for diameter class 1.1–
2.0 mm; RLDN 2.1, Root length density for diameter class equivalent to orN2.1 mm;
rRLb 0.5, relative length density for diameter classb0.5 mm; rRL0.6–1.0, relative root
length for diameter class 0.6–1.0 mm; rRL1.1–2.0, relative root length for diameter class
1.1–2.0 mm; rRLN 2.1, relative root length for diameter class equivalent to orN2.1 mm;
SLCP, Sloping land conversion program; SOC, Soil organic carbon. ⁎ Corresponding author.
E-mail address:alexia.stokes@cirad.fr(A. Stokes).
0341-8162/$– see front matter © 2011 Elsevier B.V. All rights reserved. doi:10.1016/j.catena.2011.05.006
Contents lists available atScienceDirect
Catena
Cryptomeria japonica, but may not be the best solution for soil conser-vation on steep terrain. Understory vegetation is often removed mechanically or cannot grow in shade conditions, resulting in increased runoff and interrill erosion (Stokes et al., 2010). Root biomass density is usually lower than in natural forest at an equivalent age, augmenting the risk of shallow landslides, particularly during the monsoon season (Genet et al., 2008; 2010).
During heavy precipitation events, splash impact and slaking causes soil aggregates to break down and produce finer, more transportable particles and micro-aggregates. These particles and micro-aggregates (20 to 250μm diameter) affect the processes of infiltration, seal and crust development, runoff and interrill erosion (Legout et al., 2005, Martinez-Mena et al., 1999). Soil aggregate stability is therefore an important property that may explain, quantify and predict these processes (Zhang and Horn, 2001). Aggregate stability in the topsoil layer (0–5 cm) has also been closely correlated to soil susceptibility to runoff (Barthès and Roose, 2002) and to soil erodibility (Le Bissonnais et al., 2007), i.e. soil susceptibility to detachment and transport by erosion processes.
However, even though a superior aggregate stability may reduce runoff and erosion risk, infiltration may in turn increase, thus augmenting the risk of shallow landslides on steep slopes during heavy precipitation events (Ghestem et al., in press). The only way to resolve this apparent conflict is to ensure that aggregate stability and cohesion are improved simultaneously. A small number of studies over the past 30 years have suggested a link between shallow landslides and erosion processes, although quantitative data relating the two are limited (Al-Durrah and Bradford 1981; Frei et al., 2003; Ghidey and Alberts 1997; Nearing and West 1988; Watson and Laflen 1986). A major factor governing substrate mass movement is the shear strength of soil (Terzaghi 1942). Shear strength within a soil matrix is the result of resistance to movement at interparticle contacts, due to particle interlocking, physical bonds formed across the contact areas (resulting from surface atoms sharing electrons at interparticle contacts), and chemical bonds, or cementation (Craig, 2004). The two major active components in resistance of soil shear stress are i) the cohesion c, which is the summation of the effect of particle interlocking and cementation and ii) the internal angle of frictionΦ. Φ is the angle measured between the normal force and resultant force that is attained when failure occurs in response to a shearing stress.
One of the earliest studies which investigated the relationship between erosion and soil shear strength was in 1981, when Al-Durrah and Bradford developed a force-resistance model for waterdrop impact detachment based on soil shear strength measured with a fall-cone. Later,Watson and Laflen (1986)related interrill erosion losses to shear strength measured with a torvane on three soils, each with varying slope angle.Nearing and West (1988), used aggregate mean weight diameter (MWD) after disaggregating in water as an indicator of the aggregate stability and shear strength (using a fall-cone and torvane) on three soils contrasting in their texture (clay, silt loam and fine sand). These authors did not find a direct relationship between both parameters, but concluded that water stress influenced similarly the MWD and the bulk soil strength. More recently, Ghidey and Alberts (1997) studied the effect of plant roots on soil erodibility, shear strength and aggregate stability using a rainfall simulator.
Ghidey and Alberts (1997) found that as the amount of dead root mass and live root length increased, aggregate stability and shear strength augmented and interrill erodibility decreased. Frei et al. (2003)also found that soil aggregate stability was correlated with soil shear strength from triaxial tests, although the sample number was limited. If a direct link between aggregate stability and soil shear strength could be determined, it would allow a better understanding of the mechanisms involved and thus how of rehabilitation measures influence soils undergoing degradation processes.
The urgent necessity to conserve soil and rehabilitate fragile land on steep slopes worldwide, has led to a number of recent studies investigating the effect of vegetation on aggregate stability and
shallow landslides. With regard to the latter, the presence of plant roots physically reinforces the shear zone (seeStokes et al., 2009). However, vegetation can also influence soil structure because of the contribution of organic matter through litter and plant root turnover (Angers and Caron, 1998), root exudates and rhizodeposition (Gyssels et al., 2005; Pohl et al., 2009). The effect of roots on erodibility decreases with increasing root diameter (De Baets et al., 2007). This effect may be due to the higher turnover (rate of root growth and decay,Gale et al., 2000) offine roots (diameter b2 mm) compared to coarse roots (N2 mm), as well as the association of fine roots with fungal hyphae (Jastrow et al., 1998), and the physically binding dense fine root network. The soil organic carbon (SOC) input in the soil by roots corresponds to temporary binding agents which bind micro-aggregates into macro-micro-aggregates (N250 μm up to several mm diameter) (Gale et al., 2000; Wander and Yang, 2000). Labile fraction of SOC may be assessed by hot water extractable carbon (HWEC).
Sparling et al. (1998)found that HWEC after air drying was about 43% of the microbial carbon (i.e. polysaccharides) and strongly related to microaggregation (Boix-Fayos et al., 2001; Ghani et al., 2003; Haynes and Francis, 1993; He et al., 2008; Kouakoua et al., 1997; Von Lutzow et al., 2000). In addition, Fe and Al oxides may interact with organic matter in macro-aggregate stability through their flocculation capacity, the binding effect of clay particles to organic molecules (Zhang and Horn, 2001), and a possible precipitation as gels on clay surfaces (Amezketa, 1999).
The aim of our study was to analyze how soil physical properties were modified under a tree crop, Vernicia fordii, where understory vegetation had been removed, compared to a site where the dominant understory vegetation species, Artemesia codonocephala, was still present. We also aimed at determining a relationship between soil aggregate stability and shear strength with regard to vegetation type. 2. Materials and methods
2.1. Study site
We studied aggregate stability and soil shear strength in the Yunnan province, Southern China, where erosion and landslides are severe (Yang et al., 2005; Zhang et al., 1995; Zhou et al., 1998).
The study area (26°01′N, 98°50′E) was located near Da Xing Di village, north of Liuku town in the Salween river valley. This part of China is under the influence of the Indian monsoon, and described as a “warm–dry climate”, being is a combination of subtropical and alpine climates. Annual mean temperature (from 1961 to 2002) is 15.2 °C, and mean annual precipitation is 1200 mm, the majority of which falls between May and October (Ghestem et al., 2009). Numerous landslides occur during the monsoon season (May–October) and soil erosion is severe, largely due to the cutting of roads through the steep slopes (Stokes et al., 2010).
At our study site, corn (Zea mays) was cultivated from 1980, after deforestation, until 1999 when a conversion program was initiated within the framework of the Sloping Land Conversion Program (SLCP). The SLCP, or Grain for Green, aims at planting trees on existing agricultural land, concentrating on zones where slopes areN25° (Cao et al., 2009; Trac et al., 2007). Several species of trees and shrubs were planted at the site, including Pueraria stricta, Ricinus communis, Agava americana, Jatropha curcas, and Vernicia fordii. We focused on one area where the species V. fordii had been established. The oil from its nuts is used for agrofuel production. To avoid competition from the neighbouring biennial pioneer plant, Artemisia codonocephala, farmers often remove this latter species through scything.
At our site, two soil horizons exist: an A-horizon in the top 0–15 cm, characterized by a silty clay loam texture (17% sand, 50% silt, 33% clay) and a colour of 7.5 Yr 3/4 (dark yellowish brown); a B-horizon (15–60 cm) dominated by clay (13% sand, 39% silt, 48% clay) and with a colour of 5 Yr 4/6 (yellowish red). Source rock emergence occurred at about 60 cm M. Fattet et al. / Catena 87 (2011) 60–69
depth. Throughout the whole profile, soil was alkaline (pH=8.42), with a high capacity of exchangeable cations (20 cmol kg−1) and a high carbonate content (15 cmol of Ca2+kg−1). Slope angle ranged from 20
to 35° and the site was situated at an altitude of 1000 m. 2.2. Sampling procedure
We selected four plots (5×10 m) containing: (i) 4 year old V. fordii trees (mean±standard error diameter at breast height, DBH=18.66± 2.91 cm) in a small plantation with total plant cover of 5%, where A. codonocephala was removed through scything on an annual basis; (ii) a combination of V. fordii (20% of total plant cover) and A. codonocephala (80% of total plant cover), with total plant cover of 60%; (iii) only A. codonocephala, with total plant cover of 50% and (iv) a site without vegetation, with plant coverb5%. In the presence of V. fordii, soil samples were collected at 30 cm from the tree base. Six blocks were established within each plot. Each block was circular and was 0.5 m in diameter. Sampling took place at the end of the dry season, from 27 February to 2 March 2010.
For both aggregate stability and direct shear tests, samples were taken from representative typical A- and at B-horizons i.e. at 0–5 cm and at 45– 50 cm. Litter, rock fragments and surface crust, when present, were removed prior to sampling. For aggregate stability tests, each sample was 360 cm3and obtained using a cylinder corer (n=2 samples from each
block, hence n=48 in total). For direct shear tests, samples of soil were removed using a small spade. Each sample was approximately 800 cm3
and was taken from within three blocks for the plot without vegetation, and from two blocks for plots with A. codonocephala, V. fordii×A. codonocephala, and V. fordii (n=18). Samples were kept cool in freezer boxes until they were transported to the laboratory.
2.3. Biotic properties
Once in the laboratory, all roots from soil samples used for aggregate stability tests were removed. To better visualize the roots during image analysis, staining was carried out using an aqueous concentration of 0.1% (w/v) methylene blue, with a contact time of 5 min (Costa et al., 2001). Stained roots were then scanned with a resolution of 600 dpi and analyzed using WinRHIZO (Pro version 3.0, Regent Instruments, Canada) (Zobel, 2008). The total root length and the root length per class of diameter were obtained (b0.5 mm; 0.6 mm–1.0 mm; 1.1 mm–2.0 mm; N2.1 mm). The total root length density (RLD, mm cm− 3) was calculated because of its relevance for evaluating the effects of roots on erosion processes (De Baets et al., 2006; Gyssels et al., 2005). The RLD is the total length of the roots divided by the volume of the root-permeated soil sample. The root length density per class of diameter (denoted RLDb 0.5, RLD0.6–1.0,
RLD1.1–2.0and RLDN 2.1, mm cm− 3) were also calculated. The relative
root length for each class of diameter (denoted rRLb 0.5, rRL0.6–1.0,
rRL1.1− 2.0and rRLN 2.1, mm cm− 3) were calculated by dividing each
root length per class of diameter by the total root length of roots present in the soil sample.
Soil organic carbon (SOC) was obtained by wet digestion (g kg− 1) (LY/T 1237-1999in the Forestry industry standard of the People's Republic of China, 1999). Hot water extractable carbon (HWEC, g/kg) was obtained using a modified method from Haynes and Francis (1993). 6 g of oven dry soil was placed into 100 ml polypropylene centrifuge tubes and 60 ml of distilled water added. The tubes were left for extraction in a hot-water bath at 80 °C for 16 h. At the end of the extraction period, each tube was shaken for 10 s on a vortex shaker to ensure that HWEC released from the SOC was fully suspended in the extraction medium. Samples were then centrifuged for 20 min at 3500 rpm andfiltered through Tokyo 5 C paper. Soluble carbon was measured using a Shimadzu TOC-5000 analyser. All analyses were replicated twice.
2.4. Abiotic properties
Soil analyses were carried out on soil fractionsfiner than 2 mm. Sand (2.00–0.05 mm), silt (0.050–0.002 mm), and clay (b0.002 mm) content were determined using the pipette method (%) (Kalra and Maynard 1991). All analyses were replicated twice. Dithionite-citrate-bicarbonate extractable Fe and Al were measured as described by
Mehra and Jackson (1960)(respectively FeDCBand AlDCB, g kg− 1).
2.5. Soil aggregate stability tests
In the laboratory, soil samples were placed in a temperate well-ventilated atmosphere to be air-dried for 1 week. Soil aggregate stability was determined after oven drying at 40 °C, according to the standardized methodNF X 31-515developed byLe Bissonnais (1996). This method combines three disruptive tests, performed on the aggregates of 3–5 mm diameter: (i) fast wetting in water; (ii) slow wetting in water; and (iii) mechanical breakdown. For the fast wetting test, about 5 g of calibrated aggregates was rapidly immersed in 50 ml of deionized water for 10 min. For the slow wetting test, aggregates were capillary rewetted with water on a tension table at a potential of−0.3 kPa for 60 min. For the mechanical breakdown test, similar amounts of aggregates were gently immersed in ethanol. After 30 min, ethanol was eliminated and aggregates were hand agitated in 200 ml of deionized water 20 times in a fast end-over-end movement. The solution was adjusted to 250 ml and was left for 30 min for sedimentation, after which the water was eliminated. After each test, the residual aggregates were collected and transferred onto a 50μm sieve previously immersed in ethanol, which was gently hand moved in a helical movement,five times with the same amplitude (4 cm) and the same frequency (1 s per cycle) each time. The remaining aggregates on the sieve were collected, and dried at 40 °C for 48 h, and gently dry sieved using a column of six sieves: 2.00, 1.00, 0.50, 0.20, 0.10, and 0.05 mm. Each treatment was replicated three times. Aggregate stability for each sample was expressed as the mean weight diameter (MWD, mm) for each treatment (MWDFW, MWDSW, and
MWDMB, for fast wetting, slow wetting, and mechanical breakdown,
respectively): MWD =∑d × m
100
where d is the mean diameter between the two sieves (mm); and m the weight fraction of aggregates remaining on the sieve (%). 2.6. Direct shear tests
Strain-controlled direct shear tests were carried out on recon-stituted, drained 60 mm × 60 mm × 20 mm soil samples with roots removed during the reconstitution process. Samples were not saturated prior to testing, and as they were kept sealed at 4 °C after removal from thefield, it can be assumed that soil moisture content was similar to that infield conditions. Samples were placed in a shear testing device (VJTech 2760A, U.K.) and normal loads of 200, 300 and 500 N were applied as weights on three separate samples taken from the same block of soil (Schuppener et al., 1999). A lateral displacement was applied at a speed of 0.8 mm min− 1until failure occurred and the peak shear force recorded. The cohesion (c) and the angle of internal friction (Φ) were obtained by the Mohr–Coulomb theory (Schuppener et al., 1999).
To obtain soil moisture content, sub-samples were weighed and dried at 60 °C for 4 days and then 105 °C for 24 h, or until constant weight. Soil moisture content was expressed as gram of water per gram of dry soil. Density was measured on each samples tested, using a modified method fromBaize (2000)Sample weight was obtained by dividing the volume of water occupied by the sample in a graduated M. Fattet et al. / Catena 87 (2011) 60–69
cylinder. To increase accuracy, the weight of water in the sample was removed from the total sample weight, by calculating the dry unit weight:
γ = P=Vð Þ = 1−wð Þ
whereγ is the dried unit weight (kN∙m−3); P the total sample weight
(kN); V the sample volume (m3); and w the soil moisture content (g of water g−1of soil).
2.7. Statistical analysis
Variables were transformed prior to analysis to meet the assumptions required in an analysis of variance (ANOVA), using an arcsine square root transformation for percentage and a log transformation for other values (MWDFW, MWDMB, MWDSW, HWEC, RLD, RLDb 0.5, RLD0.6–1.0, RLD1.1–2.0,
RLDN 2.1). The influence of sampling site and horizon on soil properties and
aggregate stability was investigated using an analysis of variance (ANOVA). Post-hoc Fisher LSD tests (pb0.05) were performed to compare results. The relationship between all variables was investigated using a Pearson's correlation matrix. Linear regressions were carried out to determine the relationships between MWDSWand c andΦ in both soil
horizons. Statistical analysis was performed using STATISTICA 7.1 (Statsoft Inc, Tulsa, USA).
3. Results
3.1. Biotic and abiotic properties
The mean RLD, RLDb 0.5, RLD0.6–1.0and RLD1.1–2.0were significantly
higher in the A-horizon compared to the B-horizon (F1,40=39.84,
pb0.001 for RLD,Fig. 1a, F1,40=36.11, pb0.001 for RLDb 0.5 Fig. 1b,
F1,40=20.09, pb0.001 for RLD0.6–1.0, and F1,40=4.96, pb0.05 for RLD1.1– 2.0,Table 1). In the A-horizon, RLD was significantly higher at plots with A.
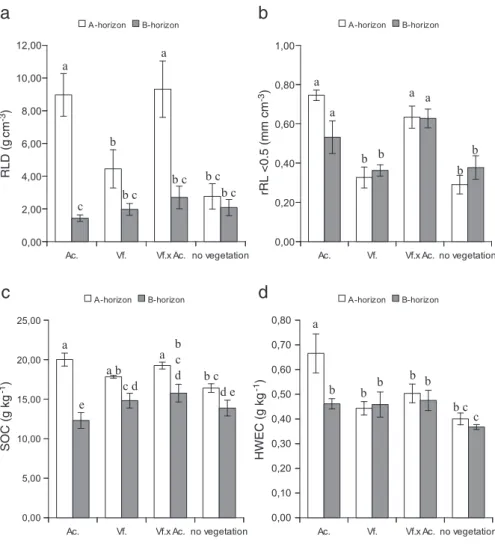
codonocephala (8.97±1.31 mm cm−3) and V. fordii×A. codonocephala (9.32±1.72 mm cm−3) compared to plots with V. fordii (4.45±1.17 mm cm−3) and soil without vegetation (2.76±0.78 mm cm−3). In the B horizon, the RLD was significantly lower at plots with A. codonocephala only (1.43±0.20 mm cm−3).
Differences between plots were significantly greater with regard to rRL, compared to RLD (Table 1). In the A-horizon, rRLb 0.5was significantly
higher at plots with A. codonocephala (0.75±0.03 mm mm−1) and V. fordii×A. codonocephala (0.63±0.06 mm mm−1) compared to plots with V. fordii (0.33±0.05 mm cm−3) and soil without vegetation (0.29± 0.05 mm mm−1). The rRL0.6–1.0was significantly lower at plots with A.
codonocephala (0.21±0.02 mm mm−1) and V. fordii×A. codonocephala (0.31± 0.04 mm mm−1) compared to plots with V. fordii (0.56 ± 0.04 mm mm−1) and on soil without vegetation (0.54 ±0.04 mm mm−1). A similar pattern was also found with regard to rRL1.1–2.0,
which was significantly lower at plots with A. codonocephala (0.05±
b
d
c
a
Fig. 1. Main biotic properties measured under the different vegetation types (a): root length density (RLD), (b): relative root length diameterb0.5 mm (rRLb 0.5), (c): soil organic
carbon (SOC) (d): hot water extractable carbon (HWEC). Ac.: Artemesia codonocephala, Vf.: Vernicia fordii, Vf.xAc.: V. fordii × A. codonocephala. Values are means ± standard error (n = 6). Where letters above bars differ, data are significantly different (Pb0.05). F and associated P values are given inTable 1.
0.01 mm mm−1) and V. fordii × A. codonocephala (0.06± 0.02 mm mm−1) compared to plots with V. fordii (0.10±0.02 mm mm−1) and soil without vegetation (0.16±0.03 mm mm−1). The rRLN 2.1was lower
than 0.05 mm mm−1for all plots with no significant differences between plots (Table 2).
The SOC varied from 12.31±0.99 g kg−1to 20.00±0.82 g kg−1 (Fig. 1c), corresponding respectively to the B- and A-horizons beneath A. codonocephala. In soil from all plots, mean SOC was significantly greater in the A-horizon compared to the B-horizon (F1,40=52.91, pb0.001).
Significant differences were found among different types of vegetation in soil from the A-horizon (F3,40= 2.84, pb0.05). Mean SOC was
significantly greater beneath A. codonocephala (20.00±0.82 g kg−1)
and V. fordii×A. codonocephala (19.34±0.43 g kg−1) compared to V. fordii (17.80±0.18 g kg−1) and soil without vegetation (16.42±0.55 g kg−1). In soil from the B-horizon, only the site with A. codonocephala had a significantly lower SOC value (12.31±0.99 g kg−1). Mean HWEC
represented 1.59–4.55% of the SOC, the significantly lowest value corresponding to that of soil without vegetation. Mean HWEC was significantly higher in the A horizon compared to the B horizon (F1,40=4.27, pb0.05,Table 1). In the A-horizon only, mean HWEC was
significantly greater (F3,40=6.60, pb0.001) beneath A. codonocephala
(0.67±0.08 g kg−1), compared to V. fordii×A. codonocephala (0.50± 0.04 g kg−1), V. fordii (0.44±0.03 g kg−1) and soil without vegetation (0.40±0.02 g kg−1).
The quantity of FeDCB oxides ranged from 18.20 ±0.64 g kg−1to
24.42±0.71 g kg−1in both horizons (Table 2). The quantity of AlDCB
oxides ranged from 2.48 ±0.11 g kg−1to 3.66±0.21 g kg−1in both horizons (Table 2). The low variability of these two properties did not permit us to study relationships with other variables. The range of values of biotic properties was high in the A-horizon but very low in the B-horizon. Thus, the biotic properties reflected characteristics of the different vegetation only in the A-horizon. Therefore, an analysis of relationships between biotic and abiotic properties and aggregate stability was only possible for data from the A-horizon. In the A-horizon, SOC was found to increase significantly and linearly with an increase in
mean RLD, and RLDb 0.5. Mean HWEC also increased linearly and
positively with RLD and RLDb 0.5but with a low R2(Table 3).
3.2. Soil aggregate stability
Soil aggregate stability was generally low. The MWDFW ranged
from 0.37 to 0.56 mm, MWDSWfrom 0.57 to 1.01 mm and MWDMB
from 0.45 to 0.67 mm. Only the two tests of slow wetting (MWDSW)
and mechanical breakdown (MWDMB), resulted in significant
differ-ences between plots (F3,40= 4.69, pb0.05 and F3,40= 4.15, pb0.05,
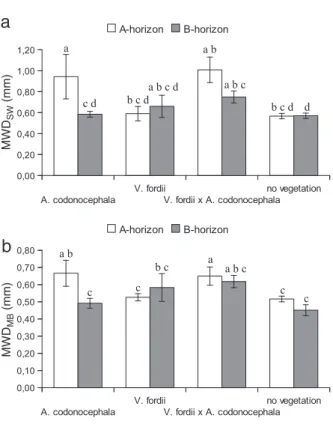
respectively). The highest MWDSWin the A-horizon was obtained for
V. fordii × A. codonocephala, followed by A. codonocephala, V. fordii, and soil without vegetation (Fig. 2a). With regard to MWDMBin the
A-horizon, the plots with A. codonocephala possessed the highest values, followed by V. fordii × A. codonocephala, V. fordii, and the soil without vegetation (Fig. 2b). Between the three tests, MWDSWwas the test
which best discriminated between plots. Thus, MWDSWwas used as
the representative parameter, for the ensuing analysis of results. 3.3. Influence of biotic and abiotic properties on soil aggregate stability
As RLD is an absolute value, compared to rRL, it was more appropriate for investigating the influence of root length on MWDSW. In the A-horizon,
MWDSWwas found to increase significantly and linearly with an increase
in mean RLD, RLDb 0.5, SOC, and HWEC (Fig. 3a, b, c, and d, respectively for
MWDSW). No relationships were found between any MWD value for the
three treatments and abiotic properties in the A-horizon (Table 3). 3.4. Shear strength characteristics and relationship with aggregate stability
Mean c was 15.84±2.33 kPa in the A-horizon and 16.67±0.55 kPa in the B-horizon. MeanΦ was 14.64±3.86° in the A-horizon and 7±0.55° in the B-horizon. No significant differences in c or Φ were found between horizons. With regard to results from both horizons combined, no significant relationships were found between γ, c and Φ, and no significant Table 1
Vegetation type, soil depth (A and B horizons) and their interaction, influenced aggregate stability, biotic and abiotic variables. F and P values were obtained by factorial ANOVA, (n = 48). MWDFW: mean weight diameter after fast wetting; MWDMB: mean weight diameter after mechanical breakdown; MWDSW: mean weight diameter after slow wetting; RLD:
root length density. Values following RLD indicate the roots class of diameter, i.e.,b0.5: roots equivalent to or finer than 0.5 mm, 0.6–1: roots with diameter from 0.6 to 1 mm, 1.1–2: roots with diameter from 1.1 to 2 mm,N2.1: roots equivalent to or larger than 2.1 mm. SOC: soil organic carbon; HWEC: Hot Water Extractable Carbon; FeDCBand AlDCB:
dithionite-citrate-bicarbonate extractable Fe and Al.
Vegetation Horizon Vegetation × Horizon
F3,40 P F1,40 P F3,40 P Biotic properties RLD (mm cm− 3) 5.96 ** 39.84 *** 2.72 0.05 RLDb 0.5(mm cm− 3) 11.99 *** 36.12 *** 2.48 0.11 RLD0.6–1.0(mm cm− 3) 1.13 0.35 20.09 *** 1.04 0.38 RLD1.1–2.0(mm cm− 3) 0.29 0.84 4.96 * 0.96 0.42 RLDN 2.1(mm cm− 3) 0.71 0.55 0.19 0.67 0.77 0.52 rRLb 0.5(mm mm− 1) 20.10 *** 0.42 0.52 2.75 0.05 rRL0.6–1.0(mm mm− 1) 13.74 *** 0.33 0.57 1.75 0.17 rRL1.1–2.0(mm mm− 1) 4.77 * 1.50 0.23 0.94 0.43 rRLN 2.1(mm mm− 1) 1.14 0.35 1.20 0.28 0.79 0.51 SOC (g kg− 1) 2.84 * 52.91 *** 2.26 0.12 HWEC (g kg− 1) 6.45 ** 4.54 * 2.77 0.05 Abiotic properties Sand (%) 1.91 0.14 3.98 0.05 0.89 0.45 Silt (%) 11.68 *** 15.44 *** 4.32 ** Clay (%) 8.98 *** 14.44 *** 3.46 ** FeDCB(g kg− 1) 11.23 *** 2.40 0.13 1,05 0.38 AlDCB(g kg− 1) 9.42 *** 3.09 0.09 2.48 0.08 Aggregate stability MWDFW(mm) 1.93 0.14 2.29 0.14 0.81 0.50 MWDSW(mm) 3.26 * 2.44 0.13 1.93 0.14 MWDMB(mm) 3.86 * 3.67 0.06 2.09 0.12
* Significant at 0.05 level, ** significant at 0.01 level, and *** significant at 0.001 level.
relationships were found between biotic or abiotic properties and c orΦ. However, a significant and positive relationship was found between c and MWDSW(Fig. 4), using results from both horizons combined together and
with a soil moisture content of 24.03±0.80%. This positive relationship was also found to be significant for samples from the A-horizon (c=25.73×MWDSW−0.12, R2=0.61, pb0.05) and in the B-horizon
(c=10.97×MWDSW+9.58, R2=0.48, pb0.05).
4. Discussion
4.1. Variation in aggregate stability
Soil aggregate stability in the A-horizon differed significantly depend-ing on the type of vegetation present. Variations in aggregate stability were negligible in the B-horizon, as also found byEviner and Chapin (2002). The MWDFWfailed to discriminate between the different plots,
because aggregate stability was generally too low to resist the high breakdown energy from this test. Inversely, the MWDSWwas the best
variable to discriminate between plots because it had the lowest breakdown energy. Mean MWDSWwas significantly greater in plots of
A. codonocephala and V. fordii×A. codonocephala compared to plots without A. codonocephala. Mean MWDSWin the A-horizon was greater
than 0.8 mm in the two plots with A. codonocephala and smaller than 0.8 mm for the two plots without. Therefore, less interrill erosion should occur on plots with A. codonocephala during rain events (Le Bissonnais, 1996).
4.2. Influence of vegetation on aggregate stability
The variable best explaining soil aggregate stability in the A-horizon was RLD of thefinest roots i.e. in the diameter class b0.5 mm. Similar results were found byPohl et al. (2009), although these authors could Table 2
Mean value of all measured variables for the different vegetation types at different horizons and results of the post-hoc Fisher LSD tests (Pb0.05). Mean value±standard error. Values with the same letters represent homogeneous groups under the significant level of p=0.5.
Parameters Species and horizon of sampling
Artemesia codonocephala (n = 6) Vernicia fordii (n = 6) V. fordii × A. codonocephala (n = 6) No vegetation (n = 6)
0–5 cm 45 cm 0–5 cm 45 cm 0–5 cm 45 cm 0–5 cm 45 cm Aggregate stability MWDFW(mm) 0.52 ± 0.09 a 0.51 ± 0.03 a 0.37 ± 0.02 b 0.51 ± 0.07 a 0.53 ± 0.05 a 0.56 ± 0.04 a 0.43 ± 0.03 a b 0.48 ± 0.01 a MWDMB(mm) 0.67 ± 0.08 a 0.49 ± 0.03 d c 0.53 ± 0.02 a b c d 0.58 ± 0.08 a b c 0.65 ± 0.05 a b 0.62 ± 0.04 a b 0.52 ± 0.02 b c d 0.45 ± 0.03 d MWDSW(mm) 0.94±0.21a b 0.59 ± 0.03 c 0.59±0.07 c 0.66 ± 0.11 b c 1.01 ± 0.12 a 0.75 ± 0.06 b c 0.57 ± 0.03 c 0.57 ± 0.03 c Biotic properties RLD (mm cm−3) 8.97 ± 1.31 a 1.43 ± 0.20 d 4.45 ± 1.17 c 1.97±0.36 c d 9.32 ± 1.72 a 2.70 ± 0.69 c d 2.76 ± 0.78 c d 2.08 ± 0.49 c d RLDb 0.5(mm cm− 3) 6.73 ± 1.13 a 0.76 ± 0.16 b 1.65 ± 0.60 b 0.72±0.15 b 6.13 ± 1.30 a 1.67 ± 0.41 b 0.83 ± 0.30 b 0.68 ± 0.12 b RLD0.6–1.0(mm cm− 3) 1.80±0.24 a b c 0.46 ± 0.13 e 2.37±0.59 a b 0.84±0.12 b c d e 2.69 ± 0.63 a 0.91±0.36 d e 1.52±0.46 a b c d 1.08±0.33 c d e RLD1.1–2.0(mm cm−3) 0.41 ± 0.09 a 0.18 ± 0.07 a b 0.40 ± 0.12 a 0.36 ± 0.16 a 0.48 ± 0.14 a 0.10 ± 0.04 b 0.38 ± 0.11 a 0.32 ± 0.13 a b RLDN 2.1(mm cm− 3) 0.007 ± 0.004 0.032 ± 0.032 0.033 ± 0.021 0.052 ± 0.025 0.007 ± 0.004 0.023 ± 0.023 0.033 ± 0.033 0 rRLb 0.5(mm mm− 1) 0.75 ± 0.03 a 0.53 ± 0.08 b 0.33 ± 0.05 c 0.36 ± 0.03 c 0.63 ± 0.05 a b 0.63 ± .05 a b 0.29 ± 0.05 c 0.38 ± 0.06 c rRL0.6–1.0(mm mm− 1) 0.21 ± 0.02 c 0.30 ± 0.07 c 0.56 ± 0.04 a 0.45 ± 0.04 a b 0.31 ± 0.04 c 0.31 ± 0.04 b c 0.54 ± 0.04 a 0.45 ± 0.07 a b rRL1.1–2.0(mm mm−1) 0.05 ± 0.01 b 0.12 ± 0.05 a b 0.10 ± 0.02 a b 0.16 ± 0.04 a 0.06 ± 0.02 b 0.06 ± 0.02 b 0.16 ± 0.03 a 0.16 ± 0.05 a rRLN 2.1(mm mm−1) 0 0.043 ± 0.043 0.012 ± 0.010 0.025 ± 0.012 0 0.005 ± 0.005 0.008 ± 0.008 0 SOC (g kg− 1) 20.00 ± 0.82 a 12.31 ± 0.99 e 17.80 ± 0.18 a b 14.80 ± 0.93 c d 19.34 ± 0.43 a 15.80±1.12 b c d 16.42±0.55 b c 13.94±1.00 d e HWEC (g kg−1) 0.67±0.08 a 0.46±0.02 b c 0.44±0.03 b c 0.46±0.05 b c 0.50±0.04 b 0.48 ± 0.04 b 0.40±0.02 b c 0.37 ± 0.01 c Abiotic properties Sand (%) 14.27 ± 1.69 10.66 ± 1.69 15.17 ± 3.64 12.65 ± 2.88 19.06 ± 2.14 18.61 ± 2.90 19.38 ± 3.47 10.18 ± 2.41 Silt (%) 44.04 ± 4.46 a 16.70 ± 1.68 c 48.28 ± 4.67 ab 48.17 ± 4.54 ab 55.97 ± 0.78 a 47.86 ± 3.71 a b 50.37±0.99 a b 42.20 ± 6.59 b Clay (%) 41.70 ± 6.73 b c 72.64 ± 1.73 a 36.54 ± 5.63 b c d 39.19±6.55 b c 24.97±1.76 d 33.54±6.24 b c d 30.25±2.83 c d 47.62 ± 8.52 b FeDCB(g kg− 1) 23.30 ± 0.91 a b 23.93 ± 1.33 a 24.42 ± 0.71 a 22.31 ± 1.55 a b c 20.30±0.30 c d 18.20 ± 0.64 d 20.72±0.50 b c d 20.33±0.47 c d AlDCB(g kg− 1) 2.97 ± 0.09 b c 3.66 ± 0.21 a 3.02 ± 0.11 b 2.94 ± 0.16 b c d 2.52±0.08 c d 2.48 ± 0.11 d 2.64 ± 0.14 b c d 2.87±0.27 b c d Table 3 Correlation coefficients (R2
) for the linear relationships between the parameters of aggregate stability and the biotic and abiotic properties (n = 24) MWDFW: mean weight diameter
after fast wetting; MWDMB: mean weight diameter after mechanical breakdown; MWDSW: mean weight diameter after slow wetting; RLD: root length density. Values following RLD
indicate the roots class of diameter, namely,b0.5: roots equivalent to or finer than 0.5 mm, 0.6–1: roots with diameter from 0.6 to 1 mm, 1.1–2: roots with diameter from 1.1 to 2 mm, N2.1: roots equivalent to or larger than 2.1 mm. SOC: soil organic carbon; HWEC: Hot Water Extractable Carbon; FeDCBand AlDCB: dithionite-citrate-bicarbonate extractable Fe and Al.
MWDFW MWDMB MWDSW RLD RLDb 0.5 RLD0.6–1.0 RLD1.1–2.0 RLDN 2.1 SOC HWEC Sand Silt Clay FeDCB AlDCB
MWDFW MWDMB 0.796*** MWDSW 0.852*** 0.807*** RLD 0.265* 0.450*** 0.329** RLDb 0.5 0.395** 0.607*** 0.459*** 0.890*** RLD0.6–1 Ns Ns Ns 0.394** Ns RLD1.1–2 Ns Ns Ns 0.208* Ns 0.494*** RLDN 2.1 Ns Ns Ns Ns Ns Ns Ns SOC 0.294** 0.509*** 0.461*** 0.527*** 0.603*** Ns Ns Ns HWEC 0.401*** 0.388** 0.409*** 0.255* 0.326** Ns Ns Ns 0.514*** sand Ns Ns Ns Ns Ns Ns Ns Ns Ns Ns silt Ns Ns Ns Ns Ns Ns Ns Ns Ns Ns Ns clay Ns Ns Ns Ns Ns Ns Ns Ns Ns Ns 0.538*** 0.671*** FeDCB Ns Ns Ns Ns Ns Ns Ns Ns Ns Ns Ns Ns Ns AlDCB Ns Ns Ns Ns Ns Ns Ns Ns Ns Ns Ns Ns Ns 0.684***
Ns not significant, * significant at 0.05 level, ** significant at 0.01 level, and *** significant at 0.001 level. M. Fattet et al. / Catena 87 (2011) 60–69
explain only 10% of the variability in soil aggregate stability when considering rootsb0.5 mm, possibly due to the wet sieving method used as an aggregate stability test. Through measurements of RLD,De Baets
et al. (2007)also demonstrated the role of roots in the topsoil resistance against interrill erosion. With regard to the different types of vegetation present at our site, total RLD was highest in the plots with A. codonocephala and V. fordii×A. codonocephala and over 50% of total RLD comprised very fine roots (diameter equivalent to or b0.5 mm in these plots). In the remaining plots with V. fordii and without vegetation, total RLD was 2–5 times lower and SOC was 5–20% lower in the A-horizon than on plots where A. codonocephala was present. Nevertheless, mean RLD was low compared to values from e.g. herbaceous species where mean RLD was approximately 400 mm cm−3(De Baets et al., 2006) and crop species where mean RLD values ranged from 100 to 1000 mm cm−3(Haynes and Beare, 1997). Therefore, even when RLD is small, as in our study, it can still be a useful predictor of aggregate stability.
Plant roots can promote soil aggregation by releasing material which can directly stabilize soil particles, enmesh soil particles by hyphae and roots, or can favour microbial activity in the rhizosphere which in turn will affect soil structure (Bearden and Petersen, 2000; Burri et al., 2009). Veryfine roots are more significantly associated
a
b
Fig. 2. Mean Weight Diameter (MWD) obtained by from aggregate stability tests (Le Bissonnais, 1996) under the different vegetation types (a) MWD after the treatment by slow wetting (MWDSW), (b) MWD after the treatment by mechanical breakdown
(MWDMB). Values are means ± standard error (n = 6). Where letters above bars differ,
data are significantly different (Pb0.05). F and associated P values are given inTable 1.
a
b
d
c
Fig. 3. Relationships between the mean weight diameter after the slow wetting treatment (MWDSW) and the mean biotic properties in the A-horizon (a) relationship between the MWDSW
and Root Length Density (RLD), (b) relationship between the MWDSWand the root length density of the class diameterb0.5 mm (RLDb 0.5), (c) relationship between the MWDSWand the
Soil Organic Carbon (SOC), (d) relationship between the MWDSWand the Hot Water Extractable Carbon (HWEC). A. codonocephala; V. Fordii, V. fordii× A. codonocephala; soil without
vegetation. R2is the coefficient of determination at the P probability level.
5
Fig. 4. Relationship between the mean weight diameter after the slow wetting treatment (MWDSW) and the cohesion (c) obtained by direct shear testing in both horizons R2is the
coefficient of determination at the P probability level. M. Fattet et al. / Catena 87 (2011) 60–69
with fungal hyphae (Jastrow et al., 1998) and microbial activity stabilises soil aggregates through the binding action of humic substances and other microbial by-products contributing to soil organic material (Abid and Lal, 2008; Chan et al., 2001; Goh, 2004, Jastrow et al., 1996; Li et al., 2007; Liu et al., 2003; Six et al., 2004; Tisdall and Oades, 1982). In our study, SOC correlated significantly with MWDSWin the A-horizon, althoughSix et al. (2004)found lower
correlations between SOC content and aggregate stability in tropical soils compared to temperate soils. SOC was a better indicator of variability in MWDSWcompared to HWEC. Thisfinding contrasts with
other studies (He et al., 2008; Kouakoua et al., 1997, Von Lutzow et al.; 2000), where HWEC was better related to aggregate stability than SOC.Kouakoua et al. (1997)) suggested that the quantity of HWEC highly depends on the extraction method i.e. temperature and extraction time. Both SOC and HWEC decreased with increasing soil depth, largely due to the relationship with total RLD and RLDb 0.5
which were significantly higher in the A-horizon compared to the B-horizon. Organic matter from litter input and mixing may also have contributed to higher SOC and HWEC in the shallow soil horizons (Cerdà, 1998). Nevertheless, mean SOC in the B-horizon was still high (12–16 g kg− 1), probably due to past agricultural practices at thefield
site. Total RLD explained 53% of variability in SOC in the A-horizon and veryfine roots (diameter equivalent to or b0.5 mm) explained 60% variability. Roots contribute to SOC through turnover (rate of root growth and decay,Angers and Caron, 1998; Gale et al., 2000) and the exudation of mucilage (Gyssels et al., 2005; Pohl et al., 2009), which is usually greater in veryfine roots (Jastrow et al., 1998). As SOC values were high in our study, potential relationships between FeDCBand
AlDCBoxides and aggregate stability were not evident.Duiker et al. (2003) and Igwe et al. (2009), found that FeDCBand AlDCB oxides
content was similar or higher compared to our results and considered these variables responsible for aggregate stability. However, SOC was twice as low as SOC from our study. Similarly, in a study of 18 plots from tropical or subtropical plots around the world, Barthès et al. (2008)found values for SOC comparable to our results, but FeDCBand
AlDCB oxides quantities were much higher than in the soil we
examined.
4.3. Relationship between aggregate stability and shear strength The values for c andΦ lay within the range for clay soils (Magnan, 1991), although values forΦ were lower than those (11–51°) found for non-zonal soil from a debrisflow in the Yunnan province (Yang et al., 2005). As shear strength within a soil matrix is the result of resistance to movement at interparticle contacts, physical bonds formed across the contact areas and chemical bonds (Craig, 2004), it is to some extent surface dependent and any action that will hinder or promote the cohesive and frictional forces between adjacent particles will invariably affect shear strength (Ayininuola et al., 2009). We found a significant relationship between soil c and MWDSW, the latter often
depending on SOC, root exudates and microbial by-products. Shear strength is thus probably linked to some of the same bonding mechanisms as those involved in aggregation. Therefore, the bonding mechanisms which strengthen aggregates may be similar to those which strengthen interaggregate structure (Bryan, 2000). Thus, vegetation stabilised soil under different hierarchical levels of aggregate organisation (i.e. intra- and inter-aggregate). A similar result was also found byFrei et al. (2003), using triaxial tests on a limited number of samples. These authors demonstrated a significant relationship between c and aggregate stability in moraine soils. Results were attributed to modifications occurring in the soil due to the interactions between roots and fungal hyphae, and presumably subsequent changes in soil chemistry.
Soil cohesion and angle of friction can be influenced temporarily by chemical additions to the soil e.g. calcium sulphate salt, particularly in clay soils which have a large surface area that aids cation and anion
exchange among clay minerals (Ayininuola et al., 2009). Nevertheless, data are scanty and significantly more research could be carried out to understand how plant root exudates alter soil chemical bonds and interparticle contacts, thus effecting shear strength. Roots can also physically modify particle contacts in soil through either loosening effects (Yoo et al., 2011) or by compressing soil through penetration, occurring as they push their way through soil (Bengough et al., 2006). However, as tests in our study were on consolidated soil, the physical effect of roots was probably removed. In conclusion, aggregate stability tests cannot replace triaxial or direct shear tests on soil, but may be used as adequate indicators of a soil's stability. Such tests are easy to carry out and do not require the sophisticated equipment necessary for shear testing. However, more tests are necessary on a wide range of soils in different testing conditions.
Our results suggest that soil protection against erosion processes would be improved if understory species e.g. A. codonocephala were not removed from beneath plantation trees. Although often believed to result in competition with crop trees, the presence of herbaceous and non-woody species in agroforest systems can actually improve tree growth compared to monospecific tree cultivation (Moreno et al. 2007). Our results indicate that mixtures of different functional plant types would also improve soil conservation on slopes by reducing both surface water erosion and shallow substrate mass movement. 5. Conclusion
We investigated how soil aggregate stability and shear strength differed between sites where the tree crop Vernicia fordii had been planted with or without the dominant understory biennial Artemisia codoncephala. Aggregate stability in the A-horizon was improved in the presence of A. codonocephala and when this species was absent, aggregates were significantly unstable. Soil organic carbon and root length density (for roots equivalent to orb0.5 mm in diameter), were the variables best explaining variations in aggregate stability. A significant positive relationship was also found between aggregate stability and soil cohesion but not internal angle of friction. Results suggest that current techniques of land conversion with removal of understory vegetation around tree crops will increase interrill erosion and soil erodibility and may actually be detrimental for slope stability. As we observed that aggregate stability and shear strength were related, our results showed that there was no contradiction between the improving of aggregate stability, thus reducing surface runoff and erosion, and the decrease in the risk of shallow substrate mass movement by improving cohesion. We explained this result by the beneficial effect of roots on aggregate stability, through rhizosphere exudates and microbial by-products, shear strength is thus probably linked to some of the same bonding mechanisms as those involved in aggregation. Therefore, the bonding mechanisms which strengthen aggregates may be similar to those which strengthen interaggregate structure, and hence cohesion.
Acknowledgments
Thanks are due to the Xishuangbanna Tropical Botanical Garden, Kunming, China, and in particular to X Ming, Y Ming and L An, for their technical help. Advice from JL Bellotti (LISAH, France) was much appreciated. Funding was provided from INRA Jeune Equipe project. AMAP (Botany and Computational Plant Architecture) is a joint research unit which associates CIRAD (UMR51), CNRS (UMR5120), INRA (UMR931), IRD (2M123), and Montpellier 2 University (UM27). References
Abid, M., Lal, R., 2008. Tillage and drainage impact on soil quality I. Aggregate stability, carbon and nitrogen pools. Soil and Tillage Research 100, 89–98.
Al-Durrah, M., Bradford, J.M., 1981. New methods of studying soil detachment due to waterdrop impact. Soil Science Society of American Journal 45, 949–953. Amezketa, E., 1999. Soil aggregate stability: a review. Journal of Sustainable Agriculture 14,
83–151. M. Fattet et al. / Catena 87 (2011) 60–69
Angers, D.A., Caron, J., 1998. Plant-induced changes in soil structure: processes and feedbacks. Biogeochemistry 45, 55–72.
Ayininuola, G.M., Agbede, O.A., Franklin, S.O., 2009. Influence of calcium sulphate on subsoil cohesion and angle of friction. Journal of Applied Sciences Research 5, 297–304.
Baize, D., 2000. Guide des analyses en pédologie, 2nd ed. INRA. pp. 169–176. Barthès, B., Roose, E., 2002. Aggregate stability as an indicator of soil susceptibility to
runoff and erosion; validation at several levels. Catena 47, 133–149.
Barthès, B., Kouakoua, E., Larré-Larrouy, M.C., Razafimbelo, T.M., De Luca, E.F., Azontonde, A., Neves, C., De Freitas, P.L., Feller, C., 2008. Texture and sesquioxide effects on water-stable aggregates and organic matter in some tropical soils. Geoderma 143, 14–25.
Bearden, B.N., Petersen, L., 2000. Influence of arbuscular mycorrhizal fungi on soil structure and aggregate stability of vertisols. Plant and Soil 218, 173–183. Bengough, A.G., Bransby, M.F., Hans, J., McKenna, S.J., Roberts, T.J., Valentine, T.A., 2006.
Root responses to soil physical conditions; growth dynamics fromfield to cell. Journal of Experimental Botany 57, 437–447.
Boix-Fayos, C., Calvo-Cases, A., Imeson, A.C., Soriano-Soto, M.D., 2001. Influence of soil properties on the aggregation of some Mediterranean soils and the use of aggregate size and stability as land degradation indicators. Catena 44, 47–67.
Bryan, R.B., 2000. Soil erodibility and processes of water erosion on hillslope. Geomorphology 32, 385–415.
Burri, K., Graf, F., Böll, A., 2009. Revegetation measures improve soil aggregate stability: a case study of a landslide area in Central Switzerland. Forest, Snow and Landscape Research 82, 45–60.
Cao, S., Chen, L., Yu, X., 2009. Impact of China's Grain for Green Project on the landscape of vulnerable arid and semi-arid agricultural regions: a case study in northern Shaanxi Province. Journal of Applied Ecology 46, 536–543.
Cerdà, A., 1998. Soil aggregate stability under different Mediterranean vegetation types. Catena 32, 73–86.
Chan, K.Y., Bowman, A., Oates, A., 2001. Oxidizible organic carbon fractions and soil quality changes in an Oxic Paleustalf under different pasture leys. Soil Science 166, 61–67.
Costa, C., Dwyer, L.M., Hamel, C., Muamba, D.F., Wang, X.L., Nantais, L., Smith, D.L., 2001. Root contrast enhancement for measurement with optical scanner-based image analysis. Canadian Journal of Botany 79, 23–29.
Craig, R.F., 2004. Craig's Soil Mechanics, 7th ed. Spon Press, London. 464 pp. De Baets, S., Poesen, J., Gyssels, G., Knapen, A., 2006. Effects of grass roots on the
erodibility of topsoils during concentratedflow. Geomorphology 76, 54–67. De Baets, S., Poesen, J., Knapen, A., Barbera, G.G., Navarro, J.A., 2007. Root characteristics
of representative Mediterranean plant species and their erosion-reducing potential during concentrated runoff. Plant and Soil 294, 169–183.
Duiker, S.W., Rhoton, F.E., Torrent, J., Smeck, N.E., Lal, R., 2003. Iron (hydr)oxide crystallinity effects on soil aggregation. Soil Science Society of American Journal 67, 606–611.
Eviner, V.T., Chapin, F.S., 2002. The influence of plant species, fertilization and elevated CO2on soil aggregate stability. Plant and Soil 246, 211–219.
Frei, M., Boll, A., Graf, F., Heinimann, H.R., Springman, S., 2003. Quantification of the influence of vegetation on soil stability. Proceedings of the International Conference on Slope Engineering: 8–10 December 2003, Hong Kong, China. Gale, W.J., Cambardella, C.A., Bailey, T.B., 2000. Root-derived carbon and the formation
and stabilization of aggregates. Soil Science Society of American Journal 64, 201–207.
Genet, M., Kokutse, N., Stokes, A., Fourcaud, T., Cai, X.H., Ji, J.N., Mickovski, S., 2008. Root reinforcement in plantations of Cryptomeria japonica D. Don: effect of tree age and stand structure on slope stability. Forest Ecology and Management 256, 1517–1526.
Genet, M., Stokes, A., Fourcaud, T., Norris, J.E., 2010. The influence of plant diversity on slope stability in a moist evergreen deciduous forest. Ecological Engineering 36, 265–275.
Ghani, A., Dexter, M., Perrott, K.W., 2003. Hot-water extractable carbon in soils: a sensitive measurement for determining impacts of fertilisation, grazing and cultivation. Soil Biology and Biochemistry 35, 1231–1243.
Ghestem, M., Stokes, A., Cao, K., Ma, W., Xie, J., 2009. Using vegetation to stabilize steep slopes in Southern China: root biomechanics as a factor in the choice of species. In: Thibaut, B. (Ed.), 6th Plant Biomechanics Conference, Cayenne, French Guyana, 16–21 November 2009, pp. 450–455.
Ghestem, M., Sidle, R.C., Stokes A., in press. The influence of plant root systems on subsurfaceflow: implications for slope stability. BioScience.
Ghidey, F., Alberts, E.E., 1997. Plant root effects on soil erodibility, splash detachment, soil strength, and aggregate stability. American Society of Agricultural Engineers 40, 129–135.
Goh, K.M., 2004. Carbon sequestration and stabilization in soils: implications for soil productivity and climate change. Soil Science and Plant Nutrition 50, 467–476.
Gyssels, G., Poesen, J., Bochet, E., Li, Y., 2005. Impact of plant roots on the resistance of soils to erosion by water: a review. Progress in Physical Geography 29, 189–217. Haynes, R.J., Beare, M.H., 1997. Influence of six crop species on aggregate stability and
some labile matter fractions. Soil Biology and Biochemistry 29, 1647–1653. Haynes, R.J., Francis, G.S., 1993. Changes in microbial biomass C, soil carbohydrate
composition and aggregate stability induced by growth of selected crop and forage species underfield conditions. Journal of Soil Science 44, 665–675.
He, Y., Xu, Z.H., Chen, C.R., Burton, J., Ma, Q., Ge, Y., Xu, J.M., 2008. Using light fraction and macro-aggregate associated organic matters as early indicators for management-induced changes in soil chemical and biological properties in adjacent native and plantation forests of subtropical Australia. Geoderma 147, 116–125.
Igwe, C.A., Zarei, M., Stahr, K., 2009. Colloidal stability in some tropical soils of southeastern Nigeria as affected by iron and aluminium oxides. Catena 77, 232–237.
Jastrow, J.D., Boutton, T.W., Miller, R.M., 1996. Carbon dynamics of aggregate-associated organic matter estimated by carbon-13 natural abundance. Soil Science Society of America Journal 60, 801–807.
Jastrow, J.D., Miller, R.M., Lussenhop, J., 1998. Contributions of interacting biological mechanisms to soil aggregate stabilization in restored prairie. Soil Biology and Biochemistry 30, 905–916.
Kalra, Y.P., Maynard, D.G., 1991. Methods manual for forest soil and plant analysis. Forestry Canada., Northwest region. Information report NOR-X-319. Northern forestry center, Edmonton, Alberta, pp. 46–54.
Kouakoua, E., Sala, G.H., Barthès, B., Larré-Larrouy, M.C., Albrecht, A., Feller, C., 1997. La matière organique soluble à l'eau chaude et la stabilité de l'agrégation. Aspects méthodologiques et application à des sols ferrallitiques du Congo. European Journal of Soil Science 48, 239–247.
Le Bissonnais, Y., 1996. Aggregate stability and assessment of soil crustability and erodibility: I. Theory and methodology. European Journal of Soil Science 47, 425–437.
Le Bissonnais, Y., De Noni, G., Blavet, D., Laurent, J.-Y., Asseline, J., Chenu, C., 2007. Erodibility of Mediterranean vineyard soils: relevant aggregate stability methods and significant soil variables. European Journal of Soil Science 58, 188–195. Legout, C., Leguedois, S., Le Bissonnais, Y., 2005. Aggregate breakdown dynamics under
rainfall compared with aggregate stability measurement. European Journal of Soil Science 56, 225–237.
Li, X.G., Li, F.M., Zed, R., Zhan, Z.Y., Singh, B., 2007. Soil physical properties and their relations to organic carbon pools as affected by land use in an alpine pastureland. Geoderma 15, 98–105.
Liang, Y., Li, D.C., Su, C.L., Pan, X.Z., 2009. Soil erosion assessment in the red soil region of Southeast China using an integrated index. Soil Science 174, 574–581.
Liu, G., Xua, M., Ritsemac, C., 2003. A study of soil surface characteristics in a small watershed in the hilly, gullied area on the Chinese Loess Plateau. Catena 54, 31–44. LY/T 1210~1275, 1999. Determination of organic matter in forest soil and calculation of carbon–nitrogen ratio. Forestry industry standard of the People's Republic of China. Forestry office, People's Republic of China.
Magnan, J.P., 1991. Résistance au cisaillement. Ed Techniques de l'ingénieur, Paris C216, 1–24.
Martinez-Mena, M., Deeks, L.K., Williams, A.G., 1999. An evaluation of a fragmentation fractal dimension technique to determine soil erodibility. Geoderma 90, 87–98. Mehra, O.P., Jackson, M.L., 1960. Iron oxide removal from soils and clays by a
dithionite-citrate system buffered with sodium bicarbonate. Clay Mineral 7, 317–327. Moreno, M.G., Obrador, J.J., García, E., Cubera, E., Montero, M.J., Pulido, F., Dupraz, C.,
2007. Driving competitive and facilitative interactions in oak dehesas through management practices. Agroforestry Systems 70, 25–40.
Nearing, M.A., West, L.T., 1988. Soil strength indexes as indicators of consolidation. American Society of Agricultural Engineers 31, 471–476.
NF X 31–515, 2005. Measurement of the stability of soil aggregates for the evaluation of soil susceptibility to surface crusting and water erosion. Afnor, Paris.
Pohl, M., Alig, D., Körner, C., Rixen, C., 2009. Higher plant diversity enhances soil stability in disturbed alpine ecosystems. Plant and Soil 324, 91–102.
Schuppener, B., Bohàč, J., Dysli, M., 1999. Laboratory methods for direct shear tests. Recommendation of the ISSMGE for geotechnical testing. Beuth Verlag GmbH, Germany, pp. 87–92.
Six, J., Bossuyt, H., Degryze, S., Denef, K., 2004. A history of research on the link between (micro)aggregates, soil biota, and soil organic matter dynamics. Soil and Tillage Research 79, 7–31.
Sparling, G., Vojvodic-Vukovic, M., Schipper, L.A., 1998. Hot-water-soluble C as a simple measure of labile soil organic matter: the relationship with microbial biomass C. Soil Biology and Biochemistry 30, 1469–1472.
Stokes, A., Atger, C., Bengough, A.G., Fourcaud, T., Sidle, R.C., 2009. Desirable plant root traits for protecting natural and engineered slopes against landslides. Plant and Soil 324, 1–30.
Stokes, A., Sotir, R.B., Chen, W., Ghestem, M., 2010. Soil bio- and eco-engineering in China, past experience and present priorities. Ecological Engineering 36, 247–257. Terzaghi, K., 1942. Theoretical soil mechanics. Wiley, New York.
Tisdall, J.M., Oades, J.M., 1982. Organic matter and water-stable aggregates in soils. Journal of Soil Science 33, 141–163.
Trac, C.J., Harrell, S., Hinckley, T.M., Henck, A.C., 2007. Reforestation programs in Southwest China: reported success, observed failure, and the reasons why. Journal of Mountain Science 4, 275–292.
Von Lutzow, M., Leifeld, J., Kainz, M., Kogel-Knabner, I., Munch, J.C., 2000. Indications for soil organic matter quality in soils under different management. Geoderma 105, 243–258.
Wander, M.M., Yang, Z., 2000. Influence of tillage on the dynamics of loose- and occluded-particulate and humified organic matter fractions. Soil Biology and Biochemistry 32, 1551–1560.
Wang, F.X., Wang, Z.Y., Lee, J., 2007. Acceleration of vegetation succession on eroded land by reforestation in a subtropical zone. Ecological Engineering 31, 232–241. Watson, D.A., Laflen, J.M., 1986. Soil strength, slope and rainfall effects of interrill
erosion. Transactions of the ASAE 29, 98–102.
Weyerhaeuser, H., Wilkes, A., Kahrl, F., 2005. Local impacts and responses to regional forest conservation and rehabilitation programs in China's northwest Yunnan province. Agricultural Systems 85, 234–253.
Yang, Y., Zhang, J., Zhang, J., Liu, S., Wang, C., Xiao, Q., 2005. Impacts of soils moisture content and vegetation on shear strength of unsaturated soil. Wuhan University Journal of Natural Sciences 10, 682–688.
Yoo, G., Yang, X., Wander, M.M., 2011. Influence of soil aggregation on SOC sequestration: a preliminary model of SOC protection by aggregate dynamics. Ecological Engineering. 37, 487–495.
Yu, D.S., Shi, X.Z., Weindorf, D.C., 2006. Relationship between permeability and erodibility of cultivated Acrisols and Cambisols in subtropical China. Pedosphere 16, 304–311. Zhang, B., Horn, R., 2001. Mechanisms of aggregate stabilization in Ultisols from
subtropical China. Geoderma 99, 123–145.
Zhang, T.L., Zhao, Q.G., Zhai, Y.S., Chen, B.F., Sun, B., 1995. Sustainable land use in the hilly red soil region of South-eastern China. Pedosphere 5, 1–10.
Zhang, B., Yang, Y.S., Zepp, H., 2004. Effects of vegetation restoration on soil and water erosion and nutrient losses of a severely eroded clayey Plinthudult in southern China. Catena 57, 77–90.
Zhou, Y., Watts, D., Li, Y., Cheng, X., 1998. A case study of effect of lateral roots of Pinus yunnanensis on shallow soil reinforcement. Forest Ecology and Management 103, 107–120.
Zobel, R.W., 2008. Hardware and software efficacy in assessment of fine root diameter distributions. Computers and Electronics in Agriculture 60, 178–189.