Distressed Conversions by
Canan Ceylan Safar
B.S. Architecture, Yildiz Technical University, 1996 Istanbul, Turkey
and Daniel Pollard
B. S. Business Administration, Babson College, 2002 Wellesley, MA
Submitted to the Program in Real Estate Development in Conjunction with the Center for Real Estate in Partial Fulfillment of the Requirements for the Degree of Master of Science in Real Estate
Development at the
Massachusetts Institute of Technology September 2012
© 2012 Canan Ceylan Safar and Daniel Pollard. All Rights Reserved
The authors hereby grant to MIT permission to reproduce and to distribute publicly paper and electronic copies of this thesis document in whole or in part in any medium now known or hereafter created.
Signature of Author__
Canan Ceylan Safar Center for Real Estate
July 30, 2012 Signature of Author_
Daniel Pollard Center for Real Estate
July 30, 2012 Certified by William Wheaton Professor of Economics Thesis Supervisor Accepted by David M. Gelie
Distressed Conversions
by
Canan Ceylan Safar
and
Daniel Pollard
Submitted to the Program in Real Estate Development in Conjunction with the Center for Real Estate on July 30, 2012 in Partial Fulfillment of the Requirements for the Degree of Master of
Science in Real Estate Development
ABSTRACT
This thesis analyzes condominium and apartment development in the downtown Chicago residential market between 1997 and 2011. Specifically, it focuses on developments that converted from apartments to condominiums mainly during the boom years between 1997 and 2007 and developments that converted from condominiums to apartments during the bust years between 2008 and 2011. In the case of the latter, this thesis seeks to determine the reason or reasons that these developments had to convert from condominiums to apartments through a detailed analysis of four such developments. This analysis addresses development drivers including timing, pricing, and location. Additionally, this thesis considers the overall market conditions including supply, demand, economics, and demographics to determine what caused the boom and the ultimate bust of the market and these developments.
TABLE OF CONTENTS CHAPTER 1: INTRODUCTION ... 7 1.1 Thesis Objective...- ... ---...--- 7 1.2 M ethodology... ---...-- 7 1.3 Data Sources ...---...--- -7 1.4 M ajor Findings... ... -... 8 1.5 Thesis Structure...8
CH APTER 2: ECO NO M Y AND DEM O G RAPH ICS...10
2.1 Geographic Areas... ... 10
2.1.1 The Chicago-Joliet-Naperville, IL-IN-WI Metropolitan Statistical Area ... 10
2.1.2 Downtown Chicago ... 10
2.2 Econom y ...---- .. . ---... 14
2.2.1 Population ...-- ...--- 14
2.2.2 Employm ent...----....-. . ---... 17
2.2.3 M edian Household Income ... 20
2.3 Other Dem ographics...22
2.3.1 Households by Type ... 22
2.3.2 Households by Income... ... ... 23
2.3.3 Population by Age ... 24
2.3.4 Total Housing Units by Occupancy... 25
2.3.5 Households by Tenure and M ortgage Status... 26
2.4 Chapter Summ ary...26
CHAPTER 3: DOWNTOWN CHICAGO RESIDENTIAL MARKET...28
3.1 Downtown Chicago Residential Statistics... 28
3.1.1 Apartm ent & Condominium Stock...28
3.1.2 Apartment Stock...29
3.1.3 Condom inium Stock ... 30
3.1.4 Year-End Occupancy... 31
3.1.5 Year-End Effective Rent... 32
3.1.6 Year-End Occupancy vs. Effective Rent ... 33
3.1.7 Condominium Sales Prices ... 33
3.2 Downtown Chicago Residential M arket Period Summ aries... 36
3.2.1 Condominium M arket (1997-2005)...36
3.2.2 Apartment M arket (1997-2005) ... 38
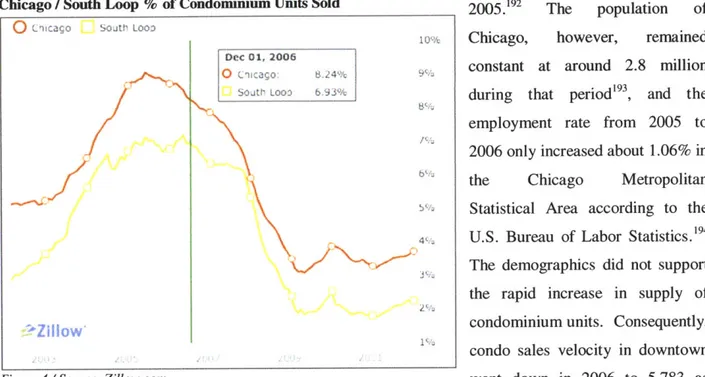
3.2.3 Condominium M arket (2006)...40
3.2.4 Apartm ent M arket (2006) ... ... 40
3.2.5 Condom inium M arket (2007)... ... 41
3.2.6 Apartm ent M arket (2007) ... 42
3.2.10 Apartm ent M arket (2009) ... 45
3.2.11 Condom inium M arket (2010) ... 45
3.2.12 Apartm ent M arket (2010) ... 46
3.2.13 Condom inium M arket (2011) ... 47
3.2.14 Apartm ent M arket (2011) ... 47
3.3 Chapter Sum m ary...48
CHAPTER 4: SAMPLE ANALYSIS OF DOWNTOWN DEVELOPMENTS ... 49
4.1 Sam ple D escription ... 49
4.2 Sam ple D evelopm ents by U se and Conversion ... 50
4.3 Sample Conversions by Location and Year Built ... 52
4.4 Sample D evelopm ents with Financial D istress ... 54
4.5 Chapter Sum m ary...56
CH A PTER 5: CASE STUD IES... 58
5.1 M ethodology and Analysis of the Cases ... 58
5.2 The Residences at Burnham Pointe... 59
5.3 Trio Condom inium s ... 72
5.4 Lexington Park Condom inium s ... 88
5.5 Astoria Residences and Spa...101
CHAPTER 1: INTRODUCTION 1.1 Thesis Objective
The objective of this thesis is to analyze condominium and apartment development in the downtown Chicago residential market between 1997 and 2011. Specifically, it will focus on developments that converted from apartments to condominiums mainly during the boom years between 1997 and 2007 and developments that converted from condominiums to apartments during the bust years between 2008 and 2011. In the case of the latter, this thesis seeks to determine the reason or reasons that these developments had to convert from condominiums to apartments through a detailed analysis of four such developments. This analysis addresses development drivers including timing, pricing, and location. Additionally, this thesis considers the overall market conditions including supply, demand, economics, and demographics to determine what caused the boom and the ultimate bust of the market and these developments. This thesis will examine the relationship between condominium pricing and apartment rents to determine if there was a pricing bubble in the market.
1.2 Methodology
This thesis was completed primarily through information gathering and analysis. The methodology included several major steps. First, developments built between 2001 and 2011 were identified and then reviewed to determine which ones converted from apartments to condominiums or from condominiums to apartments. Second, the economic and demographic trends of the area were analyzed to better understand the supply and demand characteristics in the market. Third, the real estate market was quantitatively and qualitatively studied to understand the macro and micro conditions of the boom and bust. Fourth, a sample of developments was examined to understand the extent and characteristics of conversion activity and financial distress for developments in the market. Fifth, four developments were selected as case studies to understand the effects of the boom and bust on a property-level basis and to determine the related financial implications for involved parties.
1.3 Data Sources
This thesis utilized data from numerous sources. The major sources data, however, were CBRE Econometric Advisors, Appraisal Research Counselors, Esri, and Crain's Chicago Business. CBRE
consulting firm focusing on the Chicago market, provided information and statistics for the downtown Chicago real estate market as well as individual developments. Esri, a provider of geographically-driven information and analysis, provided economic and demographic information. Crain's Chicago Business, the nation's preeminent regional business newspaper, provided market and development statistics, analysis, and commentary. Other data sources included local and national websites and publications. Additionally, interviews were conducted with various market participants including developers, owners, consultants, and media reporters to gain a more thorough understanding of the entire market and
individual developments.
1.4 Major Findings
The downtown Chicago residential market development boom was supported by demand from strong economics and demographics trends. The demand that drove the boom from 1997 through 2007, however, was ultimately weakened for a numerous reasons but especially pricing. In a sample of three neighborhoods, condominium prices increased at a significantly higher rate than apartment rents, which suggests that there was a price bubble in the downtown Chicago residential market. While condominiums may have become excessively overpriced during the boom, the market stock does not appear to have been grossly overbuilt. Based on historic and projected downtown population growth, all of the downtown stock would have been absorbed by 2012. Nevertheless, the decrease in demand resulted in several condominium developments converting to apartments with many of these properties experiencing financial distress and taking financial losses.
1.5 Thesis Structure
This thesis consists of this introduction chapter and five other chapters. Chapter 2 focuses on the economy and economy and demographics for main two geographic areas: the Chicago-Joliet-Naperville, IL-IN-WI Metropolitan Statistical Area and downtown Chicago. It compares the population, employment, household median income, and other select demographics between the two areas. Chapter 3 focuses on the downtown Chicago residential market between 1997 and 2011 with an emphasis on the condominium and apartment markets. It includes historical statistics and single and multi-period market summaries. Chapter 4 analyzes a 145-property sample of apartment and condominium developments built in downtown Chicago between 2000 and 2011. It focuses on developments that were either converted from condominiums to apartments or from apartments to condominiums in response to changing market conditions. It also inventories for developments that became financially distressed.
Chapter 5 presents cases studies for four developments that converted from condominiums to apartments. It analyzes the financial impact on the developments from the conversions and considers factors that contributed to the conversions including timing, location, and pricing. Chapter 6 is the thesis conclusion, which considers the information and analysis presented in the previous four chapters.
CHAPTER 2: ECONOMY AND DEMOGRAPHICS
This chapter focuses on the economy and demographics for main two geographic areas: the Chicago-Joliet-Naperville, IL-IN-WI Metropolitan Statistical Area and downtown Chicago. The employment discussion, however, focuses on the "urban core" area, which is defined by CBRE Econometric Advisors. This area is marginally larger than the downtown area, but it is similar enough for this analysis.
For the economy this chapter considers three main statistics: population, employment and household median income. The population and household median income statistics were measured in 1990, 2000 and 2010 whereas the employment statistics were measured in 1994, 1999, 2004, and 2009. In addition to these three economic statistics, this chapter considers select demographic statistics that are useful for this analysis.
2.1 Geographic Areas
2.1.1 The Chicago-Joliet-Naperville, IL-IN-WI Metropolitan Statistical Area
The Chicago-Joliet-Naperville, IL-IN-WI Metropolitan Statistical Area ("MSA") consists of 14 counties across Illinois (8), Indiana (4), and Wisconsin (2). It is the third largest Metropolitan Statistical Area in the country behind Los Angeles-Long Beach-Santa Ana, CA and New York-Northern New Jersey-Long
Island, NY-NJ-PA. 1 The MSA includes the city of Chicago.
2.1.2 Downtown Chicago
Downtown Chicago ("downtown") is an approximate 6.41 square-mile area in the city of Chicago and corresponds with the six submarkets that form the downtown Chicago residential market as defined by Appraisal Research Counselors. The six submarkets are Gold Coast/Near North, South Streeterville, River North, West Loop/West River, The Loop/New Eastside, and the South Loop. The area is generally bordered by Chicago Avenue and Division Street on the north, Lake Michigan on the east, Cermak Road and the Eisenhower Expressway on the south, and the Chicago River and Ashland Avenue on the west.2 The downtown is situated within the MSA. A brief description of each submarket is as follows:
Gold Coast/Near North is located north of River North and Streeterville. It is bordered by Chicago Avenue to the north, Lake Shore Drive to the east, Chicago Avenue to the south, and the Chicago River to the west.3
In the late 1800s, much of the area was known as the "Astor Street District" after Astor Street. After the Great Chicago Fire in 1871, Potter Palmer, who was living on the affluent and established Prairie Avenue south of the business district, began purchasing land in the area, which was still sparsely populated and largely swampland. In 1875, when a portion of Lake Shore Drive was completed, the area increased in popularity and affluent families located to the area and built large residences. In the late 1800s and early 1900s, the area supplanted Prairie Avenue as the residential locale for Chicago's leaders in social, cultural, and economic activities.4
Today, Gold Coast/Near North is the city's premier residential area. It has a range of residential uses including ranging from historic mansions, brownstones and graystones to modern condominium towers.5 Gold Coast/River North is also renowned for shopping as it connects with the Magnificent Mile, the city's premiere retail destination.
The Loop/New Eastside
The Loop/New Eastside is bordered by Chicago River on the north and west, Lake Michigan on the east, and Congress Street on the south.
The Loop section of this area is the center of downtown Chicago. Aside from being Chicago's central business district and center seat of government, the Loop includes the city's premier theatre district, which includes the Goodman Theatre, the Lyric Opera House, the Chicago Symphony Orchestra, the Cadillac Palace Theatre, the Ford Center for the Performing Arts, the Bank of America Theatre, and the Chicago Theatre.6 While it was historically comprised of office buildings, hotels, and retail stores, the Loop has emerged as a residential area with many condominiums and apartments building within the last
15 years.
The New Eastside section of this area is situated northeast of the Loop. It is the city's newest neighborhood having been developed along with Millennium Park atop a railroad yard. While somewhat
six-acre Lakeshore East Park. For housing, New Eastside offers primarily new townhouses and modern high-rise apartments and condominiums.7
Additionally, the Loop/New Eastside is the location of two major parks, Grant Park and Millennium Park,8 well as the city's second major shopping district, The Magnificent Mile, and a major museum, Art Institute of Chicago.9
River North
River North is located directly north of the Loop. It is bordered by the Chicago River on the south and west, Division Street on the north, and Wabash Avenue on the east.'0
In the late 1800s, the area was a center of industry with rail and port activities, but from the 1920s through the 1970s, the area was abandoned by industry and became an urban wasteland and the city's "red light district". In the 1980s, however, artists and other creative types moved into the area for its inexpensive loft space. In the 1990s, the area gentrified bring additional residential from new construction and rehabilitations. Additionally, more professional firms including those in law, architecture, design, and advertising located to the area. In the 2000s, the area attracted 10,000 new condominiums and 25,000 new residents. "
Today, River North is now one of the city's premier destinations for living, dining, shopping, nightlife and the arts. There are several subsection of River North including the Cathedral District and the Gallery District. The Cathedral District is the location Holy Name Cathedral and St. James Cathedral,1 2 while the Gallery District is a concentration of art, craft, and design-related activities.'3
West Loop / River West
West Loop/River West is located directly west of the Loop. It is generally bordered by Chicago Avenue on the north, the Chicago River on east, the Eisenhower Expressway on the south, and Ashland Avenue on the west. The south and west borders, however, are expanding with new development. 4
In the 1800s and 1900s, the area served primarily as a market district with wholesale food activities, especially meatpacking. In recent times, however, much of industry was replaced by residential as artist
moved into the area for inexpensive loft space for housing and galleries. As the art scene thrived, the area attracted more residential and commercial investment 15
Today, the West Loop/River West is a thriving, less-expensive option to River North.'6 It is also considered to the city's most "urban" neighborhood. 17 The area is the location of the United Center where the Chicago Bulls and Chicago Blackhawks play games.1 8 For housing, the area has a mix including renovated industrial lofts building and modern, high-rise residential towers.19
South Streeterville
South Streeterville is located just northeast of the Loop. It is bordered by the Chicago River on the south, Michigan Avenue on the west, Chicago Avenue on the north and Lake Michigan on the east.
In the late 1800s, much of the area was under water until after the Great Fire of 1871 when it became a dumping ground for construction debris that turned it into a landfill which then became a shantytown. Soon thereafter, nearby landowners developed a road through the area to connect downtown with the North Side. The road became Lake Shore Drive and attracted development to the area. In the 1920s, with the construction of the Michigan Avenue Bridge and subsequent commercial development of Michigan Avenue, South Streeterville became the most valuable real estate in Chicago. Between the late 1940s and later 1970s, the area was heavily developed with mixed-use high-rise buildings including the John Hancock Center in 1969 and Water Tower Place in 1976. Soon thereafter, residential development ensued and still continues today. 20
Today, Streeterville is one of the city's busiest neighborhoods in part because of its many attractions including the Magnificent Mile, Navy Pier, and the Museum of Contemporary Art.2' For housing, South
Streeterville offers primarily vintage and modern high-rise apartments and condominiums.
South Loop
The South Loop is located directly south of the Loop. It is bordered by Congress Parkway on the north, Lake Michigan on the east, Cermak Road on the south, and the Chicago River on the west.
still flourishing, Chicago became the country's printing center, so large loft buildings were constructed in what would become known as Printer's Row. In time, however, with changes in transportation and technology, the area was abandoned by much of industry, and the area languished.24
In the mid-1900s, as the Loop built out, developers moved to redevelop the South Loop. It has become one of the city's most heralded large-scale redevelopments as industrial buildings that survived the Great Chicago Fire have been repurposed for residential and other uses. The South Loop also encompasses several residential sections including Printer's Row and Dearborn Park. The area includes popular tourist attractions such as Grant Park, the Field Museum, Shedd Aquarium, and Adler Planetarium, as well as two schools, Columbia College and the School of Art Institute. For housing, the South Loop offers condominiums, lofts, single-family homes, and townhouses.
2.2 Economy 2.2.1 Population MSA Population 9,500,000 9,300,000 9,100,000 -8,900,000 8,700,000 -8,500,000 -8,300,000 - -8,100,000 1990 ;;i 100% 05 90% - 80% 70% 60% 50% 40% - 30% o 20% 10% - 0% 2010 2000
S10-Year Change -ih-- Total Change Source: Esri
Between 1990 and 2010, the MSA population increased by 1,279,029 people or 15.6% to 9,461,105 from
1,882,076. The increase between the first and second ten-year periods, however, was significant. From
1990 through 2000, the population increased by 11.2% or 916,240 people to 9,098,316, while from 2001 through 2011, it only increased by 4.0% or 362,789 people to 9,461,105. In total, 71.6% of the MSA population growth over the 20-year period occurred during the first 10 years, while 28.4% was in the
second 10 years. Though the MSA still had overall growth from 1990 through 2010, the trend during the 20-year period, especially during the second half of it, is noteworthy and possibly concerning. If the population growth again decreased by 553,451 people as it did between 2000 and 2010, the MSA would lose overall population.
Downtown Population 160,000 -150,000 140,000 -130,000 120,000 110,000 100,000 90,000 80,000 19 156,18 1 .5 109,315 42.9% 6,04827.0% 90 2000 201 90% 80% 70% 60% 50% 40% 30% 20% 10% 0% 0
-0-MPopulation -0-10-Year Change --- Total Change
Source: Esri
Between 1990 and 2010, the downtown population increased by 70,136 people or 81.5% to 156,184 from
86,048. While 81.5% growth during the 20-year period is significant, it was based on a relatively small
population of 86,048 people in 1990. The important statistic is that while the percentage growth was substantial during the first and second ten-year period, it was actually stronger during the latter one. From 1990 through 2000, the population increased by 27.0% or 23,237 people to 109,315 whereas it increased by 42.9% or 46,869 to 565,184 between 2000 and 2010. In total, 66.8% of the total percentage
growth occurred during the second-ten year period on a larger base population.
-MSA vs. Downtown Population Growth 100% --- 90% -80% ---70% 60% ---50% --- 42.9% 40% 10% 1990 2000 2010
--- MSA Total Change --- Downtown Total Change --- MSA 10-Year Change -- *--Downtown 10-Year Change
Source: Esri
The MSA and the downtown both had strong overall population growth from 1990 through 2010. While the population of the downtown area increased much faster on a percentage basis than the MSA, it was mainly due to its 1990 population being 156,184 people, which represented only 1.9% of the 8,182,076 people in the MSA at that time. While the downtown population increased by 70,136 people, that of the
MSA increased by 1,279,029 people, so there were 1,208,893 people that moved into the MSA, but not
the downtown area. What is not clear in these immediate statistics, however, is how many of those
1,208,893 people moved to within Chicago and not the surrounding suburban area. As previously
mentioned, however, the MSA population growth rate from 2000 through 2010 was low compared with
1990 through 2010. With the Chicago area being the population and economic center of the Midwest, the
population growth rate albeit positive, may be a cause for concern. In any case, in a basic comparison between the MSA and downtown, the downtown population increased at a significantly higher rate than did the MSA which supports the "return to the city" movement and is positive for the downtown and city.
2.2.2 Employment MSA Employment 3,800,000 -3,700,000 -3,600,000 -3,500,000 3,400,000 -3,300,000 3,200,000 1994 1999
-- o-Employment -a-5-Year % Growth Total % Growth Source: CBRE Econometric Advisors
Between 1994 and 2009, the MSA employment increased by 321,147 (or 9.8%) jobs to 3,613,012 from
3,291,865. The growth during each of the three 5-year periods, however, was inconsistent. From 1994
through 1999, the employment increased by 12.9% or 423,444 jobs to 3,715,309. This period had the highest growth in both the number and percentage of jobs and it accounted for 99.3% of the total gained employment during the 15-year period. Between 2000 and 2004, the MSA employment increased by only 2,780 jobs or 0.1% to 3,718,089. These 2,780 jobs accounted for 0.7% of the total gained job during the 15-year period. From 2005 through 2009, the MSA employment decreased by 2.8% or 105,077 jobs. With no growth during this period, it was the worst performing period of the three.
- 14% 12% 10% 8% 2 6% 4% - 2% 0% -2% - -4% 2009 2004
Urban Core Employment 720,000 14% 10.8% 700,000 697, 57, 8.% 680,000 2 4% 660,000 666.896 2% eolo 0% 640,000 -~-2% 620,000 - 1 -6% 1994 1999 2004 2009
-1--Employment -'-5-Year % Growth -- Total % Growth
Source: CBRE Econometric Advisors
Between 1990 and 2010, urban core employment increased by 80,886 people or 12.9% to 710,002 from
629,116. The growth during each of the three 5-year periods was not consistent. Between 1994 and
1999, the employment increased by 10.8% or 68,199 jobs to 697,315. The growth during this period was the highest for total and percentage of jobs. It accounted for 61.3% of the total employment increase during the 15-year period. From 2000 through 2004, the urban core lost 30,419 jobs or 4.4% of the employment. It was lowest and only negative period of job growth. The urban core gained 43,106 jobs between 2005 and 2009. Those 43,106 jobs accounted for 38.7% of the total employment for the 15-year period and represented a net gain of 12,687 jobs since 2000.
MSA vs. Urban Core Employment 14% 12% 10% 8% 6% 4% 2% 0% -2% -4% -6% - 12.9% - - - - - -12.9%0, 10.8%0.1% 4.4%% 1994 1999 2004 2009
-- MSA Total % Growth -*-Urban Core Total % Growth
--- MSA 5-Year Period % Growth - Urban Core 5-Year % Growth
Source: CBRE Econometric Advisors
From 2004 through 2009, while the MSA lost 105,077 (-2.8%) jobs, the urban core gained 43,106 (6.5%). There are numerous possibilities for this statistic including (1) urban core employment may have grown organically from within, (2) employment relocated to the urban core from other parts of the MSA, or (3) employment located to the urban core from outside of the MSA, but the number of jobs was not enough to offset the overall MSA employment loss. During the 15-year period, the number of jobs created in the each the MSA and urban core was marginally disproportionate the total number of jobs in each. As of
2009, employment in the urban core was 710,002, which represented 19.7% of the employment in the MSA. Between 1994 and 2009, the urban core gained 80,886 jobs, which was 25.2% of the jobs created
in the MSA. Likewise, the MSA had employment of 3,613,012 in 2009. This number represented 80.3% of the non-urban core jobs in the MSA. From 1994 through 2009, the non-urban core MSA gained 321,147 jobs, which represented 74.8% of the total jobs in the MSA. Ultimately, the downtown employment increased at a higher rate than did the MSA between 1994 and 2009, which like the population comparison between the MSA and downtown, demonstrates a trend of supports the "return to the city" movement.
2.2.3 Median Household Income
MSA Median Household Income
$60,000 $55,000 $50,000 $45,000 $40,000 $35,000 N 1990 2000
-on-Median Household Income -- *-Total % Change -as- 10-Year % Change Source: Esri
Between 1990 and 2010, the MSA median household income increased by $21,600 or 60.3% to $57,427 from $35,827. The increase between 1990 and 2000 was significantly greater than the increase between 2000 and 2010. Between 1990 and 2000, the MSA median household income increased by $15,401 or 43.0% to $51,228 from $35,827, while it only increased by $6,199 or 12.1% to $57,427 through 2010. The $15,401 increase from 1990 through 2000 and the $6,199 increase between 2000 and 2010 accounted for 71.3% and 28.7%, respectively, of the total increase during the 20-year period.
$65,000 --$60,000 --$55,000 -$50,000 -$45,000 ~ $40,000 $35,000 -1990
Downtown Median Household Income
2000
Median Household Income --- 10-Year % Change --- Total % Change 201( 100% 90% 80% 70% 60% 50% 40% 30% 20% 10% 0% Source: Esri -- 100% 90% -- 80% 70% 60% 50% -~40% 30% -- 20% 10% 20% 2010
Between 1990 and 2010, the downtown median household income increased by $25,682 or 67.9% to $63,492 from $37,810. The increase between 1990 and 2000 was significantly greater than the increase between 2000 and 2010. From 1990 through 2000, the downtown median household income increased by $20,468 or 54.1% to $58,278 from $37,810, while it only increased by $5,214 or 8.9% to $57,427 through 2010. The $20,468 increase from 1990 through 2000 accounted for 79.7% of the total $25,682 increase during the 20-year period, while the $5,214 increase between 2000 and 2010 accounted for the other
20.3%. In 1990, the downtown median household income was 5.5% greater than the MSA median area
income and the spread increased to 10.6% in 2010.
MSA vs. Downtown Median Household Income
$65,000 $60,000 $55,000 $50,000 $45,000 $40,000 $35,000 V 1990 -- Downtown Income
-4--MSA 10-Year % Change
2000
--- MSA Income - -MSA Total % Change --a-- Downtown 10-Year % Change --- Downtown Total % Change Source: Esri - 100.0% 90.0% 80.0% 70.0% 60.0% 3% - 50.0% 40.0% 30.0% 20.0% 10.0% 0.0% 2010
2.3 Other Demographics
2.3.1 Households by Type
Household Type MSA Downtown
Total Households 3,475,726 100% 93,624 100%
Household with 1 Person 947,115 27.2% 53,603 57.3%
Household with 2+ Person 2,528,611 72.8% 40,020 42.7%
Family Households 2,307,715 66.4% 28,059 30.0%
Families Husband-Wife 1,663,565 47.9% 22,779 24.3%
Children With Own 774,345 22.3% 5,428 5.8%
Spouse) Other Family (No 644,150 18.5% 5,280 5.6%
Children With Own 315,711 9.1% 2,183 2.3%
Non-Family Households 220,896 6.4% 11,961 12.8%
All Households with Children 1,216,550 35.0% 8,079 8.6%
Multigenerational Households 178,372 5.1% 509 0.5%
Unmarried Partner Households 214,258 6.2% 6,848 7.3%
Male-Female 188,907 5.4% 5,895 6.3%
Same-Sex 25,351 0.7% 953 1.0%
Average Household Size 2.68 1.58
Source: Esri
Of all downtown households, 57.3% are occupied
is 27.2%. On a percentage basis, the downtown
MSA because of single-person households. This:
by only one person compared with the MSA, where it
requires more than twice as much housing as does the statistic when considered with the growing population, especially over the last 10 years, demonstrates a strong market for downtown housing. Furthermore, the average household size downtown for this measurement is 1.58 compared with 2.68 in the MSA. In result, for every five people in the downtown, 3.16 units of housing are required whereas that number is
1.86 in the overall MSA. These statistics not only demonstrates demand for smaller units such as
apartments and condominiums, but it also shows there is a more demand on a percentage basis for more total units of housing.
2.3.2 Households by Income
Household Income MSA Downtown
<$15,000 406,660 11.7% 15,167 16.2% $15,000 -$24,999 326,718 9.4% 7,120 7.6% $25,000 - $34,999 316,291 9.1% 6,228 6.7% $35,000 -$49,999 444,893 12.8% 9,298 9.9% $50,000 -$74,999 636,058 18.3% 14,402 15.4% $75,000 - $99,000 469,223 13.5% 10,653 11.4% $100,000 -$149,000 500,505 14.4% 11,762 12.6% $150,000+ 375,378 10.8% 18,994 20.3% Total 3,475,726 100% 93,625 100% Median Household Income $57,427 $63,492 Average Household Income $77,623 $94,489
Per Capita Income $29,069 $58,288
Source: ESRI
As previously discussed, the downtown median area income of $63,492 is 10.6% greater than $57,427 of the MSA. Additionally, the former increased by 67.9% from 1990 through 2010, while the latter increased by 60.3% during the same time period. The downtown average income household income of $94,489, however, is 21.7% greater than the MSA where it is $77,623. The higher average household income in the downtown results from a greater percentage of its households being in the higher income brackets. In the downtown, 32.9% of households have incomes greater than $100,000 including 20.3% with incomes greater than $150,000. Meanwhile, in the MSA, 25.2% of households have incomes greater than $100,000 including 10.8% with incomes greater than $150,000. On a percentage basis, the downtown has nearly twice as many households with incomes greater than $150,000. With a higher and faster growing income along with a more rapidly increasing population, the downtown area may have had real demand and was seen as a more opportunistic location for real estate development than the rest of the MSA.
2.3.3 Population by Age
Age
Group MSA Downtown
0-4 632,763 6.7% 6,096 3.9% 5 -9 652,898 6.9% 2,748 1.8% 10-14 670,574 7.1% 2,099 1.3% 15 - 19 682,270 7.2% 5,584 3.6% 20-24 628,401 6.6% 15,783 10.1% 25 - 29 697,773 7.4% 29,651 19.0% 30 - 34 666,882 7.0% 21,996 14.1% 35 -39 656,868 6.9% 13,142 8.4% 40-44 663,344 7.0% 9,583 6.1% 45 -49 696,765 7.4% 8,622 5.5% 50 -54 681,436 7.2% 8,250 5.3% 55-59 580,367 6.1% 8,126 5.2% 60-64 470,871 5.0% 8,071 5.2% 65 - 69 333,871 3.5% 5,848 3.7% 70-74 245,125 2.6% 4,007 2.6% 75-79 191,799 2.0% 2,768 1.8% 80- 84 155,768 1.6% 2,049 1.3% 85+ 153,330 1.6% 1,763 1.1% Total 9,461,105 100% 156,186 100% 18+ 7,083,295 74.9% 143,955 92.2% Median Age 35.8 33.7 Source: ESRI
The median age of the MSA and downtown is 35.8 and 33.7, respectively. Two important ages groups to consider, however, are 20-29 and 30-39. In downtown, 29.1% of the population is between 20 and 29, while the same age group only accounts for 14.0% of the MSA population. The 20-29 age group is a key demographic for apartment renters as this population often tends to just graduated college or has been working for several years, but either does not have the resources, careers stability, or desire to own real estate. Meanwhile, the percentage of the population between 30 and 39 is 22.5% downtown and 14.0% in the MSA. The 30-39 age group captures renters leaving the 20-29 age group as they transition from renting to owning. At this point, the 30-39 age group is more established in their careers and has the resources and desire to own a real estate. A high and growing population of this demographic in the downtown can be construed as a strong indicator for current or future condominium demand in the downtown. Also, 92.2% of the downtown population is 18 years or older, while only 74.9% is in the
MSA. This statistic demonstrates that a larger percentage of the downtown population is already in the
renter or owner demographic or will be within the near term.
2.3.4 Total Housing Units by Occupancy
Occupancy MSA Downtown
Occupied Housing Units 3,475,726 91.5% 93,624 82.6%
Vacant Housing Units
For Rent 120,831 3.2% 6,471 5.7%
Rented, Not Occupied 5,855 0.2% 375 0.3%
For Sale Only 61,526 1.6% 3,982 3.5%
Rented or Sold, not Occupied 10,194 0.3% 414 0.4%
For Season/Recreation/Occasional
Use 26,754 0.7% 6,417 5.7%
For Migrant Workers 111 0.0% 4 0.0%
Other Vacant 96,250 2.5% 2,068 1.8%
Total 3,797,247 100% 113,355 100%
Total Vacancy Rate 8.5% 17.4%
Source: ESRI
While the total vacancy rate for the downtown is 17.4%, which is higher than the 8.5% in overall MSA, an important component of this number are those units ascribed as "For Season/Recreation/Occasional Use". For the downtown, this vacancy type accounts for 5.7% of the total housing units, while in the
MSA, it only accounts for 0.7%. In many cases, these units downtown may be used as a second homes or
a "pied-a-terre" for a population with a primary residence within the MSA, but outside of the downtown area. Furthermore, those owning such units tend to have not only a higher income than the general population, but also have more disposable income, which allows for luxury purchases such as downtown real estate. While these units may not be primary residences or occupied on a regular basis, it is a bit of a misnomer to describe them as vacant. These types of units owned by the aforementioned demographic are a real and growing market in cities around the country and world. In Chicago, these types of units accounted for only 1.5% and 2.4% of the total downtown housing units in 1990 and 2000, respectively. Now at 5.7%, the market has doubled in 10 years and nearly quadrupled in 20 years, and currently accounts for nearly 6,500 units in the market. This historic growth clearly demonstrates a strong demand in the city for real estate, especially condominiums.
2.3.5 Households by Tenure and Mortgage Status
Tenure and Mortgage Status MSA Downtown
Owner Occupied 2,293,837 66.0% 43,133 46.1%
Owned with a Mortgage
Loan 1,748,013 50.3% 34,963 37.3%
Owned Free and Clear 545,824 15.7% 8,170 8.7%
Average Household Size 2.79 1.67
Renter Occupied 1,181,889 34.0% 50,491 53.9%
Total 3,475,726 100% 93,624 100%
Average Household Size 2.45 1.51
Source: ESRI
Of the downtown households, 53.9% are renters compared with only 34.0% in the MSA. This statistic
alone makes a very strong case for rental units in the downtown. For an apartment developer, knowing that the population downtown is increasing and the majority of households are renters, it becomes very sensible to build to meet the current and future demand. For condominium developers, while there is more risk, an argument can be made to develop condominiums to meet the demand as these renters become owners. In the case of downtown, these renters are not just becoming owners after they age beyond the key rental demographic of 20-29, but may be coming owners sooner and employment and household income has increased at a higher rate downtown than in the overall MSA. In the downtown, the average household size is 1.51 compared with 2.45 in the MSA. This statistic combined with the growing population, suggests that demand will actually be greater for more housing downtown that in the
MSA. In the downtown, for every additional person in the population, you can justify developing one
additional unit of housing. In the MSA, as each household includes almost one more person than in the downtown, the demand for total housing units drops by nearly one-third.
2.4 Chapter Summary
The economics and demographics supported a strong market for more smaller-unit housing units such apartments and condominiums in the downtown market. Between 1990 and 2010, the downtown had stronger economic growth than the MSA. The downtown population increased by 81.5%, while the MSA population increased by only 15.6%. Moreover, the downtown population increased by 42.0% compared with 4.0% in the MSA from 2000 through 2010 alone. From 1994 through 2009, the urban core employment increased 12.9% while the MSA increased by 9.8%. The urban core gained a disproportionate 25.2% of the jobs created in the MSA during this period. This population and
employment growth evidences a "return to the city" movement that created demand for downtown residential housing. Additionally between 1990 and 2010, the downtown median household income increased by 67.3% compared with 60.3% in the MSA resulting in the downtown median household being 10.6% greater than that for MSA in 2010 compared with 5.5% in 1990. The higher and more-increasing income in the downtown suggests that its population likely had the money to buy new and old downtown residential housing. In regard to the select demographics, those for the downtown all evidenced a market strong a growing market that could support development.
CHAPTER 3: DOWNTOWN CHICAGO RESIDENTIAL MARKET
This chapter focuses on the downtown Chicago residential market between 1997 and 2011. More specifically, it focuses on the "boom" from 1997 through 2007 and the "bust" from 2008 through 2011. The first part of this chapter focuses on the overall housing boom and bust in the downtown Chicago residential market while emphasizing condominiums and apartments. It includes statistics and analysis on the condominium and apartment stocks, apartment occupancy and rent statistics, and condominium sales prices. It is meant to provide a more macro-level view of the market. The second part of this chapter focuses in on the condominium and apartment markets through single-year period and multi-year period summaries meant provide a more micro-level view of the market.
3.1 Downtown Chicago Residential Statistics
3.1.1 Apartment & Condominium Stock
Apartment & Condominium Stock
7,000 6,000 5,000 4,000 3,000 2,000 1,000 0 120,000 100,000 80,000 60,000 40,000 20,000 0 0 r- 00 CA ' M
~
~
\O r 0 O -4 e4 '4 cq N4 N' C41C-- Stock Change Stock
Source: Appraisal Research Counselors
Between 1997 and 2011, the downtown market stock increased by 54,893 (107.1%) units to 106,145 from 51,252. The 54,893 units included 4,088 (7.4%) apartments and 50,805 (92.6%) condominiums. The compound annual growth rate of the stock during this period was 5.0% resulting in an average of 3,660 units annually.
From 1997 through 2007, the downtown market stock increased by 40,442 (78.9%) units to 91,694 from 51,252. The 40,442 units included 42,401 (105.0%) condominiums of which 1,959 (-0.5%) were
condominium conversions. The compound annual growth rate of the stock during this period was 5.4% resulting in an average of 3,677 units annually.
Between 2008 and 2011, the downtown market stock increased by 14,451 (15.8%) units to 106,145 from 91,694. The 14,551 units included 6,047 (41.8%) apartments and 8,404 (58.2%) condominiums. The compound annual growth rate of the stock during this period was 3.7% resulting in an average of 3,613 units annually. In 2008, the number of units added to the stock annually peaked at 6,195 and then decreased by 13.1% to 5,378 in 2009, 47.5% to 2,287 in 2010, and 98.4% to 46 in 2011. 3.1.2 Apartment Stock Apartment Stock 3,000 -27,891 30,000 2,439 2,000 23,803 1,665 25,000 42 1,000 913 - 20,000 0 r- , 8 1079420---- , - 15,000 (546) (347) (513) (1,000) 923) 10,000 (2,000) 5,000 (2,923) (3,000) 0
Stock Change -=1==Stock Source: Appraisal Research Counselors
Between 1997 and 2011, the downtown market apartment stock increased by 4,088 (17.2%) units to
27,891 from 23,803. These 4,088 apartments accounted for 7.4% of total downtown market stock increase of 54,893 units during these years. In that time, however, there were actually 13,572 units added to the stock, but that number was offset by 9,484 condominium conversions, which resulted in the apartment stock increasing by only 4,088 units. The compound annual growth rate of the stock during this period was 1.1% resulting in in the downtown market apartment increasing by an average of 273 apartments annually.
1,959 units. The compound annual growth rate of the stock during this period was -0.8% resulting in in
the downtown market apartment decreasing by an average of 178 apartments annually.
Between 2008 and 2011, the downtown market apartment stock increased by 6,047 (27.7%) units to
27,791 from 21,844. These 6,047 apartments accounted for 41.8% of total downtown market stock
increase of 14,451 units during these years. In that time, however, there were actually 6,356 units added to the stock, but that number was offset by 303 condominium conversions, which resulted in the apartment stock increasing by 6,047 units. The compound annual growth rate of the stock during this period was 6.3% resulting in in the downtown market apartment decreasing by an average of 1,512 apartments annually. 3.1.3 Condominium Stock Condominium Stock 7,000 6832 80,000 6,000 - 0,000 5,000 -- - - - - --- - - --- -- 9-- 4-530~ - 60,000 4,000 50,000 3,000 3,671 40,000 27492,329 2,958 2,000 27,49358 30,000 1,000 ,20,000 388 0 10,000 (1,000) (45 0
--- Stock Change o Stock
Source: Appraisal Research Counselors
Between 1997 and 2011, the downtown market condominium stock increased by 50,805 (185.1%) units to 78,254 from 27,449. These 50,805 condominiums accounted for 92.6% of total downtown market stock increase of 54,893 units during these years. Of these 50,805 units, 9,484 (18.7%) were
condominium conversions and 41,321 (81.3%) were other condominium types. The compound annual growth rate of the stock during this period was 7.2% resulting in in the downtown market condominium increasing by an average of 3,387 condominiums annually.
From 1997 through 2007, the downtown market condominium stock increased by 42,401 (154.5%) units to 69,850 from 27,449. These 42,401 condominiums accounted for 100% of total downtown market
stock increase of 40,442 units during these years as the downtown market apartment stock decreased by
1,959 units. Of these 42,401 units, 9,175 (21.6%) were condominium conversions and 33,226 (78.4%)
were other condominium types. The compound annual growth rate of the stock during this period was
8.9% resulting in in the downtown market condominium increasing by an average of 3,855
condominiums annually.
Between 2008 and 2011, the downtown market condominium stock increased by 8,404 (20.6%) units to
78,254 from 69,850. These 8,404 condominiums accounted for 58.2% of total downtown market stock
increase of 14,451 units during these years. Of these 8,404 units, 309 (3.7%) were condominium
conversions and 8,095 (96.3%) were other condominium types. The compound annual growth rate of the stock during this period was 2.9% resulting in in the downtown market condominium increasing by an average of 2,101 condominiums annually.
3.1.4 Year-End Occupancy Year-End Occupancy 100% -- ~-96.9% 96% 96.4% 94.2% 92% 88% 84% 00 40 0 (C9 e4 N' 4 e4 C4 Ci i i Ci ==G==Class A -41=Class B Source: Appraisal Research Counselors
Between 1998 and 2011, the year-end occupancy for Class A apartments ranged from 90.6% to 97.3% with an average of 93.6%. It reached its low of 90.6% in 2008 and its high of 97.3% in 1999. During the same time period, the year-end occupancy for Class B apartments ranged from 88.5% to 96.4% with an average of 93.7%. It reached its low of 88.5% in 2002 and its high of 93.7% in 2010.
From 1998 through 2000, apartment occupancy generally decreased as demand shifted from renting to owning as it became more economical to the latter." In 2001 and 2002, apartment occupancy decreased further due to economic fallout from the tech-bubble and 9/11 terrorist attacks.26 Between 2003 and 2005, apartment occupancy increased as the economy recovered and the apartment market benefited from continued condominium conversions. 27 From 2006 through 2008, apartment occupancy decreased as there was a decrease in condominium conversions and an increase in competition from new apartment developments and the "shadow" rental market for condominiums. Between 2009 and 2011, apartment occupancy increased as demand shifted back to renting from owning due to concerns over the uncertainty in the economy and real estate market. 28
3.1.5 Year-End Effective Rent
Year-End Effective Rent
$2.50 V)A $2.00 $1.50 $1.00 $0.50 C14 Nl C14 C1 e C14 -- Class A -O--Class B
Source: Appraisal Research Counselors
Between 2001 and 2011, the year-end effective rent for Class A apartments ranged from $1.85 PSF to $2.43 PSF with an average of $2.07 PSF. It reached its low of $1.84 PSF in 2003 and then increased at a compound annual growth rate of 3.5% to its high of $2.43 PSF in 2011. During the same time period, the year-end effective rent for Class B apartments ranged from $1.61 per square foot to $2.13 PSF with an average of $1.85 PSF. It reached its low of $1.61 PSF in 2002 and then increased at a compound annual growth rate of 3.2% to its high of $2.13 PSF in 2011.
_51.9.
114P --- --- --- - -
From 2001 through 2004, apartment rents initially decreased but then remained constant as demand had shifted from renting to owning during the late 1990 and early 2000s2 9
while remaining demand was weakened by economic fallout from the tech-bubble and 9/11 terrorist attacks.3 0 Apartment owners offered concessions.3 In 2005 through 2007, apartment rents increased as the economy recovered and the apartment market benefited from continued condominium conversions. 3 Apartment owners initially
reduced or eliminated concessions, 3 3 but increased them along with offsetting utility charges to tenants in
2007." In 2008 and 2009, apartment rents decreased as there was a decrease in condominium conversions and an increase in competition from new apartment developments and the "shadow" rental market for condominiums. Between 2010 and 2011, apartment rents increased with occupancy as demand shifted back to renting from owning over economy and real estate market concerns.
3.1.6 Year-End Occupancy vs. Effective Rent
Year-End Occupancy vs. Year-End Effective Rent
100% 96% 92% 88% 84% $2.50 $2.25 $2.00 $1.75 $1.50 -O-t R
-4-Cass A Occupancy -- Class B Occupancy -- d-Class A Rent -&Cass B Rent Source: Appraisal Research Counselors
3.1.7 Condominium Sales Prices
The following condominium sale price data was obtained from Zillow for three Chicago neighborhoods: Gold Coast, Near North, and the South Loop. This data provides a general sense of the sale price values and sales activity from 2003 through 2011.
n
ccaso GCio d Coast
$340 S320 $ 300 S260) S200 Source: Zillow
Between January 2003 and December 2011, the average sale price in the Gold Coast ranged between
$213 per square foot (January 2003) and $390 per square foot (November 2007).
Source: Zillow
Between December 2003 and December 2011, the average sale price in Near North ranged between $294 per square foot (August 2009) and $407 per square foot (September 2008).
C) c~cago sousth oo: S 30 0 S291) S280 S2/0) s2 /o) $260 S 230)
~-J.Z0A
S190 Source: ZillowBetween February 2003 and December 2011, the average sale price in the South Loop ranged between
$160 per square foot (December 2003) and $291 per square foot (July 2007).
L o Li <oast Near
so
, ,O-jt LOO.S40)
S-200o
S 1801
Source: Zillow
The above graph compares the average sale prices between the Gold Coast, Near North and the South Loop. As this graph and the previous three demonstrate, the downtown Chicago residential market
3.2 Downtown Chicago Residential Market Period Summaries
The following section provides single-year period and multi-year period summaries that provide a general sense of what was happening in the market from quantitative, qualitative, and/or anecdotal perspectives. These summaries, which are broken out between the condominium market and the apartment market should neither be construed as comprehensive market reports nor comprehensive market commentaries. Additionally, the condominium market summaries tend to focus more on new developments and the first-time sales market as opposed to existing developments and the resale market.
3.2.1 Condominium Market (1997-2005)
The downtown Chicago market condominium boom started in 1997 when 134 new-construction condominiums were delivered to the condominium stock, which was a 670% increase from 20 in 2006. It was the first significant addition of new condominiums to the condominium stock in the 1990s. Between
1997 and 2005, the condominium stock increased by 33,002 (120.2%) units to 60,451 from 27,449.
There was a strong indication of a coming boom in the market before 1997. After the recession in the early 1990s, momentum returned to residential development due to low interest rates and high demand especially among first-time and empty-nesters buyers. Additionally, depressed land prices made development much more feasible.36 Between 1991 and 1996, the only additions to condominium stock excluding condominium conversions were 1,225 adaptive-reuse condominiums, 92 new-construction condominiums, and 858 townhomes. During that time, however, there were 3,948 condominium
37
conversions. One market expert concluded that the demand for downtown residential development was driven by four factors: low interest rates, a robust downtown service economy, an undersupplied apartment market, and a vibrant city life, which was especially attractive to young professionals.3 8
With land and construction costs rising, developers increased density to ensure profitability. It was no longer economically feasible to build single-family homes in an increasing number of downtown locations. In result, more condominiums were developed - albeit increasing in size, quality, amenities and price.
Between condominium sales weakened due to the economic fallout from the tech-bubble and 9/11 terrorist attacks"
In 2001, speculators and their effect on demand and prices a major became a concern in the market. In 2001, it was estimated that 25% to 40% of new units were purchased by investors for resale, and that such activity was contributing heavily to the condominium boom which began in 1997. At the time, the 161-unit Farallon had 50 161-units on the resale market while the building was still under construction. The development had originally sold out on the first day of sales in 1999.41 In the case of $200,000 condominium, a speculator could make a $20,000 down payment on it and then sell it upon completion two years later for $230,000, which would effectively double the investment. Unlike speculators, traditional buyers who intended to live in their units preferred to wait until the building was "topped out" before making a down payment for fear that the building would not be completed and their deposit would be lost. For developers, speculators were a concern because they would be more willing to either walk away from a down payment without closing or to rent out the unit, which could create conflict with owner-occupied units. In some cases in 2001, marketing consultants were advising developers to increase down payment amounts to discourage speculators. Also, banks such as LaSalle Bank became wary of speculators as well. It began requiring that developers prohibit buyers from reselling units before they actually closed.2 In 2001, some in the market contended that speculators were no longer seeking to quickly resell properties, but were to own them for several years.43
In 2001, there was concern about demand for pending unit deliveries in 2002 and 2003 even though prices had remained stable as the economy weakened. Some developers believed that certain parts of the city were already oversupplied and that while developments with premiere locations and views would sell, developments lacking those attributes, especially ones with generic designs and finishes would not. Furthermore, it was believed the competition between developers and speculators both selling units could
negatively impact pricing.
In 2004 and 2005, condominium sales strengthened s low interest rates and a weak stock market made real estate very attractive.45
In 2005, there was concern for the increasing spread between condominium prices and apartment rents According to an Federal Deposit Insurance Corporation ratio, the median home price in the Chicago area was 23 times the area's average annual rents; that ratio was 14 four years ago. It was also the largest ratio value in at least 20 years. Since 1998, the average price for a Chicago-area home had increased 69%, while average rents had increased only 4%. While a two-bedroom condominium selling at $550 PSF cost
prices, speculators may have either defaulted on mortgages or sold units - both of which would have hurt the market."
3.2.2 Apartment Market (1997-2005)
In 1997, construction began on One Superior Place, a 52-story, 809-unit apartment building in the Gold Coast to be delivered in 1999. It was the first high-rise apartment development since 1991 when oversupply in the market resulted in high vacancy rates, substantial tenant concessions, and major losses for lenders. Since 1991, the apartment stock had decreased by 3,571 (13.0%) to 23,803 from 27,374 due in part to 3,948 condominium conversions.4 7 In that time, the market demand had shifted from renting to owning as it became more economical to do the latter. At the time, one example had monthly rent being $2,100 assuming a 1,200 square foot apartment at $1.80 PSF whereas a monthly mortgage excluding taxes, utilities and other expenses was only $1,364 per month assuming a $200,000 purchase price and 30-year fixed mortgage with an interest rate of 7.25%.48 In result, there were 8,766 condominium conversions between 1997 and 2005, which reduced the apartment stock by 3,343 (14.0%) units to 20,460 from 23,803.49 While the apartment market had improved since 1991, it was generally still not economically feasible for development. In 1997, asking rents ranged from $1.43 PSF to $1.93 PSF with an average of $1.66 PSF, but new development still required $2.00 PSF.
Between 1997 and 2000, the apartment stock decreased by 1,490 (7.0%) units to 22,313 from 23,803 as there were 3,162 condominium conversions. During this four-year period, condominium conversions were being driven by several factors including strong downtown housing demand, opportunistic apartment sellers and condominium converters, and low interest rates for home mortgages. Condominium conversions, however, did not reach the same level as in the early 1990s because there were not enough buildings.5'
In 2001, the apartment market, especially the luxury segment was experiencing the softest rental market in nearly decade. The market was already weak, but the economic fallout from the 9/11 terrorist attacks made its condition even worse. Despite the apartment stock decreasing by 347 (1.5%) units to 21,966 from 22,313 due to 448 condominium conversions, the year-end occupancy decreased 220 basis points to
91.0% from 93.2% for Class A apartments and 270 basis points to 93.5% from 96.2% for Class B
apartments. 3 In response to the market conditions, apartment owners offered concessions ranging from