Digital neighborhoods
The MIT Faculty has made this article openly available. Please share how this access benefits you. Your story matters.
Citation Anselin, Luc, and Sarah Williams. “Digital Neighborhoods.” Journal of Urbanism: International Research on Placemaking and Urban Sustainability 9, no. 4 (September 30, 2015): 305–328.
As Published http://dx.doi.org/10.1080/17549175.2015.1080752
Publisher Informa UK Limited
Version Original manuscript
Citable link http://hdl.handle.net/1721.1/120792
Terms of Use Creative Commons Attribution-Noncommercial-Share Alike
Digital Neighborhoods
Luc Anselin and Sarah Williams
2015
Digital Neighborhoods
Luc Anselina and Sarah Williamsb
a GeoDa Center for Geospatial Analysis and Computation School of Geographical Sciences and Urban Planning Arizona State University
Tempe, AZ 85287 [email protected] b Civic Data Design Lab
Department of Urban Studies and Planning Massachusetts Institute of Technology Cambridge, MA 02139
[email protected] Abstract:
With the advent of “big data,” there is an increased interest in using social media to describe city dynamics. This paper employs geo-‐located social media data to identify “digital neighborhoods”-‐ those areas in the city where social media is used more often. Starting with geo-‐located Twitter and Foursquare data for the New York City region in 2014, we applied spatial clustering techniques to detect significant groupings or “neighborhoods” where social media use is high or low. The results show that beyond the business districts, digital neighborhoods occur in communities undergoing shifting socio-‐demographics. Neighborhoods that are are not digitally oriented, tend to have higher proportion minorities and lower incomes, highlighting a social-‐economic divide in how social media is used in the city.
Understanding the differences in these neighborhoods can help city planners interested in generating economic development proposals, civic engagement strategies, and urban design ideas that target these areas.
Keywords:
Big Data, Social Media, Spatial Analysis, Neighborhoods, Digital Divide, GIS
Digital Neighborhoods Introduction
In this paper, we build on previous attempts to define neighborhoods and more specifically on recent efforts to account for diversity within neighborhoods by leveraging “new data” (big data). We use the digital footprint of two specific social media and location sharing services, Twitter and Foursquare, to propose the notion of “digital neighborhoods.” Unlike some previous studies, we keep existing
administrative units as the areal frame of reference and use measures of local spatial autocorrelation to identify hot spots and cold spots of social media activity by census block group, using data for New York City. Specifically, we introduce the notion of a location quotient for social media activity to identify neighborhoods associated with digital hot spots and digital deserts. We then relate the identified clusters to background information on the socio-‐economic make-‐up and urban characteristics of the block groups. The results show that beyond the business districts of Manhattan and Brooklyn, digital neighborhoods occur in areas where the population is upwardly mobile, i.e., young people in their mid-‐thirties with higher than average incomes. Those areas that are not digitally oriented tend to have a higher proportion of minorities and lower income residents, highlighting what appears to be a social economic divide in how social media is used in the city. We start by framing the research and situate it among the many concepts and definitions of the notion of neighborhood that have been suggested in the literature. We then move on to a discussion of “big data” and its use in urban analysis. We review various approaches where social media analytics were employed to define and understand the dynamics of neighborhoods. Next we present some details about the data we use and outline our methodological approach. This is followed by a discussion of our findings for the analysis of digital neighborhoods in New York City. We close by discussing how identifying these digital neighborhoods can create a new way of interpreting the needs of various neighborhoods in the city.
Defining Neighborhood
There is some agreement that a neighborhood is defined as a “social/spatial unit of organization” larger than a household but smaller than a city (Hunter 1979). Beyond that, however, there is little consensus on how to define neighborhoods.
Sociologists, for example, focus on the social meaning of space and suggest that a neighborhood is defined according to the boundaries perceived by residents
(Galster 1986; Hunter 1974). At the same time, public administrators operationally define neighborhoods using specific geographic boundaries, allowing for the
organization and distribution of services and policy analysis (Dewey 1950; Galster 1986; Hunter 1979).
Even within the field of sociology, various definitions of a neighborhood have been proposed. According to Robert Park (1915), neighborhoods are defined based on the sentiments of groups of people. He noted, “Each separate part of the city is
inevitably stained with the peculiar sentiments of its population. The effect of this is to convert what was at first a mere geographical expression into a neighborhood…” (1915, 579). Other scholars assert that neighborhoods should be defined by using descriptive typologies. For example, in his seminal work, The Image of the City, Kevin Lynch (1960) noted that typologies should be used based on resident
perceptions through an “internal learning process” (1960, 12), while Hunter (1979) asserts that typologies should be based on functional characteristics, such as
demographic or compositional characteristics. Hunter also proposed defining neighborhoods based on economic, political, administrative, or social functions. Other scholars apply both social and physical characteristics in defining
neighborhoods. Galster (1986) posits that by linking individual perceptions of neighborhood with spatial dimensions of a neighborhood, we can accurately create a concept of the neighborhood that is quantifiable and allows for the understanding of human and behavioral responses to environmental change. Similarly, Gephart (1997, as quoted in Galster 2001) noted, “Insofar as a neighborhood has a
geographical referent, its meaning depends on context and function. The relevant units vary by behavior and domain, and they depend on the outcome or process of interest” (2001, 10). Galster (2001) defines neighborhoods as a “bundle” of
spatially-‐based attributes, such as topography or demography, that are associated with “clusters” of residence that sometimes correspond to other land uses.
Other scholars have taken a more liberal approach to defining neighborhoods. According to Kearns and Parkinson (2001), in the absence of a single interpretation of what a neighborhood is, there is at least agreement on the different scales of the neighborhood: the home area, locality, and the urban district or region. Martin (2003) proposes that neighborhoods be defined fluidly and based on circumstances or action; because neighborhoods often form to leverage social or political action, they should be considered “flexible, contingent, social, and political products” (2003, 362).
Big Data, Social Media Analytics and Neighborhoods
More recent attempts to define neighborhoods, including ours, leverage digital information and/or social media data in order to define neighborhoods to account for the dynamic and changing nature of urban areas. Before detailing the specific data sources and methods we employed in our analysis, we provide some context on the use of new data (“big data”) for neighborhood analysis, and in particular on the consideration of social media data. We situate our study within this context.
Big Data for urban sciences
In spite of its increasing use in the scientific dialogue, there is no rigorous definition of the term “big data” (Mayer-‐Schönberger and Cukier 2013, 6). It is commonly characterized by the “three ‘v’”: volume, velocity and variety. In addition, typical properties pertain to exhaustiveness, fine grained resolution (geo-‐coded and near continuous in time), an emphasis on relations (for cross-‐referencing) and flexibility
(Kitchin 2013). While the adoption of a true big data perspective arguably has not (yet) reached the mainstream of urban studies, there have been a number of thoughtful recent discussions of its implications for theory, methodology and empirical practice in geography, regional science and planning. Examples include Miller (2010), Batty (2012, 2013), Crampton et al (2013), Arribas-‐Bel (2014), Kitchin (2013, 2014), and Rabari and Storper (2015), among others.
We suggest that the big data movement and its relevance for urban analysis are driven by the availability of three new and important data sources. First, there is a growing body of near-‐continuous and location-‐specific sensor data (e.g., of various weather conditions, environmental indicators, flows of traffic and people, etc.) available as a side product of the “smart city” (Allwinckle and Cruickshank 2011; Shepard 2011; Kloeckl et al 2012; Hancke et al 2013; Townsend 2013). Second, the “open data” movement adopted by an increasing number of large city governments (including, for example, Chicago, New York City and San Francisco) has yielded a plethora of administrative data records, many of which are geo-‐referenced
(Townsend 2013; Arribas-‐Bel 2014). For example, the city of Chicago’s open data portal contains some 850 data sources on all aspects of city life, ranging from crime reports, 311 requests, traffic indicators, to building permits, energy use and
budgetary information, all readily available for download and analysis.1 A third source consists of the data provided by the co-‐called “social web,” such as social media messaging services like Twitter, Facebook. Instagram, and Linkedin, location sharing services, such as Foursquare and the now defunct Gowalla and Brightkite, and photo sharing sites, such as Flickr and Panoramio (Cheng et al. 2011; Russell 2014).
For our analysis, we utilize Twitter and Foursquare. Twitter is a web-‐based social networking service, well-‐known for its short 140 character “tweets.” As of October 2014, Twitter had 284 million average monthly active users, and provides services in some 35 languages, yielding 181 billion timeline views (roughly equivalent to tweets) for the third quarter of 2014. 2 While the purpose of a tweet is to send a message, its information value far exceeds the actual content of the message. A major source of information for analysis is the “metadata” of a Twitter message, which includes a large number of items, among which potentially the latitude and longitude of the location where the message was made (based on the GPS in the user’s smart phone), a time stamp, an identifier for the user and the user’s “location.” However, the location information in a tweet is imperfect (roughly 5-‐ 10% of tweets actually contain the latitude-‐longitude). We return to this issue below.
1 Chicago Open Data Portal, Last Accessed April 5th, 2015 http://data.cityofchicago.org
2 For further details, see, e.g., http://en.wikipedia.org/wiki/Twitter and http://investor.twitterinc.com Last Accessed April 5, 2015
Foursquare is a location sharing service in that the whole purpose is to let the world know when and where the user “checks in” to a venue. Venues tend to be
commercial (e.g., restaurants, bars, stores) or governmental operations (e.g., subway stops, city hall, libraries, airports), but they can also be somebody’s home. Foursquare provides incentives to its users, such as designating someone as the “mayor” of a given venue. As of December 2013, Foursquare had 45 million registered users, more than 50% of which were outside the U.S. In the summer of 2014, the nature of Foursquare was changed to a local search service and the check-‐ in feature was moved to a companion application called Swarm.3
When social media messages contain locational information, such as a Foursquare check-‐in and tweets that include latitude-‐longitude in their metadata, they
constitute a type of volunteered geographic information, or VGI (Goodchild 2007; Sui et al 2013). Stefanidis et al (2013a, 320) refer to this specific context as “ambient geospatial information.” This is different from active crowdsourcing such as the bostonography project which builds on Lynch’s seminal work by asking citizens to digitally define their neighborhoods on an online map and using the collective input to identify the core of neighborhoods (Woodruff 2012). Social media messages, while not crowdsourced per se, can nevertheless provide important insights into human activity spaces, mobility, and the spatial imprint of social networks.
However, the information revealed by such geo-‐located social media messages is not without problems, as it suffers from an array of inherent biases, with respect to who the users are, what the messages are about, and the locations where they are sent (for further discussion of these biases, see, e.g., Goodchild 2013; Morstatter et al 2013; Hecht and Stephens 2014; Tufekci 2014; Ruths and Pfeffer 2014). These biases call into question how representative the data can be with respect to the underlying phenomena. In this respect, while we acknowledge the issue of
representativeness, we take a “big data” perspective in our analysis, which allows for the inherent “messiness” of the data, but suggests that interesting patterns can nevertheless be revealed due to the sheer size of the data sets (Kitchen 2014). The inclusion of social media data in research can be viewed as part of a recent move towards computational social science, arguably a new paradigm for social research (Lazer et al 2009; King 2011). This is also related to a push towards data-‐ driven science, sometimes referred to as the “fourth paradigm” (Hey et al 2009). Some have gone so far as to suggest that the wealth of information in big data (the “data deluge”) may have removed the need for theory (Anderson 2008), although generally, a more balanced perspective is taken. For example, Miller (2011),
Edelman (2012) and Golder and Macy (2014) lay out how the wealth of social media data affects the theoretical questions addressed, the methodology used as well as empirical practice in the social sciences. For example, direct observation of social interaction (at a near population level) allows one to move away from the standard
3 For details, see http://en.wikipedia.org/wiki/Foursquare ,
http://blog.foursquare.come, http://foursquare.com and http://swarmapp.com . Last Accessed April 5, 2015
assumption of atomistic behavior reflected in traditional social science sample surveys.
Social media analytics and neighborhoods
The ready availability of an open application programming interface (API) for most social media services has provided a tremendous opportunity to carry out empirical research based on vast amounts of information. This has led to a growing list of applications of so-‐called social media analytics, mostly originating in the computer science literature (Kumar et al 2013), but increasingly also present in the
substantive fields (Rainie and Wellman 2012; Tsou and Leitner 2013; Golder and Macy 2014). The relevant literature is vast and expanding rapidly, and therefore a comprehensive review is beyond our current scope. Instead, we focus on a few representative studies that reflect the importance of location, geography and neighborhoods in social media analytics.
The focus on location appears in many different ways in studies of social media. For example, Crandall et al (2010) take an innovative approach to social network
analysis by inferring social ties from geographic coincidences derived from postings on the Flickr photo sharing site. In a similar vein, the locational information in geo-‐ tagged photos on Panoramio is exploited by Li (2013) to suggest travel itineraries. The more general spatial distribution and space-‐time dynamics of social media such as Twitter, Foursquare and Flickr are investigated in Cheng et al (2011), Takhteyev et al (2012) and Li et al (2013), among others. More specialized applications infer the spatial and space-‐time pattern of phenomena such as unusual social events (Fujisaka et al 2010; Lee et al 2011), the spread of disease (Sadilek et al 2012), or voting patterns (Tsou et al 2013) derived from the content of Twitter messages. An interesting research question pertains to determining more precise locational information about a Twitter user when the latitude-‐longitude measures are not included in the metadata of the message. Various approaches combine information from different metadata fields, or derive cues from the content of the message, e.g., Cheng et al (2010), Leetaru et al (2013), Schulz et al (2013), Compton et al (2004) and Graham et al (2014), among others. Exploiting this locational information in social media messages has been used to infer mobility patterns, e.g., using
Foursquare in Noulas et al (2011a, 2011b), and Twitter in Hawelka et al (2014). Along the same lines, movement patterns for individuals retrieved from successive tweets, so-‐called “lifelogs,” can provide the basic input to derive a socio-‐cultural cognitive map of urban centers, e.g., as in Wakamiya et al (2012). In a similar vein, Stefanidis et al (2013b) analyze the message content at an international scale to delineate virtual communities centered on national interests, but extending beyond the corresponding national boundaries. Silva et al (2014) use information about food and drink preferences from Foursquare check-‐ins to infer cultural boundaries at a variety of geographical scales.
A natural extension of these types of research questions is to apply the locational information in social media messages to the delineation and/or definition of urban
neighborhoods. Perhaps the best-‐known example of this type of effort is the “livehoods” project of Crenshaw et al (2012). Based on a match between Twitter messages and Foursquare locations, they build an association matrix between venues. This is a form of similarity (or correlation) matrix, derived from how many Twitter users two venues have in common. The association matrix forms the basis for a clustering exercise that results in the delineation of so-‐called livehoods for a number of U.S. cities, i.e., neighborhoods based on similarity in social media activity. Kiciman et al (2014) further refine the delineation of neighborhoods by
conditioning on personal and contextual factors extracted from the Twitter message itself in so-‐called “discussion graphs.” They replicate the livehoods example for NYC and show how the results vary considerably when gender and time are taken into account. Lee et al (2013) also use Twitter messages as the basis for delineating neighborhoods, but they exploit the time stamps of messages to characterize regions in terms of activity (the underlying mobility pattern). In an application to Japan, they start with a cluster analysis of the point pattern of messages and proceed to match the temporal imprint reflected in the so-‐called life logs to known types of facilities found in a region (e.g., work, shopping, entertainment and food). In a slightly different approach, Arribas-‐Bel et al (2014) do not focus on clustering and neighborhood definition per se, but take administrative neighborhoods in the city of Amsterdam as the geographical footprint. They then relate Foursquare activity in each unit to characteristics of “urban buzz.”
In our study, we also take the existing census boundaries as the geographical
container for the social media data. We use the intensity of social messaging in both Twitter and Foursquare for census block groups in NYC, to define what we call “digital neighborhoods,” i.e., those areas in the city where one is more likely to use social media. It is important to keep in mind a crucial distinction between the characteristics of the census block group and the location of the social media
activity. While the former is intimately related to who resides in the block group, the latter is not, or not necessarily. We typically do not know where the originators of the social message resides, only where the message was generated. Thus our focus is on identifying locations where social media activity is more (or less) likely to occur and on the characteristics of those locations. We turn to the specific data sources and methods in the next Section.
Data and Methods Data sources
Our point of departure is a comprehensive set of Twitter data and Foursquare check-‐ins for a one week period in February 2014 (February 2-‐9) for the five boroughs of New York City. The Twitter data were obtained from GNIP.org and are the so-‐called Twitter “fire hose,” i.e., they contain every single message, as opposed to the 1% sample available through the public API. The Foursquare data consist of total number of check-‐ins at each venue and were obtained directly from
Foursquare. As mentioned, we use the census block group as our geographical unit of analysis. This provides us with census information on the population and other
socio-‐economic characteristics in each block group from the 2007-‐2013 ACS files. In addition, we obtained all business locations for 2010 from the Infogroup business listing file available from ESRI Business Analyst.4
The raw data required considerable manipulation before it was in a suitable form for our analysis. The more than 5 million Twitter messages were contained in 5,760 JSON files that needed to be parsed and converted to a comma separated format (csv) in order to be loaded as points into a spatial database system (PostGIS). Similarly, the venues contained in the Foursquare data and the business locations from ESRI Business Analyst were loaded as points into the same spatial database. This allowed us to aggregate the individual points to count totals organized by the 6,454 census block group in the five boroughs. Finally, in order to yield meaningful results (i.e., avoiding division by zero), all census block groups with zero population were removed, as well as the block groups that consisted of parks and other open space. While such block groups (especially the parks, such as Central Park in NYC) exhibit considerable social media activity located in them, this cannot be analyzed in a meaningful way relative to an underlying “population,” since the census does not record a population figure for parks. This finally yielded 6,192 block groups for our analysis.
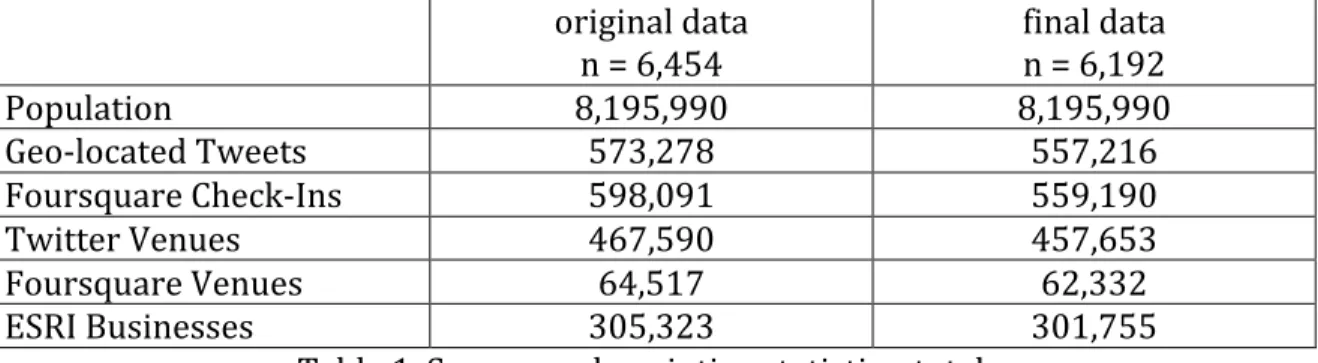
An overall summary of the data is reported in Tables 1 and 2. Table 1 gives the total population, number of geo-‐located tweets, foursquare check-‐ins and the
corresponding venues (place where users tweet or check-‐in), as well as the count of ESRI businesses for both the original number of census blocks (n = 6,454) as well as the final set with zero population areas and parks removed (n = 6,192). The total number of geo-‐located tweets and Foursquare check-‐ins is roughly similar, at about 560,000 for the week. However, the spatial detail of this activity is quite distinct, with the tweets much more disaggregated (about 460,000 locations) compared to slightly over 60,000 Foursquare venues. The data set also contained about 300,000 ESRI business locations.
original data n = 6,454 final data n = 6,192 Population 8,195,990 8,195,990 Geo-‐located Tweets 573,278 557,216 Foursquare Check-‐Ins 598,091 559,190 Twitter Venues 467,590 457,653 Foursquare Venues 64,517 62,332 ESRI Businesses 305,323 301,755
Table 1. Summary descriptive statistics, totals.
Table 2 shows some basic descriptive statistics at the census block level for the messages and associated number of venues. The most striking characteristic is the highly skewed nature of the distribution. In all instances, the mean is substantially
4 This data was obtained from a purchased subscription and is based on Dun and Bradstreet data on
higher than the median, suggesting a strong influence of outliers. This is confirmed by the range of counts, which in each instance goes from zero to a very large
number, e.g., about 5,500 for tweets and 12,000 for check-‐ins. These large numbers are concentrated in a small number of block groups in Manhattan. The median count is about 40 per census block group for tweets and 10 for check-‐ins, corresponding to about 30 Twitter locations and 4 Foursquare venues. The median number of
businesses by census block group is 23. Interestingly, almost 100 block groups do not have any Twitter activity at all, and close to 800 block groups (almost 13%) have no Foursquare check-‐ins. Only 27 block groups do not have any business locations.
Mean Median Range # Zeros
Tweets 90 39 5,563 98
Foursquare check-‐ins 90 10 12,136 796
Twitter Locations 74 34 5,164 98
Foursquare Venues 10 4 449 796
ESRI Businesses 49 23 5,827 27
Table 2. Summary counts by block group (n = 6,192) Quantifying the intensity of social media activity
In most empirical studies of social media activity, the location of the messages is treated as a point pattern in space. In our study, we aggregated this activity to the census block group level in the form of a count of events. However, the count as such does not provide a reliable indication of the intensity of social media activity, since it ignores the underlying “population at risk.” Instead, one could use a density
measure, such as the number of messages per capita or per number of business establishments.
We propose to introduce a more refined measure of relative intensity in the form of a location quotient. The location quotient is a familiar tool in regional analysis (Isard 1960, 123), employed to highlight locations where the share in the numerator of the quotient (in our case, the relative share of social media messages) is very different from the share in the denominator. More formally, the location quotient is:
LQ = (M_bg / M_total) / (P_bg / P_total),
where M pertains to the social media messages (tweets or Foursquare check-‐ins) and P to a population “at risk,” either the population count from the U.S. Census, or the number of business establishments from ESRI Business Analyst. The subscript designates the spatial extent of the count, either the block group (bg) or the total for the whole area (total). In other words, the location quotient describes how the relative share of the terms in the numerator (i.e., the number of social media messages) compares to the relative share of the terms in the denominator (i.e., the population at risk). We designate areas with LQ much greater than 1 as digital hot spots, and areas where the reverse is the case (LQ <<< 1) as digital deserts.
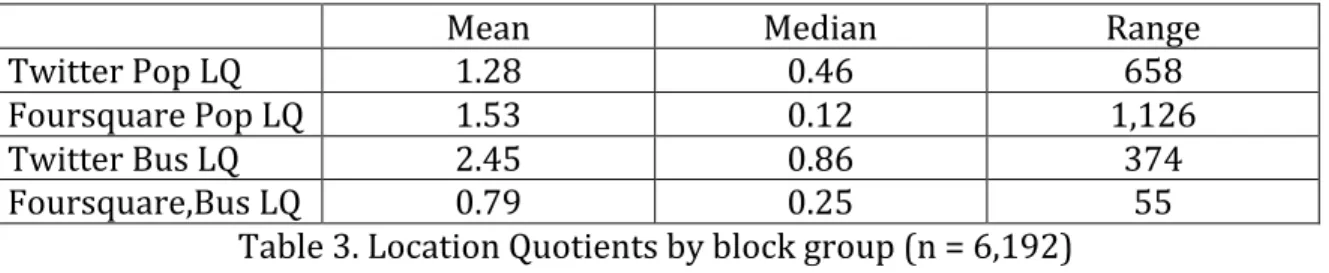
Basic descriptive statistics for the location quotients by census block group are listed in Table 3. Again, we observe a highly skewed distribution with several very large outliers, as indicated by the difference between the mean and the median, as well as by the extreme range. We note the difference between the location quotients that use population as the denominator and those based on the number of business establishments. The median for the latter is about half the median for the former and the range is much less extreme as well. For Foursquare in particular, the range for the population LQ is very large, driven by a block group in Manhattan with
intense social media activity, but a very small census population. In this instance, the intensity of social media activity seems to be better represented by the business location quotient.
Mean Median Range
Twitter Pop LQ 1.28 0.46 658
Foursquare Pop LQ 1.53 0.12 1,126
Twitter Bus LQ 2.45 0.86 374
Foursquare,Bus LQ 0.79 0.25 55
Table 3. Location Quotients by block group (n = 6,192) Identifying clusters and spatial outliers
We use a local indicator of spatial autocorrelation or LISA measure (Anselin 1995) to highlight spatial patterns in the data. Specifically, we employ the local Moran statistic to identify clusters and spatial outliers. The local Moran is a location-‐ specific variant of the well-‐known Moran spatial autocorrelation coefficient (Cliff and Ord 1973). Formally, it is proportional to the cross product between the value observed at a given location, say zi, and its spatial lag, i.e., the weighted average of the values observed at neighboring locations, the sum over j of wij zj, where wij are the elements of a so-‐called spatial weights matrix, which expresses the
neighborhood structure (for technical details, see Anselin 1995).
We visualize the locations with a significant local Moran in a so-‐called LISA cluster map (Anselin et al 2006). This highlights spatial clusters as either hot spots (i.e., locations with an above average LQ surrounded by neighbors with an above average LQ, or high-‐high patterns) or cold spots (i.e., locations with a below average LQ surrounded by neighbors with a below average LQ, or low-‐low patterns), or spatial outliers. Spatial outliers are locations with an above average LQ surrounded by neighbors with below average LQ (high-‐low), or the reverse (low-‐high). Once the locations for the clusters and outliers are identified, we match them with census information and local knowledge on the underlying urban dynamics.
Digital Neighborhoods in NYC General Findings
As illustrated in Figures 1-‐4, New York City is characterized by locations where both Twitter and Foursquare is used more than in other neighborhoods. These “digital”
neighborhoods typically have higher proportions of white residents and a higher median household income. While the residents of these digital neighborhoods are not necessarily the ones who created the social media records, the socio-‐
demographic information helps to describe the neighborhoods character. In general terms, the digital neighborhoods represent the city's business districts and tends to represent communities that are experiencing new development patterns and have and upwardly mobile population. It should be noted, however, that Twitter appears to be used in more locations throughout the city than Foursquare, this could be explained by the fact that Twitter has a more diverse social-‐demographic user base than Foursquare.
Putting these findings in context, one should note that overall users of location based social media tend to be be young and upwardly mobile. A Forrester research study (Parrish et al. 2010) showed that the profile of the Location Based Social Network user has an average age of 32, 44% Gen Y (18-‐29), 42% Gen X (30-‐43), 09% Young Boomers (44-‐53) , 05% Senior Boomers (54-‐65), 0% Senior (65+). The study also found that the average household income is $105,000, people who earned a college degree or higher is 70% (for details, see Parrish et al. 2010). According to a study by Pew Research Center’s Internet Project (Duggan and Brenner 2013),
Twitter users tend to have more African American and Hispanic users than social media sites like Foursquare.
It should also be noted that social media users tag themselves spatially for different reasons. Duggan and Brenner (2013) also report that 30% of social media user now tag their posts with their location. 12% of smartphone users use geosocial services on social media sites to “check-‐in” to locations or share their location with friends. Facebook users check-‐in the most at 39%, followed by Foursquare 18%. It appears that only 1% of Twitter users check-‐in using the geo-‐location capabilities provided for that application (Duggan and Brenner 2013). When Twitter users tag themselves spatially it is often not specifically to check-‐in to a business or residence, but rather because they have agreed to make their spatial location known when they tweet (the total number of geo-‐located tweets varies between 5-‐10%).
Location Quotients
The location quotient maps highlight concentration of social media activity relative to the underlying “population at risk,” here either businesses or residents. We hoped that that using the business location quotients would help to account for the major differences in daytime population often found in business districts. While it was helpful for for the Foursquare data, which is largely driven by business check-‐ins, it did not do as well at accounting for these differences in Twitter data where users are not specifically checking into business locations. The residential population location quotients for both Foursquare and Twitter appear to show concentrations of social media use in Midtown Manhattan, where there is a high daytime
population, but low residential population (Figure 2 and 4). The business location quotients helps to account for this dynamic, as illustrated in Figures 1 and 3,
the location quotients for both population and business show this trend (compare Figures 1 and 2 relative to Figures 3 and 4).
Figure 1 : Twitter business location quotient analysis. Figure 2: Twitter population location quotient analysis.
Figure 3 : Foursquare business location quotient analysis. Figure 4: Foursquare population location quotient analysis.
The population location quotient appears to better account for Twitter’s underlying user population while the business location quotient for Foursquare appears to account for the dynamics of it’s user base more accurately. Twitter users do not tend to use the application to check-‐in to specific businesses. In contrast, Foursquare is developed specifically for that reason. This may account for the effectiveness of the business location quotient for Foursquare and the residential population quotient for Twitter. Foursquare’s business model is directly related to having users check-‐ in to businesses to obtain badges or win discounts on food, beverages, or other promotions at those locations. This tends to bias the check-‐ins towards business locations. Twitter does not have similar promotional devices to encourage users to engage in their social networking tool.
Local Moran’s Cluster Maps
Twitter Local Moran’s I Cluster Maps
Given that the Twitter population location quotient appears to better describe the
underlying “population at risk” , we highlight the results of the LISA analysis to illustrate Twitters digital neighborhoods (Figure 5). The hot-‐spots (digital neighborhoods) found by applying the LISA analysis to Twitter population quotients appear to show those locations that are dominated by business activity with fewer residents as well as some neighborhoods which are experiencing shifting populations. For example, the analysis highlights the business corridors of Midtown and Lower Manhattan , Downtown Brooklyn, and regional shopping malls in Staten Island. Williamsburg and Long Island city also appear as hot-‐spots, both these neighborhood tend to attract younger people and are undergoing redevelopment which is causing a shift towards a younger more upwardly mobile population. Socio-‐demographic
descriptions of these neighborhoods show they are largely white, with roughly the same average age of the city overall, high amounts of businesses, and a population that is slightly less than average (Table 4). Cold spots appears to be in largely residential neighborhoods, one prominent cold spot is the Hasidic neighborhood in South Williamsburg.
Row Labels Average Income % White Average Businesses Median Age
NON-SIGNIFICANT $58,335 47.12 34 37
HIGH-HIGH $98,279 72.08 424 37
LOW-LOW $52,344 32.84 26 36
LOW-HIGH $74,100 53.43 45 39
HIGH-LOW $55,580 29.34 25 36
NEW YORK CITY STATS $51,865 45.50 49 36
Table 4 : Underlying demographics of LISA analysis using Twitter population location quotients.
Foursquare Local Moran’s I Cluster Maps
When identifying digitial neighborhoods in the Foursquare data we focus our discussion on the LISA results that use the business location quotient (Figure 6). As argued before, this better describes the underlying user population of Foursquare users. Foursquare’s digital neighborhoods have a population in their mid-‐thirties, largely white, and have higher incomes (Table 5). The neighborhoods highlight areas in the city which are associated with young and upwardly mobile populations such as Hell’s Kitchen, Union Square, the West and East Village, Williamsburg, areas in Brooklyn such as Carroll Gardens, Cobble Hill Prospect Heights and areas of Park Slope. Hot-‐spots also include neighborhoods such as Astoria Queens and Murray Hill in Manhattan, which have been popular by recent college graduates moving to the city, It also includes the neighborhood in and around Columbia University, highlighting the Foursquare’s young user base (Figure 6).
Cold Spots highlighted by the Foursquare LISA analysis using the business location quotient include areas in high immigrant communities in the Bronx, the Hassidic neighborhoods in South Williamsburg and areas which have less businesses and are largely residential. It is interesting to note that the the Hispanics communities of the Bronx appear as cold spots in contrast the Twitter LISA results which do not show these neighborhoods as hot or cold spots. Some studies have show that hispanics use Twitter in higher proportions than other social media applications, which likely account for this difference. It is not surprising that Foursquare’s digital
neighborhoods highlight its underlying users base which has a higher white population.
When comparing the hot spots of both the Twitter and Foursquare LISA analysis it is not surprising to find that digital neighborhoods are largely in New York City’s business districts including the Financial District, Midtown and Downtown Manhattan as well as Downtown Brooklyn, as these neighborhoods have a higher daytime population. What is more interesting, is that both analysis highlight Williamsburg and Long Island City, which are areas that are currently undergoing major redevelopment projects and are experiencing shifting populations. This may show that the changing character of these communities makes them more digitally oriented or that they are more attractive to a younger population which is
interested in using social media. The neighborhood around Columbia University is also highlighted as a digital neighborhood in both analysis which appears to show that Universities are more digitally oriented -‐ which is not surprising.
Figure 6 :LISA analysis using the Foursquare businesses location quotients.
Row Labels Average Income % White Average Businesses Median Age
NON-SIGNIFICANT $59,224 46.75 48 37
HIGH-HIGH $82,535 68.50 93 37
LOW-LOW $48,867 33.20 26 37
LOW-HIGH $72,053 43.43 137 37
HIGH-LOW $52,729 34.90 14 36
NEW YORK CITY
STATS $51,865 45.50 49 36
Table 5: Underlying demographics of LISA Analysis using Foursquare business location quotients.
Figure 7: Images of digital neighborhoods identified by the Foursquare data. While the LISA results shows a clear pattern of what we would call digital
neighborhoods, the results also highlight a divide in those places that use social media and those that do not. This divide is clearly seen in the analysis of the
Foursquare data which shows that digital “cold spots” tend to be in neighborhoods that have higher proportions of non-‐white populations and tend to have incomes levels lower than the city average. The cold spots in the Twitter data largely highlight residential areas further away from New York City’s central districts. The digital divide of neighborhoods in New York City warrants more investigation. In particular, question arise around whether neighborhoods that are less digitally oriented are losing out on business opportunities or social connections that could be made through social media. Does the divide highlight lack of access to the internet and smart phones that would allow them to participate in this type of social media activity? Are these neighborhoods missing out on essential information about the city because they don’t engage in social media?
The 2013 Pew Research Center study on the internet shows that hispanics are more likely to use instagram and populations overall are more likely to use Facebook
(Duggan and Brenner 2013). It would be helpful to add an analysis of the geo-‐locative results of these social media sites to our digital neighborhoods analysis to
determine if the digital divide we are seeing has more to do with Twitter and Foursquare user base or a true divide in how these neighborhoods engage in social media overall.
Summary and Conclusions
Robert Park (1915) defined neighborhoods based on the sentiments of groups of people. Social media data provides a way to explore these sentiments tagged by
location. Spatial analysis of this data allows us to define digital neighborhoods, highlighting those areas which social media users live and work and therefore may benefit from economic strategies that leverage the digital environment they
collectively create. At the same time mapping digital neighborhoods highlights those areas in the city which are not digitally oriented. These digital deserts remind us that not all citizens engage in social media or have access to infrastructure that would provide for that engagement. Mapping digital deserts can help cities identify the areas where they need to provide strategies that operate outside the digital environment. It can also highlight areas in the city where there residents have limited access to technology infrastructure and therefore do not engage in social media.
This analysis reminds us that big data analysis has the potential to describe the dynamics of the city at a scale previously unavailable. Yet at the same it exposes the inherent biases in big data. Foursquare and Twitter have a distinct user base, that use social media for specific reasons, and their digital neighborhoods highlight these differences. Foursquare users tend to be white males in the mid-‐thirties and their check-‐in locations highlight where that population goes. Twitter users are more diverse and overall Twitter’s digital neighborhoods are those locations which have a high Twitter daytime population -‐ business centers.
Understanding the overall population that might use social media at a given point is not trivial. This is because social media users are highly mobile and use the media anywhere they go. This means it is hard to compare use with census residential population estimates as social media is used at home, work and all the places in between. This is made easier by Foursquare, where users largely use the service to check-‐in to businesses. Therefore, using overall count of businesses as the
underlying population helps to generate more accurate picture of the density of use. The same is not true for social media sites such as Twitter, where the geo-‐location is not captured for a specific purpose, but simply as users interact with the application. In this case the best underlying population might be the total number of cell phone users, as almost everyone has a cell phone and those users bring that phone almost everywhere giving a better estimate of the possible population of use. However cell phone data is extremely hard to access even at aggregate levels. Location quotient results for the Twitter and Foursquare data had differing results because of the ease in which these underlying populations could be identified. The business location quotient turned out to be better at accounting for differences in the Foursquare use, and the census population figures did a little better for Twitter. Issues remain on how to accurately account for the daytime populations of central business districts. Future research comparing the results of digital neighborhoods in a number of cities other cities might help to understand whether the results also highlight
neighborhoods undergoing population shifts and economic transitions, such as our research identified. Seeing this pattern in multiple cities could help to address information and economic strategies that leverage the digital nature of these neighborhoods. In the same respects, understanding the cold spots of social media