DIRECT MEASURE OF RADIATIVE AND DYNAMICAL
PROPERTIES OF AN EXOPLANET ATMOSPHERE
The MIT Faculty has made this article openly available.
Please share
how this access benefits you. Your story matters.
Citation
Wit, Julien de, et al. “DIRECT MEASURE OF RADIATIVE AND
DYNAMICAL PROPERTIES OF AN EXOPLANET ATMOSPHERE.” The
Astrophysical Journal, vol. 820, no. 2, Mar. 2016, p. L33. © 2016 The
American Astronomical Society.
As Published
http://dx.doi.org/10.3847/2041-8205/820/2/L33
Publisher
American Astronomical Society
Version
Final published version
Citable link
http://hdl.handle.net/1721.1/114269
Terms of Use
Article is made available in accordance with the publisher's
policy and may be subject to US copyright law. Please refer to the
publisher's site for terms of use.
DIRECT MEASURE OF RADIATIVE AND DYNAMICAL PROPERTIES OF AN EXOPLANET ATMOSPHERE
Julien de Wit1, Nikole K. Lewis2, Jonathan Langton3, Gregory Laughlin4, Drake Deming5,Konstantin Batygin6, and Jonathan J. Fortney4
1
Department of Earth, Atmospheric and Planetary Sciences, MIT, 77 Massachusetts Avenue, Cambridge, MA 02139, USA 2
Space Telescope Science Institute, 3700 San Martin Drive, Baltimore, MD 21218, USA 3
Department of Physics, Principia College, Elsah, IL 62028, USA 4
Department of Astronomy and Astrophysics, University of California, Santa Cruz, CA 95064, USA 5
Department of Astronomy, University of Maryland at College Park, College Park, MD 20742, USA 6
Division of Geological and Planetary Sciences, California Institute of Technology, Pasadena, CA 91125, USA Received 2016 January 28; accepted 2016 February 18; published 2016 March 28
ABSTRACT
Two decades after the discovery of 51Pegb, the formation processes and atmospheres of short-period gas giants remain poorly understood. Observations of eccentric systems provide key insights on those topics as they can illuminate how a planet’s atmosphere responds to changes in incident flux. We report here the analysis of multi-day multi-channel photometry of the eccentric (e~0.93) hot Jupiter HD80606b obtained with the Spitzer Space Telescope. The planet’s extreme eccentricity combined with the long coverage and exquisite precision of new periastron-passage observations allow us to break the degeneracy between the radiative and dynamical timescales of HD80606b’s atmosphere and constrain its global thermal response. Our analysis reveals that the atmospheric layers probed heat rapidly(∼4 hr radiative timescale) from 500< to 1400 K as they absorb~20%of the incoming stellarflux during the periastron passage, while the planet’s rotation period is 93-+3585hr, which exceeds the predicted pseudo-synchronous period(40 hr).
Key words: methods: numerical – planet–star interactions – planets and satellites: atmospheres – planets and satellites: dynamical evolution and stability– planets and satellites: individual (HD 80606 b) – techniques: photometric
1. INTRODUCTION
The discovery of 51Pegb (Mayor & Queloz1995), the first
extrasolar planet orbiting a Sun-like star, was an epoch-making event. The now-famous 51 Pegb, which has P=4.23 days and Msin( ) =i 0.47MJup, rapidly became the prototype hot
Jupiter—gas giants on short-period orbits. In the past two decades, a substantial number of such planets have been observed and studied along their orbits (Charbonneau et al.
2002, 2005; Deming et al. 2005; Knutson et al. 2007). The
existence of hot Jupiters challenged standard planetary system formation and evolution theories developed in the context of our own solar system.
The mechanism of Kozai cycles with tidal friction, or KCTF (Eggleton & Kiseleva-Eggleton 2001; Wu & Murray 2003; Fabrycky & Tremaine2007), is an attractive process to explain
the current orbits of many of the known hot Jupiters. KCTF occur when a distant, sufficiently inclined stellar binary or planetary companion forces a planet on an initially long-period low-eccentricity(e<0.1) orbit to experience periodic episodes of very high eccentricity (e>0.5), a process known as Kozai cycling (Kozai 1962; Lidov 1962). During a planet’s closest
approach to its host star, periastron passage, tidal dissipation converts orbital energy into heat, thereby decreasing the planet’s semimajor axis. As the planet’s orbital period decreases, the Kozai oscillations are damped by general relativistic precession and other effects of comparable magni-tude, marooning the planet on an inclined, gradually circular-izing orbit. When orbital circularization is complete, the end product is a hot Jupiter in an orbit that is misaligned with the equator of the parent star.
The HD80606 system (Naef et al. 2001; Laughlin et al. 2009; Moutou et al. 2009), with its V=8.93 G5V
primary and M=3.94 MJup gas giant planet, appears to be an
excellent example of a planet embarking on the final circularizing phase of the KCTF process. The external solar-type binary perturbing star, HD80607, is plainly visible at a projected separation of ∼1000 au. The planet HD80606b, with a P=111.43637 days orbit, has an extremely high orbital eccentricity(e=0.93366) and al =42 sky-projected8 misalignment between the orbital and stellar spin angular momentum vectors(Moutou et al.2009; Winn et al.2009), and
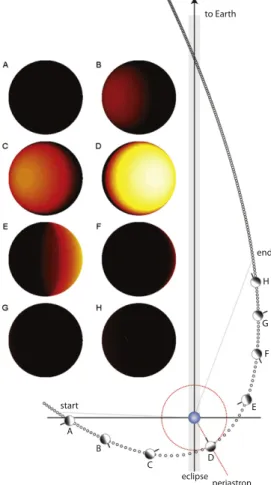
experiences strong, episodic radiative and tidal forcing as a result of periastron encounters that sweep the planet a mere 6Re from the stellar surface (the geometry of the system is
indicated in Figure1).
Weather variations in the atmosphere of HD80606 b are naturally expected to be extreme. The flux received by the planet intensifies by a factor f=((1+e) (1 -e))2 =850 between apoastron and periastron, with the major fraction of this increase coming during the 24 hr period prior to the periastron passage. The large, impulsive deposition of energy into the planetary atmosphere (equivalent to ∼1000× the energy delivered to Jupiter by the Shoemaker–Levy impacts) drives a global temperature increase that we have observed with Spitzer Space Telescopeʼs IRAC detector (Werner et al.2004).
2. OBSERVATIONS AND DATA REDUCTION Using the 4.5μm channel of the IRAC detector in subarray (32 × 32 pixel) mode, we obtained a series of 676,000 photometric measurements of HD80606 in two successive blocks of 50 and 30 hr starting on UT 2010 January 06 and ending on 2010 January 09, with a 0.4 s exposure time. The first block started 34 hr before the periastron passage at HJD
2455204.91. The second block started after a three-hour interruption for data transfer following the acquisition of the first block. In addition, we have re-analyzed a separate (shorter) set of photometric measurements obtained in 2007 using Spitzerʼs 8.0 μm channel (Laughlin et al.2009).
2.1. Spitzer 4.5 mm Photometry
We calculate the time at mid-exposure for each image from time stamps stored in the FITS header. For each FITSfile, we determine the background level of each of the 64 subarray images from the pixels located outside a 10 pixel radius, excluding anyflagged hot, bright or peripheral pixels. Using a histogram of the measured background pixel values we discard the 3σ outliers from the background pixels. We estimate the background value based on the median of the undiscarded background pixels. We then subtract this background value from each image. From the background subtracted image, we determine the stellar centroid based on aflux-weighted centroid method using a circular aperture with a radius of 4 pixels (Knutson et al.2008; Lewis et al.2013). We estimate the stellar
flux from each background subtracted image using a circular aperture centered on the estimated position of the star. We optimize our choice of aperture individually for each AOR
looking both at the white and red noise contributions for time-varying andfixed apertures (Knutson et al.2012; Lewis et al.
2013). We find that for all the AORs time-varying apertures
equal to the square root of the noise pixel parameter ˜b with a constant offset minimize the scatter and the relative amount of red noise in thefinal time series and have an average aperture of 1.8 pixels.
Finally, we remove outliers from our final time series sets using 4σ moving filters with widths of 64, 1000, 2000, and 4000 on the photometry and the centroid position. The use of multiple large filters allow us to remove pointing excursions with longer (∼1 minute) durations, such as those due to micrometeorite impacts on the spacecraft. We find that these pointing excursions are relatively rare, and these large filters account for less than 15% of the total outliers. Overall, we discard 0.7% of the images.
2.2. Spitzer 8.0 mm Photometry
The same procedure is applied to reduce the 8.0μm photometry, although the observations are obtained in fullarray mode. Wefind that for all the 8.0 μm AORs a fixed aperture equal to 2.7 pixels minimize the scatter and the relative amount of red noise in thefinal time series. Overall, we discard 4.7% of the images.
3. PHOTOMETRY ANALYSIS
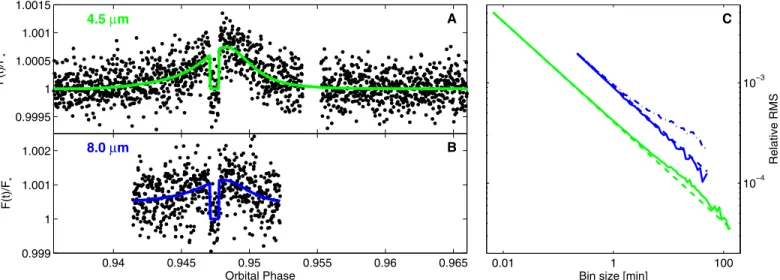
The photometric reduction process for these data is complicated by a number of well-documented observational artifacts that combine to generate spurious∼1%-level fluctua-tions in the raw photometry. We correct for these instrumental systematics using standard techniques described below allow-ing us to reach photometric precisions of 55 and 100 ppm per 1 hr bin at 4.5 and 8.0μm, respectively. The resulting 0.1% flux variation of the system during the course of the observations is shown in Figure2.
We analyze HD80606ʼs photometry using a method previously introduced in the literature(de Wit et al. 2012; de Wit2015). The method is implemented as an adaptive Markov
Chain Monte Carlo (MCMC) (Gregory 2005; Ford 2006)
algorithm, allowing us to stochastically sample the posterior probability distribution for our chosen model, providing an estimate of the best-fit model parameters, their uncertainties, and any covariances between parameters. We update the method to include the transient heating of the planet’s atmosphere due to its eccentric orbit.
3.1. Nominal Model
We use a simple energy-conserving model of the planet’s global atmospheric response to estimate the atmospheric properties of HD80606b by fitting the time series data. The model assumes that the photometry is unaffected by any advective hydrodynamical response, and that the planet has a uniform global temperature, T0, 50 hr prior to its periastron
passage, which is consistent with predictions from global circulation models for exoplanets on high eccentricity orbits (Langton & Laughlin 2008; Kataria et al. 2013; Lewis et al.
2014). For both the 4.5 μm and the 8.0 μm channels, at each
point on a planetary latitude(θ) longitude (f) grid, and at each time stamp, we compute the rate of temperature change T˙ using T˙ =gT(Teq4 -T ,4) ( )1
Figure 1. The HD80606 system. Dots indicate orbital positions of the planet at one-hour intervals relative to the periastron passage at HJD 2455204.91. The phase coverage of the 80 hr 4.5μm observations is indicated by the gray lines labeled“start” and “end.” The star is drawn to scale relative to the orbit. The temperature distribution of the planet (as seen from an observer on Earth, looking down the y-axis) at times A–H is shown as the series of inset diagrams. The brightness temperature scale runs from 500 K(black) 1500 K (white). The Hut(1981) pseudo-synchronous rotation is indicated by the black lines at the planet surface.
where g is a parameter related to the radiative response rateT and Teq(t,f q is the temporally and spatially varying, ) equilibrium temperature of the atmosphere. Specifically, we take T f L r T 4 cos . 2 eq4 ⎜ 2⎟ 04 ( ) ⎛ ⎝ ps* ⎞⎠ a = +
In the above equation, the instantaneous star–planet distance, r, is r =a(1-ecosE), where a is the semimajor axis and E is the eccentric anomaly, which is related to the mean anomaly, , through Kepler’s equation, =E-esinE. The absorptivity, f, is the fraction of the incoming stellar flux absorbed at the photospheric layer,σ is the Stefan–Boltzmann constant anda=cos( )q cos(f-2pt Prot)is the zenith angle
of the star. Following Iro et al.(2005), Seager et al. (2005), we
derive the radiative timescale near the photosphere as T T 1 . 3 T rad( ) 3 ( ) t g =
In order to report a single radiative timescale for the entire planet, we computet fromrad g after adopting aT fiducial value,
T¯ =1200K—which correspond to an average of the tempera-tures reached locally within the irradiated part of HD80606b’s photosphere during the periastron passage.
Our model thus incorporates four measurable parameters for each channel, each with clear physical meaning: (1) g thatT relates to the radiative timescale t , which depends on therad
atmospheric depth of the infrared photospheres;(2) the fraction f of incoming flux absorbed at the photospheric layer, (3) the planetary rotation period Prot, which determines the substellar
longitude at any given time; and (4) the temperature out-of-irradiation, T0, which constrains the contribution of tidal
heating to the atmosphere’s energy budget. As our data contain only phase-curve and secondary-eclipse measurements, wefix the values of the planet’s orbital configuration to the one estimated in Hébrard et al. (2010).
3.2. Pixelation Effect and Intrapixel Sensitivity Variations The change in position of the target’s point-spread function (PSF) over a detector with non-uniform intrapixel sensitivity leads to apparent flux variations that are strongly correlated with the PSF position. Studies have demonstrated that an empirical“pixel mapping” method produces optimal results for bright stars and longer time series observations (Ballard et al. 2010; Stevenson et al. 2012; Lewis et al. 2013). Here,
we use the same implementation of the pixel-mapping method as in Lewis et al.(2013).
We find that accounting for intrapixel sensitivity also improve significantly the correction of observations at 8.0 μm (Figure 2(C)), as previously pointed out by Stevenson et al.
(2010). In particular, we find that accounting for such
systematics decreases the red noise contribution by 66%(i.e., more than a factor two smaller).
3.3. Detector Ramp
IRAC observations often display an exponential increase in flux at the beginning of a new observation. Similarly to Lewis et al.(2013), we trim the first hour at the start of each 4.5 μm
observation and subsequent downlinks which reduces the complexity of ourfits by removing the exponential trend with minimal loss of information on the eclipse shape and time. Similarly to Agol et al.(2010), we correct for the 8.0 μm ramp
using a double exponential.
3.4. Time-correlated Noise and Uncertainty Estimates Wefind that the standard deviation of our best-fit residuals is a factor of 1.09 and 1.19 higher than the predicted photon noise limit at 4.5 and 8.0μm, respectively. We expect that this noise is most likely instrumental in nature, and account for it in our error estimates using a scaling factorbred for the measurement
errobars(Gillon et al.2010a). We find that the averagebred in
the 4.5 and 8.0μm channels are 1.3 and 1.15 (Figure2(C)).
Figure 2. Left: HD80606ʼs photometry at 4.5 (A) and 8.0 μm (B). The photometry (black dots) is shown with the instrumental effects removed and binned into three minute interval. We overplot the best-fit model light curve as plain lines (in green and blue for the 4.5 and 8.0 μm channels, respectively). Right: standard deviation of the best-fit residuals vs. bin size for the 4.5 and 8.0 μm HD 80606 observations (C). The standard deviations of residuals vs. bin size are shown as plain lines for each channel together with the expected behavior of Gaussian noise with binning(dashed lines). The dashed–dotted blue line shows the same quantity for the best-fit light-curve obtained at 8.0μm while not accounting for intrapixel sensitivity variation.
4. RESULTS AND DISCUSSION
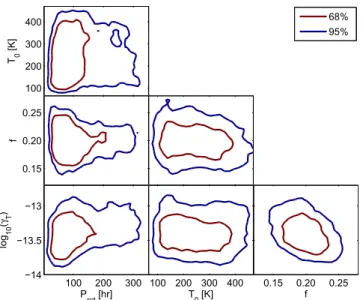
Inspection of the light curve reveals that there is a rapid rise in infrared flux from the planet during the hours prior to the periastron passage. The occultation of the planet establishes a baseline stellar flux, and demonstrates that the planet is not radiating strongly enough to be detectable at the start of the 4.5μm time series. Following periastron passage, both the 4.5μm and the 8.0 μm time series display rapid flux decreases from the planet. The waning planetaryflux can be attributed to a combination of photospheric cooling and the rotation of the heated atmospheric area from the line of sight. The final 30 hr of the time series show no evidence of any resurgence of flux from the planet implying that the radiative timescale of the atmospheric layer probed at 4.5μm is significantly shorter than the planet’s rotation period. Table 1gathers the key quantities constrained in the present study. We present in Figure 3 the posterior distribution of the atmospheric model parameters that shows no sign of correlation. The plotted distribution is obtained from a fit using the same atmospheric model parameters for HD80606b’s 4.5 and 8.0 μm photospheres as the consistency of their individual estimates suggest over-lapping between both photospheres.
We find that Prot 93 35 85
= -+ hr for HD80606b, which
provides an observational insight into the relation between spin and orbit rotation rates of eccentric planets. In contrast to planets on circular orbits, eccentric planets experience a widely varying orbital velocity that prevents the planets from achieving spin–orbit synchronization. It is expected that tidal forces drive eccentric planets into a state of pseudo-synchronous rotation in which the spin frequency is of order the instantaneous circular orbital frequency near periastron. The model that is generally adopted for this process is that of Hut (1981), which draws on the equilibrium tidal theory of
Darwin(1908), (and which was qualitatively invoked by Peale
& Gold 1965 to explain Mercury’s asynchronous spin). For HD80606b, this period is P =39.9 hr, which is in mild tension with our measurement. Although there exist alternative theories to Hut (1981), these suggest rotation periods smaller
than Hut (1981). For example, Ivanov & Papaloizou (2007)
argue that the spin frequency of a pseudo-synchronous satellite should be 1.55 times the circular orbital frequency at periastron, yielding Prot=28hr. The measured rotation period of HD80606b could imply either a recent initiation of the synchronization process or that its efficiency is lower than predicted. Simultaneously, we note that our derivation of the rotation rate from the light curve may be contaminated by additional physical effects(such as changes in the atmospheric composition) for which our model does not account. While
such detailed modeling is beyond the scope of this work, it constitutes an important avenue for future analysis.
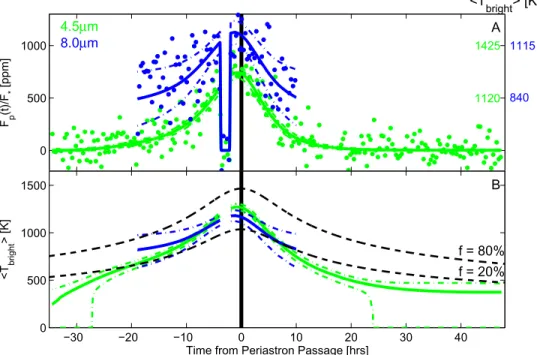
Our measurements reveal that the global temperature of the probed atmospheric layers increases rapidly from <500 to 1400 K during the periastron passage(Figure4). The shape of
the planetaryfluxes as a function of time—including the shift of the peakflux from periastron passage and overall symmetry of the response—implies that the photospheric layers at 4.5 and 8.0μm absorb 19.9±2.1 and 13.6±4.5% of the incoming stellar flux and have a radiative timescales of 4.04 1.55
2.57
and 1.28 1.04
6.08
hr, respectively. The hemisphere-averaged brightness temperatures(Figure4(B)) and the parameter estimates for the
4.5 and 8.0μm photospheres are consistent at the 1-sigma level suggesting significant overlap in the atmospheric pressure levels probed by each bandpass. The atmospheric properties estimated near the 4.5 and 8.0μm photospheres suggest that pressures near the ∼10–100mbar and t =1 5 level in the optical are being probed by these bandpasses. HD80606b’s marginal brightness through the bulk of its orbit implies either the presence of significant cloud coverage that suppresses the planet’s observable thermal emission, similarly to Demory et al. (2013), or a marginal thermal emission. Assuming
HD80606b’s atmosphere to be cloud free, this implies that HD80606b’s atmosphere undergoes a transient thermal inversion during the periastron passage as predicted in Lewis et al.(2014). Furthermore, the Stefan–Boltzmann law implies a
tidal luminosity Ltid 4 Rp2 T0 2 10
4 20
p s
< ´ ´ W.
Assum-ing that the tidal heat is primarily dissipated in the deep interior and dominates other internal heat sources, this value can be used to place an upper limit on the planet’s tidal quality factor Q, through the relation (Wisdom2008):
L k Q GM R n a e 21 2 L , 4 2 2 5 6 z ( ) ( ) = Table 1
HD 80606 B’s Atmospheric Parameters Constrained from Phase Curve Measurements
4.5μm 8.0μm
Eclipse depth(ppm) 651±49 1053±94
Phase-curve peak(ppm) 738±52 1105±121
Absorptivity(f) 0.199±0.021 0.136±0.045
Radiative timescale(t ) (hr)rad 4.041.552.57 1.281.046.08
3σ upper limit on T0(K) 493 1205
Rotation period(Prot) (hr) 933585
Figure 3. Posterior distribution of the atmospheric model parameters (Section 3.1). The contours encompasses 68% and 95% of the distribution obtained from a globalfit using the same model for HD 80606 b’s 4.5 and 8.0 mm photospheres. The distribution shows no significant correlation between the model parameters.
giving Q>2.5´106. This value would indicate that
HD80606b is much less dissipative than any of the solar system planets. For example, estimates of the tidal quality factor of Jupiter give QJup =3 ´104, based on measurements of the secular accelerations of the Jovian satellites (Lainey et al. 2009). A comparatively low rate of tidal energy
dissipation within HD80606b would then be consistent with it having retained a large eccentricity and a large rotation period in the face of billions of years of tidal evolution.
5. CONCLUSIONS
Our analysis of Spitzerʼs phase curve data for HD80606b has provided critical insights into the planet’s atmospheric and interior properties. Data analysis techniques and our under-standing of systematics for Spitzer observations have greatly improved since the original reduction of the 8.0μm data by Laughlin et al. (2009), which provided the first estimate for
radiative timescales in hot Jupiter atmosphere. By reanalyzing the 8.0μm data and combining it with a longer baseline 4.5 μm data set, we obtained independent constraints on the radiative and dynamical timescales and absorptivity of HD80606b’s 4.5 and 8.0μm photospheres. Our new estimates of the radiative timescales are consistent with Laughlin et al.(2009)
and support inefficient transport of energy from the dayside to the nightside of the planet—the observations presented here do not provide further constraints on HD80606b’s atmospheric dynamics. The long temporal baseline of the 4.5μm data also allowed for constrains on the internal temperature of HD80606b, which together with those on its rotation period have challenged assumptions generally made on tidal dissipa-tion in hot Jupiters. Although it is plausible that addidissipa-tional
processes such as cloud formation play a role in shaping HD80606b’s phase-curve, the planet’s response near perias-tron passage will be dominated by radiative processes that are well described by our simple physical model. A transient thermal inversion will form near the probed photospheres (above any cloud decks) that will dominate the planetary flux signal from which the absorptivity, radiative timescale, and rotation rate were derived. Therefore, only the insights derived from the T0parameter may be affected. In order to get further
insights into HD80606b’s atmospheric and formation pro-cesses, complementary observations at shorter and longer wavelengths are required to constrain the extent to which scattering and emission processes are shaping its flux near periastron.
JdW thanks the Zoweh crew for their hospitality during part of this work. This work is based on observations made with the Spitzer Space Telescope, which is operated by the Jet Propulsion Laboratory, California Institute of Technology, under contract to NASA. Support for this work was provided by JPL/Caltech.
REFERENCES
Agol, E., Cowan, N. B., Knutson, H. A., et al. 2010,ApJ,721, 1861 Ballard, S., Charbonneau, D., Deming, D., et al. 2010,PASP,122, 1341 Charbonneau, D., Allen, L. E., Megeath, S. T., et al. 2005,ApJ,626, 523 Charbonneau, D., Brown, T. M., Noyes, R. W., & Gilliland, R. L. 2002,ApJ,
568, 377
Darwin, G. 1908, Scientific Papers, Vol. 2 (New York: Cambridge Univ. Press) Deming, D., Seager, S., Richardson, L. J., & Harrington, J. 2005, Natur,
434, 740
Demory, B.-O., de Wit, J., Lewis, N., et al. 2013,ApJL,776, L25
Figure 4. HD 80606 b’s transient heating observed in Spitzer/IRAC 4.5 and 8.0 μm bands. (A) HD 80606 b’s relative thermal fluxes in Spitzer/IRAC 4.5 and 8.0 μm bands as a function of the time from periastron passage. Quantities shown in green and blue refer to measurements obtained at 4.5 and 8.0μm, respectively. The photometry corrected for the instrumental effects and binned into twenty-minute intervals is shown asfilled dots. The median models and their 1σ envelope are shown as plain and dashed–dotted lines, respectively. The larger extent of the 1σ envelope at 8.0 μm is due to a uncertainty on the measurements that is 2.1 times larger than at 4.5μm and to a smaller time coverage combined with instrumental effects. Conversion of the relative planetary fluxes to hemisphere-averaged brightness temperature are shown on the right for each channel.(B) HD 80606 b’s hemisphere-averaged brightness temperature as a function of the time from periastron passage derived from the planetaryfluxes introduced in (A). The dashed lines represent the equilibrium temperature of a planet assuming full and instantaneous energy redistribution for an absorptivity of 0.8 and 0.2(Seager2010).
de Wit, J. 2015, PhD thesis, Massachusetts Inst. of Technol. (arXiv:1509.01493)
de Wit, J., Gillon, M., Demory, B.-O., & Seager, S. 2012,A&A,548, A128 Eggleton, P. P., & Kiseleva-Eggleton, L. 2001,ApJ,562, 1012
Fabrycky, D., & Tremaine, S. 2007,ApJ,669, 1298 Ford, E. B. 2006,ApJ,642, 505
Gillon, M., Lanotte, A. A., Barman, T., et al. 2010a,A&A,511, A3 Gregory, P. C.(ed.) 2005, Bayesian Logical Data Analysis for the Physical
Sciences: A Comparative Approach with “Mathematica” Support (Cambridge: Cambridge Univ. Press)
Hébrard, G., Désert, J.-M., Díaz, R. F., et al. 2010,A&A,516, A95 Hut, P. 1981, A&A,99, 126
Iro, N., Bézard, B., & Guillot, T. 2005,A&A,436, 719 Ivanov, P. B., & Papaloizou, J. C. B. 2007,MNRAS,376, 682 Kataria, T., Showman, A. P., Lewis, N. K., et al. 2013,ApJ,767, 76 Knutson, H. A., Charbonneau, D., Allen, L. E., Burrows, A., & Megeath, S. T.
2008,ApJ,673, 526
Knutson, H. A., Charbonneau, D., Allen, L. E., et al. 2007,Natur,447, 183 Knutson, H. A., Lewis, N., Fortney, J. J., et al. 2012,ApJ,754, 22 Kozai, Y. 1962,AJ,67, 591
Lainey, V., Arlot, J.-E., Karatekin, Ö, & van Hoolst, T. 2009,Natur,459, 957 Langton, J., & Laughlin, G. 2008,ApJ,674, 1106
Laughlin, G., Deming, D., Langton, J., et al. 2009,Natur,457, 562 Lewis, N. K., Knutson, H. A., Showman, A. P., et al. 2013,ApJ,766, 95 Lewis, N. K., Showman, A. P., Fortney, J. J., Knutson, H. A., & Marley, M. S.
2014,ApJ,795, 150 Lidov, M. L. 1962, P&SS,9, 719
Mayor, M., & Queloz, D. 1995,Natur,378, 355
Moutou, C., Hébrard, G., Bouchy, F., et al. 2009,A&A,498, L5 Naef, D., Latham, D. W., Mayor, M., et al. 2001,A&A,375, L27 Peale, S. J., & Gold, T. 1965,Natur,206, 1240
Seager, S.(ed.) 2010, Exoplanet Atmospheres: Physical Processes (Princeton, NJ: Princeton Univ. Press)
Seager, S., Richardson, L. J., Hansen, B. M. S., et al. 2005,ApJ,632, 1122 Stevenson, K. B., Harrington, J., Fortney, J. J., et al. 2012,ApJ,754, 136 Stevenson, K. B., Harrington, J., Nymeyer, S., et al. 2010,Natur,464, 1161 Werner, M. W., Roellig, T. L., Low, F. J., et al. 2004,ApJS,154, 1 Winn, J. N., Howard, A. W., Johnson, J. A., et al. 2009,ApJ,703, 2091 Wisdom, J. 2008,Icar,193, 637
Wu, Y., & Murray, N. 2003,ApJ,589, 605