HAL Id: hal-00318161
https://hal.archives-ouvertes.fr/hal-00318161
Submitted on 13 Sep 2006
HAL is a multi-disciplinary open access
archive for the deposit and dissemination of
sci-entific research documents, whether they are
pub-lished or not. The documents may come from
teaching and research institutions in France or
L’archive ouverte pluridisciplinaire HAL, est
destinée au dépôt et à la diffusion de documents
scientifiques de niveau recherche, publiés ou non,
émanant des établissements d’enseignement et de
recherche français ou étrangers, des laboratoires
BY»0: longitudinal and latitudinal cusp aurora
bifurcations
S. Massetti
To cite this version:
S. Massetti. Antiparallel magnetic merging signatures during IMF BY»0: longitudinal and latitudinal
cusp aurora bifurcations. Annales Geophysicae, European Geosciences Union, 2006, 24 (8),
pp.2299-2311. �hal-00318161�
www.ann-geophys.net/24/2299/2006/ © European Geosciences Union 2006
Annales
Geophysicae
Antiparallel magnetic merging signatures during IMF B
Y
0:
longitudinal and latitudinal cusp aurora bifurcations
S. MassettiIstituto di Fisica dello Spazio Interplanetario IFSI-INAF, Italy
Received: 24 March 2006 – Revised: 13 June 2006 – Accepted: 17 July 2006 – Published: 13 September 2006
Abstract. A prominent dayside auroral event, occurred
dur-ing an IMF BY-dominated time interval, and characterized
by the contemporaneous longitudinal and latitudinal cusp bifurcations, is reported. The event was recorded the 19 December 2002, between about 09:30–10:45 UT, by the ITACA2 twin auroral monitors system, in the Greenland-Svalbard zone. The splitting of the ionospheric footprint of the geomagnetic cusp, traced by the dayside auroral activ-ity, was recently identified with the signatures of antiparal-lel reconnection episodes ongoing at different magnetopause locations, during large IMF BY periods. The first part of
the event showed a broad longitudinal bifurcation of the red-dominated cusp aurora, displaced in the prenoon and postnoon, with a separation up to ∼1800 km, during north-east directed IMF (clock-angle rotating from 45◦ to 90◦).
This observation widens the range of IMF regimes that are known to drive a longitudinal bifurcation of the cusp, since previous case-studies reported these events to occur during southeast/southwest oriented IMF (clock-angle ≈135◦). The second part of the event, developed when the IMF turned to a nearly horizontal orientation (BY 0, BZ∼0,
clock-angle ∼90◦), and exhibited the simultaneous activation of the cusp auroras in three distinct areas: i) two of them asso-ciated to the above-mentioned longitudinally bifurcated cusp (∼73◦–75◦ CGM latitude, type 1 cusp aurora), and linked to (near)antiparallel magnetic reconnection patches equator-ward the northern and the southern cusp, ii) the other one characterized by isolated high-latitude (∼76◦–77◦CGM lat-itude, type 2 cusp aurora) rayed arc(s) with intense green emission, and triggered by (near)antiparallel merging at the northern lobe (usually observed during positive IMF BZ), poleward the local cusp. During this phase, the longitudi-nal separation of the low-latitude type 1 cusp aurora was about 1000 km wide, with a 500 km gap, while the latitudinal
Correspondence to: S. Massetti (stefano.massetti@ifsi-roma.inaf.it)
separation between low- (type 1) and high-latitude (type 2) cusp auroras, in the postnoon, was about 270–280 km at its maximum. The longitudinal gap, corresponding to a zone with weak auroral emission, was found to likely map to the component reconnection region at the subsolar magne-topause. The magnetic merging topology that can be drawn on the basis of the reported cusp auroras support the idea of a “mixed” merging scheme, with (near)antiparallel recon-nection at high-latitudes, and component reconrecon-nection in the subsolar region, as recently proposed by other authors.
Keywords. Magnetospheric physics (Solar wind-magnetosphere interactions) – Ionosphere (Ionosphere-magnetosphere interactions) – Space plasma physics (Magnetic reconnection)
1 Introduction
It is well-known that the solar wind – magnetosphere – iono-sphere coupling on the dayside can be schematically outlined in terms of the IMF BZcomponent. When this parameter is
negative, the magnetic reconnection is favored and occurs at low-latitudes, equatorward the geomagnetic cusps. On the contrary, when the IMF BZ is positive, the magnetic
merg-ing is confined on the geomagnetic lobes (high-latitudes), poleward each cusp. More generally, the presence of a non-zero IMF BY component leads to intermediate reconnection
topologies, which can be conveniently categorized by means of the so-called IMF clock-angle, defined as follow:
θ =tan−1(|BY| /BZ) for BZ>0 θ = π −tan−1(|BY/BZ|) for B
Z<0
(1)
The clock-angle is maximum (180◦), when BZ<0 and BY=0,
is equal to 90◦, when BZ=0 and BY6=0, and reduces to zero,
when BZ>0 and BY=0. In the recent past, there has been
an increasing interest in the study of the response of the
Figure 1. Sketch of the dayside merging topology for a horizontal IMF (clock-angle = 90°), on the basis of the
results of Moore et al. (2002), drawn by adapting the original figure in Sandholt et al. (2004). Component (II)
and (near)antiparallel merging regions (I, III, IV) are evidenced, together with the associated dayside aurora
signatures mapping to the northern cusp.
Fig. 1. Sketch of the dayside merging topology for a horizontal
IMF (clock-angle = 90◦), on the basis of the results of Moore et al. (2002), drawn by adapting the original figure in Sandholt et al. (2004). Component (II) and (near)antiparallel merging regions (I, III, IV) are evidenced, together with the associated dayside au-rora signatures mapping to the northern cusp.
magnetospheric-ionospheric system during periods that are characterized by a significant horizontal IMF component, that is, |BY/BZ|>1, or even 1 (θ ∼90◦). See, for
exam-ple, McCrea et al. (2000); Maynard et al. (2002); Nˇemeˇcek et al. (2003); Sandholt and Farrugia (2003); Sandholt et al. (2004); Trattner et al. (2005); Massetti (2005).
The magnetic merging topologies and the related iono-spheric signatures, under the effect of a significant IMF BY
component, vary substantially among the different recon-nection theories: the antiparallel reconrecon-nection model (e.g.: Crooker, 1979; Luhmann et al., 1984), the component re-connection model (e.g. Cowley, 1976; Cowley and Owen, 1989), and the “mixed” reconnection model (Moore et al., 2002; Sandholt et al., 2004). Following the first theory, mag-netic merging can occur only where the magnetosheath and magnetospheric fields are antiparallel, or nearly antiparallel (high-shear regime), a condition that is satisfied in the high northern/southern latitudes in the postnoon/prenoon sector, for positive IMF BY, and vice versa for negative IMF BY. In
this case, no merging is present in the subsolar region. On the contrary, for the component reconnection theory there is no such a stringent condition, and the magnetic merging
can take place between fields with any orientation, along a tilted X-line that cross the subsolar region, approximately rotated by θ /2 with respect to the equatorial plane. Finally, the “mixed” model states the merging takes place along an S-shaped X-line that crosses the subsolar region and wraps around the cusps, and can be viewed as a superimposition of component reconnection, at lower latitudes, and antiparallel reconnection, at higher latitudes (see Figs. 2 and 4 in Moore et al., 2002). Figure 1 shows a sketch of the dayside merg-ing topology durmerg-ing a horizontal IMF (BY>0, and BZ=0)
ac-cording to the results of Moore et al. (2002), drawn by adapt-ing the original figure (Fig. 25) in Sandholt et al. (2004). In the high-latitude Northern Hemisphere, the effect of the antiparallel reconnection is to produce three distinct iono-spheric signatures: two of them are linked to reconnection patches equatorward the southern and the northern cusps, occurring at different magnetic local time in the two hemi-spheres (marked as I, and III), while the third one is con-nected to magnetic merging poleward the local northern cusp (marked as IV).
The spatial separation between the merging regions I and III produces a split of the cusp, often referred as “longitudi-nal cusp bifurcation”, because the northern and southern cusp footprints are shifted away from the magnetic noon (in op-posite directions), due to the non-zero IMF BY-component.
When BY is positive, the northern longitudinally bifurcated
cusp is composed of the local (main) cusp, displaced in the postnoon, and a prenoon footprint magnetically conjugated to the reconnection region near (equatorward) the southern cusp. The gap, between the footprints of regions I and III, corresponds to the subsolar component reconnection region (marked as II); here the magnetic merging is progressively less effective as the IMF clock-angle decreases, with a pos-sible cutoff below 40◦–50◦(Gosling et al., 1982, 1990; Phan and Paschmann, 1996). An interesting feature of the “mixed” model is that the merging region II, and the resulting gap aurora, is noticeably shifted in the prenoon (Sandholt et al., 2004).
A second kind of cusp splitting arises from the spatial sep-aration between the merging regions III and IV, due to the simultaneous merging equatorward the local cusp and pole-ward of it (latitudinal cusp bifurcation). The latter is often termed “lobe reconnection”, and is typically observed during northward IMF, but there are observational evidences that it can also take place during IMF BY-dominated time intervals
(e.g.: McCrea et al., 2000; Sandholt et al., 2001).
The dayside (cusp) auroras are a unique tool to track the large-scale reconnection process taking place at the dayside magnetopause, and the analysis of both ground- and space-based auroral observations can provide important informa-tion on the merging topologies. Although the relatively small field-of-view of a single ground-based imager, with respect to the ionospheric cusp footprint extension, and/or the low spatial and temporal resolution of the space-based instru-ments can constitutes an obstacle, particularly during IMF
BY-dominated periods, when the cusp aurora activity spreads considerably in longitude.
In this work, we analyze a remarkable dayside auroral event that took place the 19 December 2002, between 09:30– 10:45 UT. It was recorded by the ITACA2twin all-sky cam-eras system, devoted to the high-latitude auroral imaging, in the Greenland-Svalbard sector. The wide field-of-view of ITACA2allows to observe a broad zone in the high-latitude ionosphere, and hence to perform a comparison between ground-recordings and space-based data. The event key-features are: i) a wide longitudinal cusp bifurcation during north-east directed IMF, ii) the contemporaneous occurrence of longitudinal and latitudinal cusp bifurcations, during hor-izontal IMF condition (that is: |BY| 0 and BZ∼0).
In the following section (Sect. 2), a brief description of the datasets used in the analysis, is given. In Sect. 3, the cusp aurora activity is discussed in relation to the magnetic merg-ing topologies, as a function of the IMF clock-angle, as fol-low: longitudinal cusp bifurcation (45◦≤θ ≤90◦, Sect. 3.1), latitudinal cusp bifurcation (θ '90◦, Sect. 3.2), and auro-ral dynamics during horizontal IMF (θ '90◦, Sect. 3.3). A comparison with the observations obtained by the FUV in-struments onboard the IMAGE satellite is then reported in Sect. 4, while the conclusions are summarized in Sect. 5.
2 Datasets
This study is based on the analysis of the dayside au-roral event occurred 19 December 2002, between 09:30– 10:45 UT. The following datasets were used:
– Ground-based red- and green-line (630.0 nm, 557.7 nm)
aurora images from the ITACA2 all-sky camera database (IFSI-INAF, PNRA). The all-sky images recorded by the two ITACA2 stations, located at the Svalbard (ITACA-NAL, Ny- ˚Alesund, 78.92◦N, 11.93◦E), and on the east coast of Greenland
(ITACA-DNB, Daneborg, 74.30◦N, 20.22◦W), were
com-bined to obtain a resulting field-of-view of about 20◦MLAT×135◦MLON (i.e.: about 09:00 MLT),
cen-tered at about 75.5◦of magnetic latitude;
– Space-based far ultraviolet auroral images obtained by
the WIC (Wide-Band Imaging Camera, 140–180 nm), SI12, and SI13 (Spectrographic Imager, 121.82 nm and 135.6 nm) IMAGE-FUV imagers, on-board the IMAGE satellite (Imager for Magnetopause-to-Aurora Global Exploration);
– Spectrograms from the DMSP F13 (09:10–09:13 UT,
and 10:40–10:56 UT), F14 (10:39–10:44 UT), and F15 (09:38–09:43 UT) satellite transits, were used to catego-rize the particle precipitation region within the ITACA2 field-of-view, thanks to the automated region identifica-tion algorithm (JHU/APL);
– Plasma and magnetic field data obtained by the CPI and
MGF instruments onboard the Geotail satellite (NASA Goddard Space Flight Center dataset), were employed to inspect the solar wind conditions during the devel-oping of the auroral event. Geotail was located on the Earth’s dawn side at about XGSE=8 RE, YGSE=−27 RE,
and ZGSE=5 RE, and the approximate time delay
be-tween the satellite data and the ionospheric signatures was estimated to be about 10 min in the period ≈10:00– 10:45 UT, by summing the propagation time from satel-lite to Earth’s magnetopause (1S−MP≈5 min), and from
magnetopause to ionosphere (1MP−IO≈2–3 min), and
by taking into account the 110 s mean lifetime associ-ated to the 630.0 nm red auroral emission (at 400 km of altitude).
3 Dayside auroral activity
The 19 December 2002 dayside event was recently discussed by the author (Massetti, 2005) from the point of view of the quasi-periodic cusp aurora activations, and the correlated ULF Pc5 ground magnetic variations, which occurred dur-ing the prolonged period of stable horizontal IMF (θ ∼90◦). The magnetic pulsations were found to be shaped as a train of traveling convection vortices (TCVs), developing close to the prenoon convection reversal boundary, and moving anti-sunward in phase with the transit of the auroral forms. That activity was found to have several aspects in common with quasi-periodic TCV events described by Clauer and cowork-ers (e.g.: Clauer, 2002, and references therein), observed un-der the same IMF condition (θ ∼90◦).
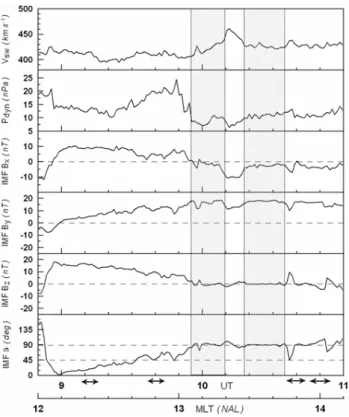
In this paper, we focus our attention to the simultaneous longitudinal and latitudinal cusp aurora bifurcations, and on the magnetic reconnection topology that can be inferred from the observed dayside aurora activity. Figure 2 reports the temporal trend of the interplanetary parameters: VSW, Pdyn,
IMF BX, IMF BY, IMF BZ and the clock-angle θ (Eq. 1),
in the time interval 08:50–11:00 UT. All the parameters are plotted with an estimated time lag of +10 minutes (see Sect. 2). The transit of the F13, F14 and F15 DMSP satellites across the ITACA2 field-of-view (Sect. 2) are indicated on the x-axis (arrows), while a supplementary x-axis shows the magnetic local time in Ny- ˚Alesund (MLT=UT+3:10). The shaded areas indicate two close periods with almost steady horizontal IMF (θ ∼90◦).
In the following, the event is discussed by subdividing the time period into three contiguous intervals, characterized by a smooth IMF rotation from northward to eastward, accord-ing to the IMF clock-angle θ regime:
– 09:00–09:27 UT, clock-angle 0◦≤θ ≤45◦;
– 09:28–09:54 UT, clock-angle 45◦≤θ ≤90◦;
– 09:55–10:45 UT, clock-angle θ '90◦.
Figure 2. Solar wind parameters derived from the Geotail data, plotted with a +10 minutes shift. The shaded areas mark the two periods (about 09:56-10:09UT, and 10:19-10:33UT) with almost steady clock-angle ~ 90°. These two periods are separated by a discontinuity in the solar wind. The four segments below the x-axis indicate the transit of the DMSP satellites.
Fig. 2. Solar wind parameters derived from the Geotail data, plotted
with a +10 min shift. The shaded areas mark the two periods (about 09:56–10:09 UT, and 10:19–10:33 UT) with almost steady clock-angle ∼90◦. These two periods are separated by a discontinuity in the solar wind. The four segments below the x-axis indicate the transit of the DMSP satellites.
3.1 Longitudinal cusp bifurcation during IMF clock-angle
≈45◦–90◦
We start the discussion from the abrupt 180◦rotation of the IMF occurred between 08:50–09:00 UT, when all the IMF components turned from negative to positive. In particular, the IMF BX and BZunderwent a sharp inversion, reaching
about +10 nT, and +18 nT, respectively (Fig. 2). Few min-utes later (09:08 UT), an intense red aurora spot emerged south of the Svalbard archipelago close to the local magnetic noon, at about 72◦–74◦ MLAT, that is, about two degrees below to the expected cusp location (∼75.5◦–76.0◦MLAT). This displacement was likely due to the unusually high so-lar wind dynamic pressure (∼12–14 nPa) (e.g.: Newell and Meng, 1992). That sudden activation of the cusp aurora is analogous to the one reported by Sandholt et al. (2000), af-ter a sharp turning of both IMF BXand BZ to positive
val-ues (∼10 nT). Between 09:08–09:27 UT, as the IMF clock-angle rotated from about 10◦to 45◦, the cusp aurora gradu-ally expanded longitudingradu-ally reaching a maximum extension of 40◦–50◦, at 09:22 UT, while some green rayed emission appeared at its poleward boundary.
Figure 3. A time-sequence illustrating the development of the longitudinal cusp bifurcation, as recorded by ITACA² monitors, between 09:27-09:56 UT. The original all-sky images were mapped to 400km of altitude, using AACGM coordinates. The local (northern) cusp ionospheric footprint is clearly visible in the top panel, centered at about 12 MLT, 73.5° MLAT. The cusp gradually bifurcates longitudinally as the IMF clock-angle rotated from about 45° to 90°, between 09:28-09:56 UT. The longitudinal separation was about 1’800 km, at the beginning of the sequence, while it reduced to about 1’200 when θ approaches 90° (see Table 1). The gap was maximum (~1’100 km) for θ ~ 45°-50°, and minimum (~550 km) for θ ~ 90°. Between 09:43-09:56, an abrupt change occurred in the solar wind dynamic pressure (Fig. 2). The solid lines mark the magnetic noon (12 MLT).
Fig. 3. A time-sequence illustrating the development of the
lon-gitudinal cusp bifurcation, as recorded by ITACA2 monitors, be-tween 09:27–09:56 UT. The original all-sky images were mapped to 400km of altitude, using AACGM coordinates. The local (northern) cusp ionospheric footprint is clearly visible in the top panel, cen-tered at about 12:00 MLT, 73.5◦MLAT. The cusp gradually bifur-cates longitudinally as the IMF clock-angle rotated from about 45◦ to 90◦, between 09:28–09:56 UT. The longitudinal separation was about 1800 km, at the beginning of the sequence, while it reduced to about 1200 when θ approaches 90◦(see Table 1). The gap was maximum (∼1100 km) for θ ∼45◦–50◦, and minimum (∼550 km) for θ ∼90◦. Between 09:43–09:56, an abrupt change occurred in the solar wind dynamic pressure (Fig. 2). The solid lines mark the magnetic noon (12:00 MLT).
As the IMF clock-angle approached 45◦, a second cusp
au-rora spot appeared above the east coast of Greenland, at about 09:30 MLT, and 72◦MLAT. Figure 3 shows the map projec-tion of the red aurora emission obtained by merging the all-sky camera images taken from both ITACA-NAL (Svalbard) and ITACA-DNB (Greenland). By comparing the all-sky im-ages recorded by the two monitors, the 630.0 nm peak emis-sion height was estimated to be in the range 350–400 km. This relatively high value is typical for the red-dominated
dayside cusp auroras, which are mainly induced by soft elec-tron precipitation (e.g., Lockwood et al., 1993, 2000). On the base of the peak emission height it is also possible to derive a rough estimation of the energy of the incoming electron, which, for 350–400 km, corresponds to about 100–200 eV (Millward et al., 1999). That energy range fit with the mea-surements of the DMPS satellites, along the ITACA2 field-of-view.
The five panels of Fig. 3 illustrate the evolution of the cusp aurora emission in the time interval 09:27–09:56 UT, while the IMF clock-angle rotated from 45◦to 90◦. Starting from 09:27 UT (top panel), the postnoon footprint (on the right) contracted, and a longitudinal bifurcation clearly de-veloped after 09:32 UT. At the beginning of the sequence, the separation between the centers (roughly matching the 630.0 nm emission maxima) of the two cusp spots, was roughly 1800 km, while it reduced to about 1200 km, at 09:56 UT (see Table 1), when the clock-angle reached 90◦
(IMF BY∼20 nT, and BZ∼0). We believe that these
cusp-like auroral spots are the signature of concurrent antiparallel (or, near-antiparallel) magnetic merging ongoing in differ-ent hemispheres, with the ionospheric footprint of the north-ern (local) cusp displaced in the postnoon, and the magneti-cally conjugated footprint of the southern cusp displaced in the prenoon, due to the effect of the positive IMF By
com-ponent. The observed prenoon cusp-like aurora signature implies that, for an IMF clock-angle ≥45◦, on the prenoon flank of the southern cusp there was the condition to have (near)antiparallel merging on magnetic field lines connected to the Northern Hemisphere (region I, Fig. 1). This condi-tion was probably favoured by: i) the presence of a positive IMF BX component (between 09:00–09:55 UT) that, for a
non-zero IMF BY, is expected to widen the antiparallel
merg-ing region near the southern cusp, while shrinkmerg-ing the corre-sponding one near the northern cusp (Luhmann et al., 1984); ii) the fact that, when the IMF BY and the dipole tilt angle
are both non zero, there is an equatorward displacement of the antiparallel merging region that is located in the summer hemisphere (presently, the southern one) (Park et al., 2006).
Trattner et al. (2005) performed a coordinated study, based on Cluster and SuperDARN data, of a double cusp structure (actually a longitudinal bifurcation) during IMF clock-angle of about 135◦, finding evidences that the two cusp spots were associated to magnetic merging patches located in different hemispheres, and separated by about 10 RE.
Recently, Sandholt and Farrugia (2003), and Sandholt et al. (2004), presented some events of longitudinally bifur-cated cusp aurora, during a steady south-east oriented in-terplanetary magnetic field (BY=3 nT, BZ=−3 nT, θ ∼135◦).
The main difference with the present event is that the longi-tudinal bifurcation we observed during northeast IMF, was likely the ionospheric signature of (near)antiparallel recon-nection equatorward the dawn flank of the southern cusp (re-gion I), and poleward the northern (local) cusp (re(re-gion IV), while in the cases reported during southeast IMF, such
Table 1. Bifurcated cusp position and separation.
Time West CUSP East CUSP Distance (UT) (MLAT, MLT) (MLAT, MLT) (km) 09:27 +72.8◦, 9.13 +74.5◦, 12.40 1775 09:32 +72.8◦, 9.21 +74.5◦, 12.48 1775 09:39 +73.6◦, 9.48 +73.1◦, 12.42 1610 09:43 +74.5◦, 9.63 +74.5◦, 12.66 1530 09:56 +75.3◦, 10.47 +73.6◦, 12.76 1210
bifurcation was produced by antiparallel reconnection tak-ing place equatorward both cusps (i.e., regions I and III). Sandholt and Farrugia (2003) reported also the presence of a 500 km gap (“gap aurora”) between the two cusp spots, with dim/no emission. That value is close to the smallest separa-tion we observed, about 550 km, when the IMF clock-angle was ∼90◦ (09:56 UT, lower panel of Fig. 3). Whereas, the maximum gap was nearly twice (≥1100 km) at 09:34 UT, and 09:43 UT, with an IMF clock-angle close to 45◦–50◦. The extension of the gap aurora was derived by taking, as reference, the isolevel corresponding to the mean intensity of the gap aurora (about twice the background intensity). The presence of dim red emission within the gap is likely con-nected to a steady, even if poorly efficient, component recon-nection in the subsolar region, as previously underlined by other authors (Sandholt et al., 2004). Furthermore, Fig. 3 clearly shows that such gap aurora is markedly shifted in the prenoon (by about 01:00 MLT), an aspect that is also in good agreement with the model proposed by Sandholt et al. (2004).
To inspect the conditions of the ionospheric convection during the progress of the event, we performed a preliminary survey of the SuperDARN online archive (http://superdarn. jhuapl.edu/). We detected the set up of sunward flow over the Svalbard, in connection with the cusp aurora emersion during northward IMF (≈09:10–09:30 UT), as expected for lobe re-connection. A similar association between ionospheric sun-ward flow and cusp aurora, under northsun-ward IMF, was re-cently reported by Milan et al. (2000). As the IMF clock-angle rotated from 45◦ to 90◦, the ionospheric convection divided into a sunward flux in the postnoon, close to the lo-cal cusp footprint, and an antisunward flux in the prenoon, in between the two spots of the bifurcated cusp aurora. Figure 4 illustrates the dayside part of the SuperDARN convection map between 09:32–09:34 UT superimposed to the ITACA2 composite image at 09:33 UT. The dashed red line sketches the location of the open/closed field line boundary, drawn by using the equatorward edge of the 630.0 nm emission as a proxy. The two numbered markers indicate the location of the magnetospheric boundaries recorded by the two DMSP transits closest to the period considered (see Table 2). From this figure it can be noted that the prenoon and postnoon
Figure 4. SuperDARN ionospheric convection map between 09:32-09:34 UT, superimposed to the combined ITACA² red-line images (projected at 400km height). The dashed red line sketch the open/closed field line boundary, drawn by taking the equatorward edge of the 630.0 nm emission as a proxy. The two numbered markers indicate the location of the magnetospheric boundaries recorded by the two DMSP transits closest to the period considered (see Table 2). The open/closed field line boundary stops near magnetic noon because the field lines are convecting sunward across the local cusp auroral spot, in the postnoon, due to the reconnection ongoing at the northern lobe (as traced by the sunward ionospheric flow). The prenoon and postnoon cusp auroras reside on separate convection cells, indicating that they are linked to different merging regions, likely located in the southern and northern hemisphere, respectively (as sketched in Fig. 1). The ionospheric flow moving antisunward across the “gap” aurora, about 1 hour before noon, could be the signature of component merging ongoing in the subsolar region (marked as II, in Fig. 1).
Fig. 4. SuperDARN ionospheric convection map between 09:32–09:34 UT, superimposed to the combined ITACA2red-line images (pro-jected at 400 km height). The dashed red line sketches the open/closed field line boundary, drawn by taking the equatorward edge of the 630.0 nm emission as a proxy. The two numbered markers indicate the location of the magnetospheric boundaries recorded by the two DMSP transits closest to the period considered (see Table 2). The open/closed field line boundary stops near magnetic noon because the field lines are convecting sunward across the local cusp auroral spot, in the postnoon, due to the reconnection ongoing at the northern lobe (as traced by the sunward ionospheric flow). The prenoon and postnoon cusp auroras reside on separate convection cells, indicating that they are linked to different merging regions, likely located in the Southern and Northern Hemisphere, respectively (as sketched in Fig. 1). The ionospheric flow moving antisunward across the “gap” aurora, about 1 h before noon, could be the signature of component merging ongoing in the subsolar region (marked as II, in Fig. 1).
Table 2. Magnetospheric boundaries from DMSP data (see Fig. 4).
Time DMSP boundary position boundary (UT) satellite (MLAT, MLT) type 09:12:08 F13 +71.2◦, 9.6 LLBL/cusp 09:40:32/24 F15 +72.7◦/73.0◦, BPS/LLBL/BPS
13.5/13.6
auroral spots clearly reside in different convection cells, in-dicating that they are likely connected to merging regions located in different hemispheres (southern and northern, re-spectively), as sketched in Fig. 1. Figure 4 shows also the antisunward ionospheric flow crossing the gap aurora in the prenoon. The development of that antisunward flow is very interesting since it supports the idea of the activation of com-ponent merging in the subsolar magnetopause in association with the gap aurora formation. This finding seems to favor the “mixed” reconnection theory with respect to the pure an-tiparallel reconnection view.
3.2 Longitudinal and latitudinal cusp bifurcation during IMF clock-angle ∼90◦
A net discontinuity in the solar wind occurred between 09:48–09:54 UT: both IMF BX and BZ components turned
to zero, and the ram pressure dropped from ∼24 to ∼7 nPa. During this phase, the cusp-like auroral spots faded pro-gressively, likely because the abrupt expansion of the mag-netopause drove a significant decrease the magnetic recon-nection rate. Afterward, the time interval 09:55–10:45 UT was characterized by a steady eastward IMF (BY∼18 nT, BZ∼0 nT), apart a small deviation between 10:10–10:18 UT
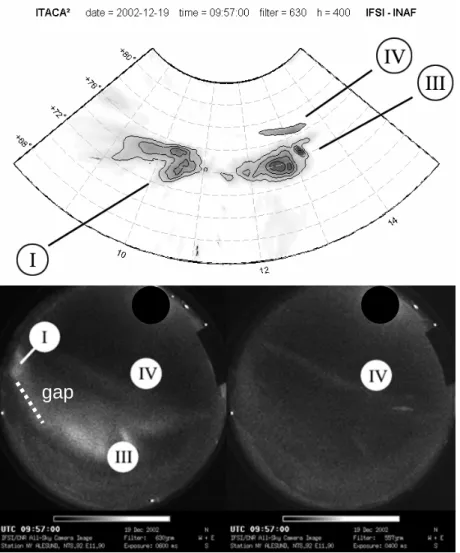
(see Fig. 2). Between 09:55–09:58 UT, the ITACA2monitors observed the abrupt and contemporaneous (within 30 s time resolution), activation of the two cusp patches located at 73◦– 74◦MLAT, shown in the bottom panel of Fig. 3 (09:56 UT). At the same time, a sequence of green rayed arcs started in the high-latitude postnoon, at about 77◦ MLAT, a feature that we identified as type 2 cusp auroras. This activity had been usually reported during northward directed IMF, and associated to the ionospheric signature of lobe reconnection (e.g.: Øieroset, 1997; Sandholt et al., 1996, 1998). Fig-ure 5, upper panel, illustrates the map projection of the day-side cusp aurora at 09:57 UT, during this activation phase. It was drawn by mapping the low-latitude 630.0 nm emission, at 400 km of altitude (as in Fig. 3), and then by adding the 630.0 nm emission associated to the high-latitude arc, pro-jected at 200 km of altitude. To calculate the last value, we mapped the 557.7 nm green line emission (Fig. 5, lower right panel) at a reference altitude of 110 km, and then adjusted the projection altitude of the associated 630.0 nm red line emis-sion (Fig. 5, lower left panel) until they overlapped. That
gap
Figure 5. Upper panel: MLAT versus MLT mapping projection of combined ITACA-DNB and ITACA-NAL
all-sky images (630.0nm). The estimated peak emission height is 350-400km for patches I and III, and 200km
for patch IV. Lower panel: ITACA-NAL red- (left) and green-line (right) all-sky images.
30
Fig. 5. Upper panel: MLAT versus MLT mapping projection of combined ITACA-DNB and ITACA-NAL all-sky images (630.0 nm). The
estimated peak emission height is 350–400 km for patches I and III, and 200 km for patch IV. Lower panel: ITACA-NAL red- (left) and green-line (right) all-sky images.
is, we used the simple assumption that the red and green emissions were vertically aligned. The estimated value of the peak emission height (∼200 km) implies electron energies in the range ≈0.6–1.0 keV (Millward et al., 1999), about five times higher than the one causing the red aurora emission at 400 km. The upper panel of Fig. 5 clearly shows the simulta-neous occurrence of the longitudinal and latitudinal bifurca-tions of the cusp aurora emission. The three aurora patches are labeled according to the magnetic merging regions illus-trated in Fig. 1:
– patch III (type 1 cusp aurora) corresponds to the
antipar-allel merging equatorward the northern cusp, shifted in the postnoon between 12:00–13:00 MLT;
– patch I (type 1 cusp aurora) is the magnetically
conju-gated signature of the antiparallel merging region equa-torward the southern cusp, shifted in the prenoon be-tween 10:00–11:00 MLT;
– patch IV (type 2 cusp aurora) marks the high-latitude
antiparallel merging region, which is due to magnetic reconnection ongoing at the northern lobe, centered at about 13:00 MLT.
The gap (dashed line, lower left panel) corresponds to the component merging region II, located in the prenoon subso-lar region (about 11:00–12:00 MLT). It is worth noting that now, with the IMF clock-angle turned to 90◦, the longitudi-nal cusp bifurcation appears to be associated to the merging regions I and III, as in the events reported by Sandholt and coworkers, during southeast IMF. The latitudinal separation between red aurora emission linked to regions III and IV, was about 270–280 km (∼3◦ MLAT) at its maximum extension (09:57 UT), that is, about 3–4 times smaller than the longitu-dinal separation between patches I and III (∼1000 km). The latitudinal bifurcation continued to be clearly observable all along the period 09:55–10:45 UT, until the IMF clock-angle remained close to 90◦.
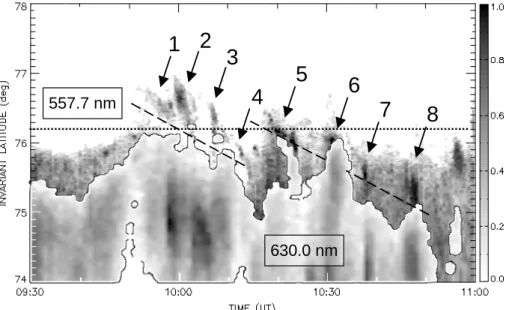
Figure 6. Magnetic latitude vs. time plot of the red and green aurora emission, derived from ITACA-NAL
data (intensities are in arbitrary scales). The original red and green keograms were processed to enhance the
latitudinal gap between the 630.0nm and 557.7nm emission (indicated by two dashed lines). A peak emission
height of 110km, and 400km, was used to calculate magnetic latitude of the green and red emission, respectively.
The sequence of high-latitude type 2 cusp aurora activations (marked by arrows) developed between 09:56-10:45
UT, when the IMF clock-angle was constantly close to 90°. These are expected to be the ionospheric footprints
of lobe reconnection events connected to the merging region IV (Fig. 1). The low-latitude type 1 cusp aurora
emission, traced by the 630.0nm emission, is the ionospheric signatures of the merging region III (Fig. 1),
equatorward the local (northern cusp). The lobe reconnection footprints show a strong dependence to the IMF
solar wind dynamic pressure (Fig. 2), that is: the latitude decreases as the pressure increase (about –0.35°
MLAT/1 nPa). A discontinuity in the solar wind dynamic pressure (see Fig. 2), caused the jump between
10:14-10:18 UT (arrows 4 and 5).
630.0 nm
557.7 nm
2
1
3
4
5
6
7
8
Fig. 6. Magnetic latitude vs. time plot of the red and green aurora emission, derived from ITACA-NAL data (intensities are in arbitrary
scales). The original red and green keograms were processed to enhance the latitudinal gap between the 630.0 nm and 557.7 nm emission (indicated by two dashed lines). A peak emission height of 110 km, and 400 km, was used to calculate magnetic latitude of the green and red emission, respectively. The sequence of high-latitude type 2 cusp aurora activations (marked by arrows) developed between 09:56– 10:45 UT, when the IMF clock-angle was constantly close to 90◦. These are expected to be the ionospheric footprints of lobe reconnection events connected to the merging region IV (Fig. 1). The low-latitude type 1 cusp aurora emission, traced by the 630.0 nm emission, is the ionospheric signatures of the merging region III (Fig. 1), equatorward the local (northern cusp). The lobe reconnection footprints show a strong dependence to the IMF solar wind dynamic pressure (Fig. 2), that is: the latitude decreases as the pressure increase (about
−0.35◦MLAT/1 nPa). A discontinuity in the solar wind dynamic pressure (see Fig. 2), caused the jump between 10:14–10:18 UT (arrows 4 and 5).
The time evolution of the latitudinal cusp bifurcation can be followed in the magnetic latitude versus time plot (keogram), shown in Fig. 6. That figure was obtained (ITACA-NAL data only) by merging the 630.0 nm keogram, which traces the low-latitude type 1 cusp aurora (labeled as III, in Fig. 5), with the 557.7 nm keogram, which marks the high-latitude type 2 cusp aurora (labeled as IV, in Fig. 5). The original keograms were processed to improve the vi-sualization of the latitudinal gap, roughly indicated by two dashed lines. Several intensifications of the high-latitude green arc(s) are identified by numbered arrows. By a com-parison between Figs. 6 and 2 (please, note that the x-axis range is different in the two figures), we can see how the so-lar wind conditions affect the high-latitude auroral displace-ment. The latitude of the green arcs was strongly linked to the increase of the solar wind dynamic pressure (being IMF
BX, BY and BZ nearly constant), by progressively drifting
from about 77.0◦to 75.0◦MLAT, between 09:55–10:09 UT (arrows 1–4), and from about 76.5◦to 75◦MLAT, between 10:19–10:45 UT (arrows 5–8). This means an average dis-placement of −0.35 MLAT/nPa, for the ionospheric foot-print of the lobe reconnection(s). The broad low-latitude red-dominated aurora (630.0 nm) showed a similar, but less extended, displacement. Between 10:09–10:18 UT, a discon-tinuity in the interplanetary medium, marked by a drop of the
solar wind dynamic pressure, and by the deep negative turn-ing of the IMF BXcomponent, caused the green arc to break
into patchy emission. Then, it reappeared few minutes after (10:19 UT), at higher latitudes, when the IMF recovered its previous orientation.
Figures 5 and 6 show that, during BY-dominated periods,
the extent of the ionospheric footprint of merging region IV is much smaller (particularly in latitude) than the one of merg-ing regions I, and III, and that its location is highly affected by variations in the solar wind dynamic pressure (Fig. 6). This indicates that, when θ ≈90◦, the antiparallel reconnec-tion at the lobe, poleward the cusp, can take places only within a narrow area at the magnetopause. Conversely, the peak energy of the injected electrons is higher (0.6–1.0 keV) for the lobe merging, than for the merging equatorward the cusp (0.1–0.2 keV), resulting in a higher 557.7/630.0 inten-sity ratio.
3.3 Dynamics of antiparallel merging regions, during hori-zontal IMF
During the whole period dominated by horizontal IMF (≈09:55–10:45 UT), the three dayside aurora signatures la-belled with I, III and IV (Fig. 5), exhibited recurrent ac-tivations followed by a net east-west (that is, tailward)
displacement, in response to the strong magnetic tension ex-erted by the highly positive IMF BY component. In
particu-lar, both the low-latitude type 1 cusp aurora patches, linked to the merging regions I and III, became very active displaying quasi-periodic emersion of new auroral forms: the patches coming from the merging region III (postnoon) overlapped with the ones originating from region I (prenoon), as both moved westward along a broad longitudinal belt (≈09:00– 14:00 MLT, and ≈73◦–75◦MLAT). This aspect of the au-roral activity was recently analyzed by the author, in corre-lation with the development of ground ULF Pc5 magnetic pulsations, shaped as a train of travelling convection vortices (TCVs) over the Greenland, close to the prenoon convec-tion reversal boundary (CRB) (Massetti, 2005). The prenoon cusp branch, the one connected to the merging region I (Southern Hemisphere), was found to be located at/near the nose of the CRB, likely the place where the TCVs originated. Clauer (2002) reported similar ULF Pc5 events (but, with longer periodicity), developing during BY-dominated
peri-ods, and concluded that they were likely driven by antipar-allel reconnection ongoing in the opposite hemisphere, and mapping at/near the CRB. There are several similarities be-tween the recurrent magnetic pulsations we found in concur-rence with the quasi-periodic aurora activations, and the TCV activity reported by Clauer (see Massetti, 2005), leading to the idea of a possible common origin of the two phenomena. In particular, both of them was observed to take place during a nearly horizontal IMF, a configuration that leads to the lon-gitudinal bifurcation of the cusp, due to the simultaneous an-tiparallel merging in different hemispheres. This fact would imply that the specific TCV activity described by Clauer and co-workers should usually take place together with a longi-tudinal splitting of the cusp, assuming that a horizontal IMF always leads to such magnetospheric feature. The difference of the length of periodicity between the present TCV activity (7–8 min) and the Clauer’s ones (15–35 min) could be possi-bly related to different reconnection regimes: “bursty”, in the case of short-period events, and “steady”, in the case of long-period events. Further studies are needed to say more about the relationship between this class of recurrent TCVs, the bifurcated cusp, and associated aurora activity, during IMF By-dominated periods.
In spite of the continuous brightening and superimposi-tion of new auroral forms, the longitudinally bifurcated cusp pattern persisted till about 10:45 UT, that is, all along the time period with an IMF clock-angle close to 90◦. The
re-current activations involved also the high-latitude (type 2) cusp aurora, which often appeared to be synchronized with the postnoon type 1 cusp aurora (see Fig. 6), with a period of about 5–10 min. The same feature was previously reported by Sandholt et al. (2001), during a BY-dominated period.
The dynamics of the cusp auroras observed during large IMF BY clearly indicates that the associated antiparallel
reconnections at the magnetopause are bursty and quasi-periodic. Since the observed ionospheric footprints map to
quite different magnetospheric regions (Fig. 1), we should conclude that the bursty and quasi-periodic merging regime can be triggered, at the same instant, over a wide fraction of the dayside magnetopause, when the appropriate conditions occur.
4 Comparison between ground- and space-based obser-vations
In the last few years, the dayside cusp aurora activity has been fruitfully analyzed thanks to the new FUV instruments on board the IMAGE Satellite (e.g. Frey et al., 2003). The good coverage of the present event allows for an interesting comparison between our ground-based twin monitors obser-vations and the FUV satellite data. Here, we briefly focus on three cusp aurora features discussed in the Sects. 3.1 and 3.2, namely: the cusp aurora during northward IMF (09:08– 09:27 UT), and the longitudinal and latitudinal cusp bifurca-tion signatures.
Thanks to the FUV data, it was clearly shown that, dur-ing a stable northward directed IMF, the cusp can be usu-ally identified as a bright spot near the magnetic noon, de-tached from the auroral oval and poleward of it (see, for ex-ample, Fig. 2 in Fuselier et al., 2003). That spot can be ob-served as long as the IMF is positive, supporting the idea of a continuous reconnection under stable IMF configuration. As the IMF rotates from northward to eastward (westward) the cusp spot gradually merges with the postnoon (prenoon) dayside auroral oval, and a longitudinal gap appears aside the cusp spot in the prenoon (postnoon) sector (see, for example, Fig. 5 in Fuselier et al., 2003). This sequence corresponds to the development of a longitudinal cusp bifurcation, pro-duced by the occurrence of antiparallel magnetic merging in different hemispheres.
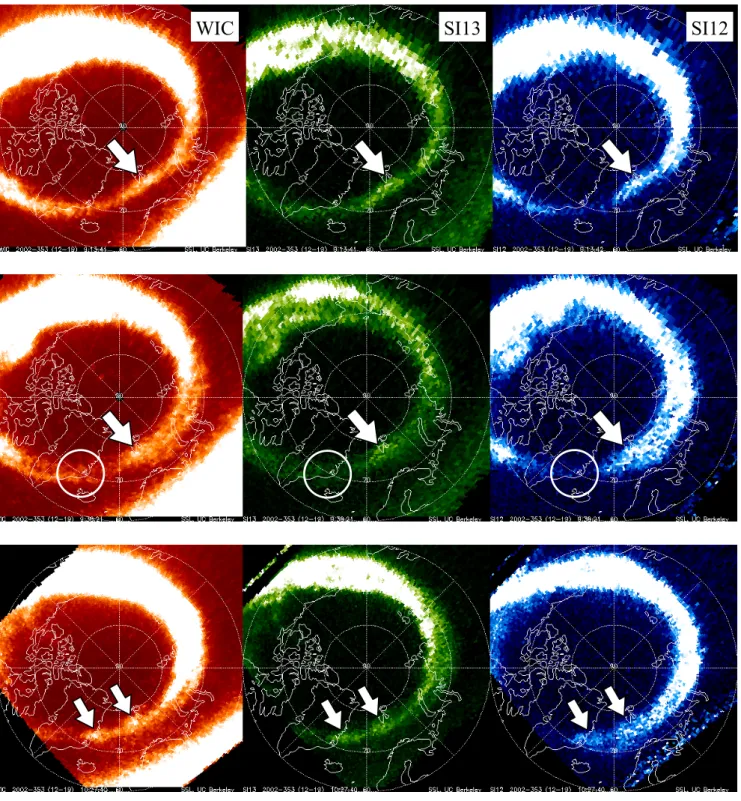
Figure 7, upper panel, shows the emersion of the cusp sig-nature some minutes after the IMF turned northward (near 09:00 UT), as described at the beginning of Sect. 3.1. The WIC, SI13, and SI12 images (from left to right, respectively) were recorded at 09:13 UT, when the clock-angle was about 15◦. In the present case, we can note that the cusp spot practically emerged within the dayside auroral oval, at about 74◦MLAT, not poleward of it. We believe that this is due to the high solar wind pressure (∼12–14 nPa, see Fig. 2), which is known to push the cusp region to lower latitudes (e.g.: Newell and Meng, 1992). As the IMF clock-angle ro-tated eastward, the cusp spot mixed with the auroral oval in the postnoon, and was no more detectable by SI12 (sensitive to proton precipitation), while it was still apparent in both WIC and SI13 images (Fig. 7, middle panel). The FUV im-ages in the middle panel were recorded at 09:38 UT (θ ∼40◦), during the longitudinal cusp bifurcation sequence illustrated in Fig. 3. By comparing Figs. 3 and 7 (middle panel), it can be noticed that there is no evidence in the IMAGE data of the prenoon cusp aurora signature (circle), and that,
WIC
SI13
SI12
Figure 7. Cusp aurora signatures as recorded by the WIC, SI13 and SI12 IMAGE-FUV instruments (from left
to right). Upper panel: emersion of the cusp footprint (arrow) few minutes after the sharp IMF northward turning
(09:14 UT, IMF clock-angle ~15°). Middle panel: cusp signature at 09:38 UT (clock-angle ~ 45°), during the
longitudinal bifurcation sequence shown in Fig. 3. The circle marks the position of the (missing) prenoon cusp
signature, which was observed from ground by ITACA² (Fig. 3). Lower panel: the bifurcated cusp pattern
(arrows) became apparent during one of the most intense quasi-periodic re-activations (10:28 UT), occurring
during the B
Y-dominated phase (09:55-10:45 UT).
Fig. 7. Cusp aurora signatures as recorded by the WIC, SI13 and SI12 IMAGE-FUV instruments (from left to right). Upper panel: emersion
of the cusp footprint (arrow) few minutes after the sharp IMF northward turning (09:14 UT, IMF clock-angle ∼15◦). Middle panel: cusp signature at 09:38 UT (clock-angle ∼45◦), during the longitudinal bifurcation sequence shown in Fig. 3. The circle marks the position of the (missing) prenoon cusp signature, which was observed from ground by ITACA2(Fig. 3). Lower panel: the bifurcated cusp pattern (arrows) became apparent during one of the most intense quasi-periodic re-activations (10:28 UT), occurring during the BY-dominated phase (09:55–10:45 UT).
consequently, the longitudinal gap in the auroral emission, westward the cusp spot (white arrow), is much greater than the one observed from ground. The longitudinally bifurcated cusp pattern, and the associated activity, was in general not detectable in the IMAGE-FUV dataset, apart from some of the most intense quasi-periodic re-activations, occurred dur-ing the BY-dominated period (09:55–10:45 UT). The lower
panel (Fig. 7) shows the FUV signatures of the prominent re-activation of both prenoon and postnoon cusp branches occurred at 10:27 UT. In the following 10–12 min, the two spots moved westward along the prenoon auroral oval, under the effect of the strong positive IMF BY component. Several
of such tailward moving auroral forms, generally referred as PMAFs (the likely ionospheric counterparts of FTEs), were observed by ITACA2during the BY-dominated period, and
found to be associated to a train of TCVs moving across the Greenland (Sect. 3.3).
Due to the small gap existing between of the ionospheric signatures of the latitudinal cusp bifurcation (Figs. 5 and 6), we could expect that such a feature is generally difficult to detect from space. In addition, the poleward part of such bifurcation was formed by a sequence of narrow rayed arcs (type 2 cusp aurora), drifting equatorward, which were ob-served to be quite dynamic. In spite of that, we found traces of such auroral activity in the WIC and SI13 images, between 09:58–10:10 UT, when the latitudinal separation was the greatest (see Fig. 6, arrows 1–3). Figure 8 reports the clearest signature we found in the WIC and SI13 images (10:07 UT). The arrow indicates the narrow and faint FUV emission cor-responding to the high-latitude auroral arc, which we believe represents the ionospheric footprint of antiparallel merging region poleward the cusp, on the northern geomagnetic lobe (region IV, in Fig. 1).
5 Conclusions
We presented and analyzed a complex dayside auroral event, which took place near the winter solstice 2002, and was char-acterised by simultaneous longitudinal and latitudinal cusp bifurcations. It was recorded by ITACA2, a ground-based twin auroral monitors system, located in the high-latitude Greenland-Svalbard sector, and by the FUV instruments on board the IMAGE satellite. The event was discussed in the frame of the existing magnetic reconnection theories, using the dayside auroral activity as a proxy of the reconnection topology during IMF BY-dominated period. We found that
the observed auroral signatures seem to agree with a “mixed” reconnection topology, constituted by a sort of superimposi-tion of antiparallel reconnecsuperimposi-tion at high latitudes and com-ponent merging in the subsolar regions (Moore et al., 2002; Sandholt et al., 2004).
The event developed during a smooth transition from northward to eastward IMF, between 09:00–09:55 UT, and then continued during a nearly steady eastward IMF, till
WIC
SI13
Figure 8. WIC and SI13 IMAGE-FUV images recorded at 10:07 UT. The arrows indicate one of the high-latitude auroral arcs (type 2 cusp aurora) that form the poleward part of the so-called latitudinal cusp bifurcation (see Figs. 5 and 6), occurred during horizontal IMF (clock-angle ~ 90°). This auroral signature is likely the ionospheric footprint of antiparallel magnetic merging at the northern geomagnetic lobe.
33
Fig. 8. WIC and SI13 IMAGE-FUV images recorded at 10:07 UT.
The arrows indicate one of the high-latitude auroral arcs (type 2 cusp aurora) that form the poleward part of the so-called latitudi-nal cusp bifurcation (see Figs. 5 and 6), occurred during horizontal IMF (clock-angle ∼90◦). This auroral signature is likely the iono-spheric footprint of antiparallel magnetic merging at the northern geomagnetic lobe.
about 10:45 UT. The solar wind pressure was quite high for the whole period, particularly during the first part of the event, ranging between about 24 to 7 nPa. The key features of the event are:
i) the longitudinal cusp aurora bifurcation during north-east IMF (45◦≤θ ≤90◦),
ii) the simultaneous longitudinal and latitudinal cusp rora bifurcations, followed by quasi-periodic cusp au-rora activations, during eastward IMF (θ '90◦). The longitudinal cusp bifurcation is a peculiar magnetospheric-ionospheric configuration that was re-ported to occur during southeast/southwest IMF, clock-angle
∼135◦ (e.g., Sandholt et al., 2004; Trattner et al., 2005), and found to be the signature of antiparallel magnetic recon-nection taking place in different hemispheres, equatorward both the northern and southern cusp, with the corresponding ionospheric footprints dislocated away from magnetic noon due to the non-zero IMF BY component. The event here
illustrated shows that, at least during specific circumstances, the longitudinal splitting of the cusp can also take place during a northeast IMF. On the basis of the available data, we believe that this phenomenon can be explained in terms of (near)antiparallel merging occurring at the same time, poleward the northern cusp (lobe reconnection), and
equatorward the dawn flank of the southern cusp. For a non-zero IMF BY component, the latter condition should be
favored by the presence of a positive IMF BX component,
which is expected to widen the antiparallel merging region in the Southern Hemisphere, and by the negative dipole tilt during the winter solstice, which is expected to cause an equatorward shift of the same merging region.
The ITACA2 all-sky images show the simultaneous oc-currence of both type 1 and type 2 cusp auroras, in three separate areas of the high-latitude ionosphere, mapping to three very distinct regions of the dayside magnetopause: two of them equatorward the northern (local) and southern cusp, and the other one poleward the local cusp, at the northern geomagnetic lobe. These cusp auroral signatures match the ionospheric footprint pattern that can be drawn by assuming antiparallel reconnection(s) ongoing at high-latitudes, during IMF BY dominated periods (e.g.: Moore et al., 2002;
Sand-holt et al., 2004). Such simultaneous occurrence of both lon-gitudinal and latitudinal cusp aurora bifurcations was never reported before, to our knowledge.
Other relevant aspects of the event are the following:
– the simultaneous brightening of the prenoon and
post-noon auroral patches of the longitudinally bifurcated cusp (09:55–09:58 UT), within 30 s time resolution. This evidence was also reported by Sandholt and Farru-gia (2003) (1 min resolution), and it implies that mag-netic merging events, taking place in different hemi-spheres, can happen virtually at the same time. When generated by the variability of the interplanetary condi-tion, a time lag between the ionospheric signatures of reconnections in different hemispheres arises from both the dipole tilt angle and the IMF BX(e.g., Maynard et
al., 2002). In the present case, we have that the IMF
BXcomponent was close to zero during the
simultane-ous activation of the bifurcated cusp, implying no delay associated to the inclination of the IMF plane. As a con-sequence, the potential lag due to the tilt of the Earth’s magnetic dipole, which was close to its maximum (win-ter solstice), must be smaller than 30 s (the ITACA2time resolution). A possibility could be that the simultane-ous auroral activations were triggered by the large-scale reorganization of the dayside magnetosphere occurred after the drop of the solar wind pressure (24→7 nPa, between 09:48–09:54 UT), which was accompanied by an IMF clock-angle rotation to 90◦;
– the existence of a dim red emission in between the gap
separating the longitudinal bifurcated cusp. That feature should be associated with a steady, low-efficient, com-ponent reconnection ongoing on the subsolar region, as depicted by the “mixed” merging model (Sandholt et al., 2004). This idea is supported by the evidence we found of an antisunward ionospheric flow through the gap
au-with previous observations and au-with the model proposed by Sandholt et al. (2004);
– thanks to the wide field-of-view of the ITACA2 twin monitors, it was possible to make a large-scale compari-son with the IMAGE-FUV data. The comparicompari-son shows relevant differences between ground- and space-based observations of the same cusp aurora event, stressing the importance to perform coordinated studies involv-ing both kinds of dataset. Finally, we found clear signa-tures of the latitudinal cusp splitting, and of the quasi-periodic aurora activations that followed the longitudi-nal bifurcation of the cusp, which could be the first re-port of such auroral activity detected in the IMAGE-FUV data.
Acknowledgements. The NASA Goddard Space Flight Center, L. A. Frank (CPI), and S. Kokubun (MGF), are acknowledged for the GEOTAIL satellite data. The FUV team at UC Berkeley is ac-knowledged for providing the IMAGE-FUV. The SuperDARN team is acknowledged for providing online access to several data prod-ucts. The author thanks E. Amata and I. Coco for the SuperDARN ionospheric convection map reported in Fig. 4. POLARNET (IIA-CNR) is acknowledged for logistical support in running the ITACA-NAL station. PNRA is acknowledged for founding the ITACA2 sta-tions (PEA2002–2003, PEA2004–2006). The author acknowledges the reviewers for valuable comments and suggestions.
Topical Editor I. A. Daglis thanks H. Frey and K. Kauristie for their help in evaluating this paper.
References
Clauer, C. R.: Ionospheric observations of waves at the inner edge of the low latitude boundary layer, in: Earth’s Low Latitude Boundary Layer, edited by: Newell, P. T. and Onsager, T., Geo-phys. Monogr., 133, 297–310, 2002.
Cowley, S. W. H.: Comments on the merging of non-parallel mag-netic fields, J. Geophys. Res., 81, 3455–3458, 1976.
Cowley, S. W. H. and Owen, C. J.: A simple illustrative model of open flux tube motion over the dayside magnetosphere, Planet. Space Sci., 37, 1461–1475, 1989.
Crooker, N. U.: Dayside merging and cusp geometry, J. Geophys. Res., 84, 951–959, 1979.
Frey, H. U., Mende, S. B., Immel, T. J., G´erard, J.-C., Hubert, B., Habraken, S., Spann, J., Gladstone, G. R., Bisikalo, D. V., and Shematovich, V. I.: Summary of quantitative interpretation of IMAGE far ultraviolet auroral data, Space Sci. Rev., 109, 255– 283. 2003.
Fuselier, S. A., Mende, S. B., Moore, T. E., Frey, H. U., Petrinec, S. M., Claflin, E. S., and Collier, M. R.: Cusp dynamics and ionospheric outflow, Space Sci. Rev., 109, 285–312, 2003. Gosling, J. T., Asbridge, J. R., Bame, S. J., Feldman, W. C.,
Paschmann, G., Sckopke, N., and Russell, C. T.: Evidence for quasi stationary reconnection at the dayside magnetopause, J.
the origin of asymmetric polar cap convection, J. Geophys. Res., 95, 8073–8084, 1990.
Lockwood M., Carlson Jr., H. C., and Sandholt, P. E.: Implications of the altitude of transient 630-nm dayside auroral emission, J. Geophys. Res., 98, 15 571–15 588, doi:10.1029/93JA00811, 1993.
Lockwood M., McCrea, I. W., Milan, S. E., Moen, J., Cerisier, J. C., and Thorolfsson, A.: Plasma structure within poleward-moving cusp/cleft auroral transient: EISCAT Svalbard radar observations and an explanation in terms of large local time extent of events, Ann. Geophys., 18, 1027–1042, 2000,
http://www.ann-geophys.net/18/1027/2000/.
Luhmann, J. G., Walker, R. J., Russell, C. T., Crooker, N. U., Spre-iter, J. R., and Stahara, S. S.: Patterns of potential magnetic field merging sites on the dayside magnetopause, J. Geophys. Res., 89, 1739–1742, 1984.
Massetti, S.: Dayside magnetosphere-ionosphere coupling during IMF clock-angle ∼90◦: longitudinal cusp bifurcation, quasi-periodic cusp-like auroras and traveling convection vortices, J. Geophys. Res., 110, A07304, doi:10.1029/2004JA010965, 2005. Maynard, N. C., Bruke, W. J., Moen, J., Sandholt, P. E., Lester, M., Ober, D. M., Weimer, D. R., and White, W. W.: Bifurcation of the cusp: Implications for understanding boundary layers, in: Earth’s Low Latitude Boundary Layer, edited by: Newell, P. T. and Onsager, T., Geophys. Monogr., 133, 319–328, 2002. McCrea, I. W., Lockwood, M., Moen, J., Pitout, F., Eglitis, P.,
Ayl-ward, A. D., Cerisier, J.-C., Thorlofssen, A., Milan, S. E.: ESR and EISCAT observations of the response of the cusp and cleft to IMF orientation changes, Ann. Geophys., 18, 1009–1026, 2000, http://www.ann-geophys.net/18/1009/2000/.
Milan, S. E., Lester, M., Cowley, S. W. H., and Brittnacher, M.: Dayside convection and auroral morphology during an interval of northward interplanetary field, Ann. Geophys., 18, 436–444, 2000,
http://www.ann-geophys.net/18/436/2000/.
Millward, G. H., Moffett, R. J., Balmforth, H. F., and Rodger, A. S.: Modeling the ionospheric effects of ion and electron pre-cipitation in the cusp, J. Geophys. Res., 104, 24 603–24 612, doi:10.1029/1999JA900249, 1999.
Moore, T. E., Fok, M.-C., and Chandler, M. O.: The day-side reconnection X line, J. Geophys. Res., 107, 1332, doi:10.1029/2002JA009381, 2002.
Nˇemeˇcek, Z., ˇSafr´ankov´a, J., Pˇrech, L., ˇSimunek, J., Sauvaud, J.-A., Fedorov, A., Stenuit, H., Fuselier, S. A., Savin, S., Zelenyi, L., and Berchem, J.: Structure of the outer cusp and sources of the cusp precipitation during intervals of a horizontal IMF, J. Geo-phys. Res., 108, 1420, doi:10.1029/2003JA009916, 2003.
Newell, P. T. and Meng, C.-I.: Mapping the dayside ionosphere to the magnetosphere according to the particle precipitation charac-teristics, Geophys. Res. Lett., 19, 609–612, 1992.
Øieroset, M., Sandholt, P. E., Denig, W. F., and Cowley, S. W. H.: Northward interplanetary magnetic field cusp aurora and high-latitude magnetopause reconnection, J. Geophys. Res., 102, 11 349–11 362, doi:10.1029/97JA00559, 1997.
Park, K. S., Ogino, T., and Walker, R. J.: On the im-portance of antiparallel reconnection when the dipole tilt and IMF BY are nonzero, J. Geophys. Res., 111, A05202, doi:10.1029/2004JA010972, 2006.
Phan, T.-D. and Paschmann, G.: Low-latitude dayside magne-topause and boundary layer for high magnetic shear 1. Structure and motion, J. Geophys. Res., 101, 7801–7816, 1996.
Sandholt, P. E., Farrugia, C. J., Øieroset, M., Stauning, P., and Cow-ley, S. W. H.: Auroral signature of lobe reconnection, Geophys. Res. Lett., 23, 1725–1728, doi:10.1029/96GL01846, 1996. Sandholt, P. E., Farrugia, C. J., Moen, J., Noraberg, Ø., Lybekk,
B., Sten, T., and Hansen, T.: A classification of dayside au-roral forms and activities as a function of interplanetary mag-netic field orientation, J. Geophys. Res., 103, 23 325–23 346, doi:10.1029/98JA02156, 1998.
Sandholt, P. E., Farrugia, C. J., Cowley, S. W. H., Lester, M., Denig, W. F., Cerisier, J. -C., Milan, S. E., Moen, J., Trond-sen, E., and Lybekk, B.: Dynamic cusp aurora and asso-ciated pulsed reverse convection during northward interplan-etary magnetic field, J. Geophys. Res., 105, 12 869–12 894, doi:10.1029/2000JA900025, 2000.
Sandholt, P. E., Farrugia, C. J., Cowley, S. W. H., and Lester, M.: Dayside auroral bifurcation sequence during BY-dominated
interplanetary magnetic field: Relationship with merging and lobe convection cells, J. Geophys. Res., 106, 15 429–15 444, doi:10.1029/2000JA900161, 2001.
Sandholt, P. E. and Farrugia, C. J.: Does the aurora provide evidence for the occurrence of antiparallel magnetopause reconnection?, J. Geophys. Res., 108, 1466, doi:10.1029/2003JA010066, 2003. Sandholt, P. E., Farrugia, C. J., and Denig, W. F.: Detailed
day-side auroral morphology as a function of local time for south-east IMF orientation: implications for solar wind-magnetosphere coupling, Ann. Geophys., 22, 3537–3560, 2004,
http://www.ann-geophys.net/22/3537/2004/.
Trattner, K. J., Fuselier, S. A., Petrinec, S. M., Yeoman, T. K., Mouikis, C., Kucharek, H., and Reme, H.: Reconnection sites of spatial cusp structures, J. Geophys. Res., 110, A04207, doi:10.1029/204JA010722, 2005.