HAL Id: hal-00856042
https://hal.inria.fr/hal-00856042
Submitted on 30 Aug 2013
HAL is a multi-disciplinary open access
archive for the deposit and dissemination of
sci-entific research documents, whether they are
pub-lished or not. The documents may come from
teaching and research institutions in France or
abroad, or from public or private research centers.
L’archive ouverte pluridisciplinaire HAL, est
destinée au dépôt et à la diffusion de documents
scientifiques de niveau recherche, publiés ou non,
émanant des établissements d’enseignement et de
recherche français ou étrangers, des laboratoires
publics ou privés.
A new framework for metabolic modeling under
non-balanced growth. Application to carbon metabolism
of unicellular microalgae
Caroline Baroukh, Rafael Munoz Tamayo, Jean-Philippe Steyer, Olivier
Bernard
To cite this version:
Caroline Baroukh, Rafael Munoz Tamayo, Jean-Philippe Steyer, Olivier Bernard. A new framework
for metabolic modeling under non-balanced growth. Application to carbon metabolism of unicellular
microalgae. Computer Applied to Biotechnology, Dec 2013, Mumbai, India. �hal-00856042�
Caroline Baroukh*,**, Rafael Muñoz-Tamayo**, Jean-Philippe Steyer*. Olivier Bernard**,***
* INRA UR050, Laboratoire des biotechnologies de l’environnement, avenue des étangs, 11100 Narbonne, FRANCE (e-mail: {caroline.baroukh ;jean-philippe.steyer}@ supagro.inra.fr).
**INRIA-BIOCORE, 2004 route des lucioles, 06250 Sophia-Antipolis, FRANCE (e-mail:{rafael.munoz_tamayo ;olivier.bernard}@inria.fr)
***LOV-UPMC-CNRS, UMR 7093, Station Zoologique, B.P. 28, 06234 Villefranche-sur-mer, France
Abstract: Macroscopic and metabolic models are ubiquitous tools for bioprocess modeling and understanding. While these two modeling approaches bring answers to different objectives, a remaining challenging question is how to couple macroscopic and intracellular models to enlarge the prediction capabilities of the model while keeping a model structure with low complexity level? In this paper, we provide conceptual guidelines to address this question. We propose a new modeling framework that manages non-balanced growth condition and hence accumulation of intracellular metabolites. The first stage consists in determining metabolic sub-networks, which are assumed to satisfy balanced growth condition. Then, the remaining metabolites interconnecting the sub-networks can dynamically accumulate or be reused. The basis of our approach is illustrated for the carbon metabolic network of unicellular microalgae.
Keywords: balanced-growth, dynamic modeling, lipids, metabolic modeling, microalgae
1. INTRODUCTION
Classical modeling approaches of biological systems can be sorted into two categories: macroscopic modeling and intracellular modeling. Macroscopic models rely on macroscopic reactions where microorganisms act as catalyzers (Bastin & Dochain 1990). They usually predict well the macroscopic scale of bioprocesses but do not take into account intracellular mechanisms and thus can hardly be used for optimization of intracellular molecules of interest. On the other hand, intracellular modeling accurately describes mechanisms occurring inside the cell: reactions between metabolites catalyzed by enzymes, translation and transcription of genes. These models are based on the knowledge of the metabolic and genomic networks. They allow a better understanding of the cellular mechanisms and seem more appropriate to describe and optimize bioprocesses implying intracellular molecules. Unfortunately, the use of intracellular models for time varying experiments is hampered by the lack of experimental data required to define and calibrate the kinetic reactions rates of the biochemical reactions (Heijnen & Verheijen 2013).
To overcome these hurdles, a commonly used hypothesis is the balanced-growth hypothesis, also called the Quasi-Steady-State Approximation (QSSA). Internal metabolites are assumed not to accumulate inside the microorganisms. Every substrate uptake leads to microbial growth and potential excreted products. Thanks to this hypothesis, intracellular models are simplified and thus depend only on
the stoichiometry of the network, the reaction reversibility and the uptake rate of the substrates.
Most of the metabolic modeling and analysis frameworks rely on the balanced-growth hypothesis: Flux Balance Analysis (FBA) (Orth et al. 2010), Dynamical Flux Balance Analysis (DFBA) (Mahadevan et al. 2002), Elementary Flux Modes (EFM) (Schuster et al. 1999), Flux Coupling Analysis (FCA) (Burgard et al. 2004), Macroscopic Bioreaction Models (MBM) (Provost et al. 2006), Hybrid Cybernetic Models (HCM) (Song et al. 2009) and Lumped Hybrid Cybernetic Models (L-HCM) (Song et al. 2010). Overall, these models predict well biomass growth and excreted products synthesis (Mahadevan et al. 2002; Song et al. 2009; Edwards et al. 2001; Zamorano et al. 2013) as long as the balanced-growth hypothesis is verified (Song et al. 2009), which is not always the case, especially for microalgae submitted to permanent light fluctuations (Bernard 2011). In this paper, we study the metabolism of microalgae. These microorganisms are of great industrial interest. For instance, microalgae can store lipids, which can be transformed into third generation biofuels, providing a promising solution for renewable energies (Chisti 2007).
Autotrophic microalgae, as photosynthetic microorganisms, are far from the condition of balanced-growth in day/light cycles. Indeed, because of their phototrophic metabolism and the synchronization of their circadian cycle on the daily light, microalgae are forced to store energy and carbon during the day so as to continue their growth and cell maintenance during the night (Lacour et al. 2012). Therefore, intermediate metabolites such as starch, carbohydrates and lipids
accumulate during the day and are remobilized during the night. The QSSA assumption is not valid for these metabolites. Hence, to describe carbon and energy storage/consumption in microalgae, a new modeling framework relaxing the hypothesis of balanced-growth is required.
Ideally, the new methodology should represent accurately dynamics of accumulation and consumption of the stored metabolites along with substrate consumption and excreted product formation. In addition, simplicity should be favored if the model is intended to be used in a model based control framework, in order to achieve maximum yields (here microalgae’s lipids).
The aim of the present work is to provide the conceptual basis of a new modeling framework to model intracellular processes where accumulation of certain metabolites is present. Carbon metabolic network of unicellular microalgae is chosen to illustrate the approach on a realistic example.
2. PRINCIPLE OF THE APPROACH
Let’s consider a batch bioprocess implying a microorganism growing in a perfectly mixed stirred-tank reactor. The microbial specie consumes substrates S to grow biomass B and produces excreted products P. The metabolic network of the microorganism is represented by the stoichiometric matrix containing metabolites and reactions.
Thanks to a mass-balance, the bioprocess can be represented by the ODE system:
( )
( )
(1)
where represents the metabolites concentration vector composed of the biomass , substrates , intracellular metabolites and products . The kinetics represent the reactions rates of the reactions of the metabolic network. The matrices , , and are the stoichiometric matrices of the metabolic network for the substrate, the products, the internal metabolites and the biomass with dimensions , , and . They correspond to the lines of the substrates, products, internal metabolites and biomass of the stoichiometric matrix of the metabolic network . Unlike macroscopic modeling, they rely on the knowledge of the underlying metabolic network and don’t need to be determined experimentally. Only metabolic knowledge is required.
The QSSA implies that internal metabolites do not accumulate ( .
Here, instead, we assume that QSSA is applicable only to groups of metabolic reactions that we call sub-networks (SN). The remaining metabolites ( ) interconnecting the sub-networks are not under the quasi-steady state constraint. They
are allowed to accumulate and thus behave dynamically, which give the dynamics of the whole network.
This assumption relies on i) the presence of metabolic pathways corresponding to precise metabolic functions ii) the presence of group of reactions regulated together iii) the presence of substrate channeling (Ovádi & Saks 2004) iv) the presence of different compartments in a cell (e.g. mitochondrion). Groups of reactions are thus determined taking into account these intracellular mechanisms. It is to be noted that some intracellular reactions can belong to several group of reactions because they can take place in several locations in the cell. Mathematically, this is represented by redundant columns in the stoichiometric matrix . The remaining metabolites ( ) interconnecting the sub-networks, formed using these rules, are usually either situated at a branching point between several pathways or are end-products of metabolic pathways (e.g.: macromolecules). Hence, the stoichiometric matrix can be decomposed as sub-matrices formed of grouped reactions:
(2) where ( ∑ ) represents the sub-network composed of i) incoming and outgoing metabolites
and allowed to accumulate, ii) intermediate
metabolites at quasi-steady state. and are either
substrates , products , biomass B or intracellular metabolites A allowed to accumulate.
Each sub-network is assumed at quasi-steady-state:
(3) Under these assumptions and using elementary mode analysis (Schuster et al. 1999; Klamt & Stelling 2003), each sub-network can be reduced to a set of macroscopic reactions:
→
(4)
By grouping all the sub-networks together, we obtain:
( ) ( ) (5)
where represents a term by term multiplication.
Metabolites are assumed not to accumulate. If
the metabolites do not accumulate for any sub-network , we have:
(6)
Hence, we obtain a reduced dynamic model defined by the metabolites vector ( ) and the matrix
( ) ( ) (7)
System (7) is a simplified version of (1) of much lower dimension. In addition, accumulation of some internal metabolites is allowed. Only kinetics of the resulting macroscopic reactions need to be determined. For that, several strategies can be applied, from optimization to cybernetic kinetics (Ramkrishna & Song 2012).
Particular attention has to be drawn to the definition of biomass , which is no longer the conventional one. Biomass is usually represented as an average composition of macromolecules present in the cell. With QSSA, any chemical element of substrate ends up in either biomass or excreted products . In the present approach, accumulation of internal metabolites is allowed. Hence, not all chemical elements from substrate ends up in biomass or products . They can also be present in . Total biomass (noted ) can then only be determined thanks to a mass-balance, using the following equations:
∑ (8) where correspond to a chemical element ( ), , and corresponds respectively to the number of chemical element in total biomass , metabolites and biomass .
Some macromolecules composing biomass can thus be metabolites allowed to accumulate . We assumed that only macromolecules not catalyzing intracellular reactions and not necessary for functional growth (proteins, DNA, …) will accumulate. Therefore, biomass actually corresponds to metabolites necessary for functional growth. We rename it functional biomass. The term or in (7) is still meaningful, since biomass catalyzes growth as in (1).
In summary, in order to transform a large system of type (1) into a much smaller system (7), we propose the following methodology, which is decomposed into a 4-step process:
i) Find in the literature the metabolic network of the microorganism under study.
ii) Decompose the metabolic network into sub-networks assumed to follow the QSSA.
iii) Reduce each sub-network to a set of macroscopic reactions using elementary modes analysis.
iv) Define simple kinetics for macroscopic reactions obtained.
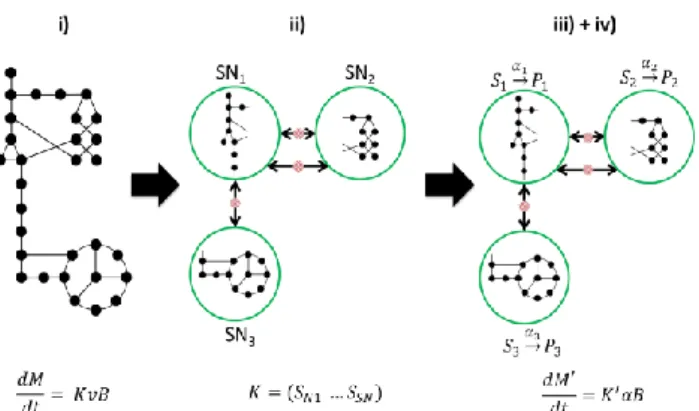
Figure 1 summarizes the principles of our approach.
For sake of pedagogy, in the next section, we illustrate the application of our approach on the carbon metabolism of unicellular microalgae.
3. RESULTS AND DISCUSSION
3.1 Metabolic Network
C. reinhardtii is the model organism of unicellular
microalgae, which can grow heterotrophically on acetate and autotrophically on light and carbon dioxide thanks to photosynthesis (Boyle & Morgan 2009). It is one of the few microalgae sequenced so far (Merchant et al. 2011), which allowed to build genome-sequencing metabolic networks (Boyle & Morgan 2009; Manichaikul et al. 2009; Kliphuis et al. 2011; Chang et al. 2011). In this study, only the autotrophic behavior of C. reinhardtii will be considered, as lipids obtained with light and carbon dioxide are more interesting economically and sustainably for potential biofuels applications (Georgianna & Mayfield 2012).
The metabolic network studied here was adapted from (Kliphuis et al. 2011). Only the central carbon metabolic network was kept, composed of light and dark steps of photosynthesis taking place in the chloroplast, transport reaction from chloroplast to cytosol, glycolysis, citric acid cycle, glycerol synthesis, oxidative phosphorylation, lipids synthesis and carbohydrates synthesis. The reduced network is composed of 65 internal metabolites and 60 reactions including 6 exchange reactions with the environment and 1 internal exchange reaction (between the chloroplast and the cytosol). List of reactions are available in Table 1 and in the supplementary file of (Kliphuis et al. 2011).
3.2 Formation and Reduction of each sub-network
Metabolic reactions were grouped by metabolic functions, taking into account compartments and metabolic pathways. Five sub-networks were obtained (Fig 2) corresponding to i) photosynthesis, ii) upper part of glycolysis and carbohydrate synthesis iii) lower part of glycolysis, iv) lipids synthesis, v) citric acid cycle and oxidative phosphorylation. Then, each sub-network was reduced to macroscopic reactions thanks to elementary flux mode analysis. To compute elementary flux modes (EFMs) the software efmtool was used (Terzer & Stelling 2008). For all five sub-networks, the EFM could be computed easily, and their number was low (less than 4). It should be noted that an EFM analysis of the full network leads to more than 500 modes (Rügen et al. 2012).
Fig 1. Modeling approach.
The complete network is decomposed into sub-networks (SN) assumed at quasi-steady state and these are reduced to a set of macroscopic reactions (𝑆 𝑃 . Linking metabolites interconnecting the SN are allowed to 𝛼 accumulate (red dashed circles). In the full model described in step i), 𝐾𝜖ℝ𝑛𝑚 𝑛𝑟, 𝑣 ℝ𝑛𝑟, while for the resulting model provided by our
approach, 𝐾 ℝ𝑛𝑚 𝑛𝐸and 𝛼 ℝ𝑛𝐸, such that 𝑛
In the following sections, the formation and reduction of each sub-network is developed. The results are summarized in Table 1.
3.3.1 Photosynthesis
Photosynthesis allows phototrophic organisms to generate cell energy and incorporate carbon autotrophically. The process takes place in the chloroplast and is decomposed into two steps commonly called the light and dark steps. The light step consists in the generation of cell energy (ATP, NADPH) from water and photons, producing oxygen (R1). Thanks to the energy of the light step, the dark step incorporates carbon dioxide through the Calvin cycle generating one sugar (3-phosphoglycerate written G3P). Then the metabolic network suggests that G3P is transformed in dihydroxyacetone phosphate (DHAP) and transported to the cytosol of the cell (R13).
The elementary flux analysis yields only one EFM (Table 1). The stoichiometry of the macroscopic reaction obtained is in agreement with the literature: a quota of 8 photons are needed per carbon incorporated (Williams & Laurens 2010).
3.3.2 Upper glycolysis and carbohydrates synthesis
Carbohydrates (CARB) are complex sugars stored in the cell. They are formed from simple sugars (here DHAP) by reverse glycolysis. Elementary mode analysis on upper glycolysis coupled with carbohydrates synthesis results in 4 macroscopic reactions (Table 1).
Reaction (MR2) corresponds to a futile cycle: energy (ATP) is dissipated without creation of any metabolic product. This occurs when two metabolic pathways run simultaneously in
opposite directions and have no overall effect other than to dissipate energy in the form of heat. Reaction (MR3) corresponds to carbohydrates synthesis whereas reaction (MR4) corresponds to its consumption. Stoichiometry agrees with literature, where 1 ATP needs to be invested to transform complex sugars (CARB) into simpler ones (DHAP) before getting 2 ATP back with lower glycolysis (Perry et al. 2004). Finally, reaction (MR5) corresponds to combined reactions (MR2) and (MR3), and thus can be deleted.
3.3.3 Lower glycolysis
Lower part of glycolysis is a cascading set of reactions which generates the key metabolite pyruvate (PYR) and energy cofactors (ATP, NADH) from DHAP. One macroscopic reaction was obtained by Elementary Flux Analysis (Table 1). Stoichiometry is in accordance with literature: after investment of one ATP in the upper part of glycolysis, 2 ATP are returned with one pyruvate (Perry et al. 2004).
3.3.4 Lipids synthesis
Lipids include a broad group of different macromolecules present in a cell. They contain at least one hydrophobic part and are constituted of long carbon chains linked to a sugar by an ether bound. In microalgae, only Triacylglycerols (TAGs) can be transformed into biofuels (Chisti 2007). Unfortunately, lipid metabolism of microalgae is poorly known because it is insufficiently studied and different from bacteria and plants (Liu & Benning 2012). In the present network, lipids are represented by phosphatidic acids (PAs), precursors of many lipids including phospholipids for the membrane and TAGs.
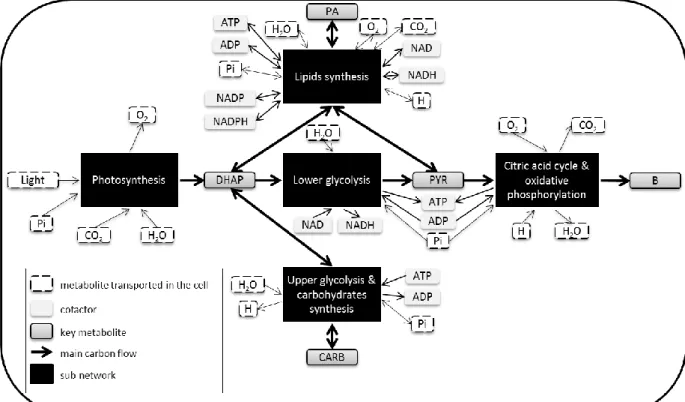
Fig 2: Central carbon network of Chlamydomonas reinhardtii decomposed into 5 sub-networks.
The network was adapted from (Kliphuis et al. 2011). List of reactions for each sub-network is available in Table 1 and in the supplementary file of (Kliphuis et al. 2011).
Table 1: Decomposition and reduction of the central carbon metabolic network of C. reinhardtii. Each sub-network was decomposed into a set of macroscopic reactions with elementary flux analysis. + deleted reaction because redundant with the others. I, light intensity.
Sub-network Reactions Macroscopic reactions Kinetics
Photosynthesis R0-R13 24 3 2 3 2 2 2 Light CO H O P DHAP O i (MR1) Carbohydrate synthesis and upper glycolysis
R14-R19, R146 2 ATP H O ADP Pi H (MR2) 2 2DHAPH OCARB2Pi(MR3) 2
CARBATPPi H ADP DHAP (MR4)
2
2 2 2 2
CARB ATPH O DHAP ADP H (MR5)+ - Lower glycolysis R19-R24 DHAP2ADPPiNADPYR2ATPNADHH O2 (MR6)
Lipids synthesis R25, R46 R107-R120 2 7 . 16 2 3 . 6 3 . 29 5 . 12 7 . 14 7 . 14 2 14 . 3 8 . 19 3 . 29 5 . 12 7 . 14 7 . 16 CO O H NADP NADH ADP Pi PA O H NADPH NAD ATP PYR DHAP (MR7)
Citric acid cycle and oxidative phosphorylation
R25-R35, R52-R53
2 2 2
2.5 11.5 11.5 12.5 3 11.5 13.5
PYR O ADP Pi HCO ATP H O (MR8)
2 2 2
2.5 3
PYR O H CO H O (MR9)+ -
R40, initially irreversible, was found to prevent transformation of PAs back to pyruvate and DHAP. To allow their consumption during the night, R108 was assumed reversible. One reversible macroscopic reaction for the synthesis of PAs was obtained with elementary flux analysis (Table 1).
Stoichiometric coefficients are non-integers because PAs are a group of molecules precursor of lipids composed of different carbon chains lengths (C12-C18). To group all PAs under one entity, a generic reaction (R120) was used. Its stoichiometric coefficients were determined experimentally by the proportion of each class of PA present in the cell (Kliphuis et al. 2011).
The macroscopic reaction obtained respects balance of the cofactors. For example 14.7 ATP yield 14.7 ADP and Pi. In addition, synthesis of PAs is expensive in terms of energy: 14.7 ATP and 29.3 NADPH are necessary for each PA. This agrees with the fact that microalgae primarily store carbohydrates before storing lipids (Devi et al. 2012).
3.3.5 Citric acid cycle and oxidative phosphorylation
Citric acid cycle takes place in the mitochondrion and transforms pyruvate into many precursor monomers for nitrogen assimilation, nucleotide and protein synthesis. For each run of the cycle, energy cofactors are generated (NADH, FADH2) and can be breathed into ATP thanks to oxidative phosphorylation.
As only central carbon metabolism is considered here, citric acid cycle is coupled with oxidative phosphorylation to oxidize pyruvate molecules to CO2 generating ATP.
The reduction of this sub-network leads to two macroscopic reactions (Table 1). Macroscopic reaction (MR8) corresponds to the complete oxidation of one molecule of pyruvate coupled with oxidative phosphorylation. Reaction (MR9) corresponds only to the oxidation part, which can be compared to a futile cycle where the cell burns away energy. Indeed, reaction (MR9) results from reaction (MR8) coupled
with reaction (MR2) and thus can be deleted when considering all the reactions for building the model.
The ratio PYR/ATP (11.5) is close to what can be found in literature where a complete run of a citric acid cycle can lead up to 15 ATP (Perry et al. 2004). The difference is probably due to the conversion yield of NADH and FADH to ATP (1.5 and 2.5 respectively).
In a living organisms, only a part of carbon issued from pyruvate is breathed into . The rest is used for the synthesis of functional biomass (proteins and nucleotides). Here we assumed that 42.4 % of pyruvate carbon is used for functional biomass synthesis (unpublished results, obtained taking into account the whole metabolic network of the microalgae).
Fig 3: Comparison of carbon mass quota of internal metabolites obtained by simulation of system (7) (lines) and experimental data (dots) from (Lacour et al. 2012). light intensity
A. Evolution of biomass. ●, ○ , biomass
B. Evolution of internal metabolites: ●, ○ , carbohydrates (CARB); ■, □, lipids (PA) ; , , functional biomass (𝐵); pyruvate (PYR) + dihydroxyacetonephosphate (DHAP)
3.3 Macroscopic reaction kinetics and simulations
The reduced model is described by 16 metabolites and 7 macroscopic reactions grouped into a stoichiometric matrix . The complete model has been assessed with
experimental data of a continuous culture of Isochrysis affinis
galbana under day/night cycle (Lacour et al. 2012). Cultures
were grown in duplicate in 5L cylindrical vessels at constant temperature (22°C) and pH (8.2). Hence, a dilution term ( was added and the following ODE system (7) was obtained:
(9)
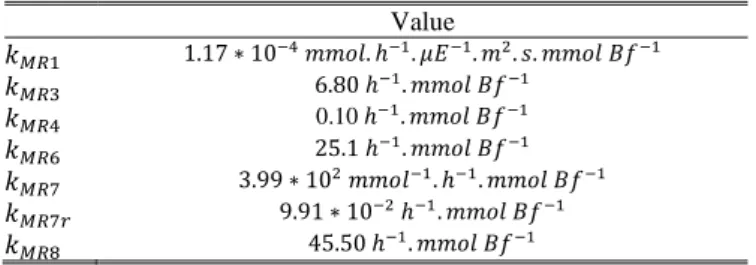
The definition of the reaction kinetics is the final building block of our approach. For each macroscopic reaction obtained after the reduction step, simple proportional kinetics were assumed (Table 1 and 2). In addition reaction (MR2), corresponding to maintenance was considered null. Kinetic parameters were estimated using a minimization algorithm (function fminsearch under Scilab (www.scilab.org)).
Table 2: Parameters value used for the model simulation.
Value 0.10
The simulation shows a cyclic metabolic behavior (Fig 3), which is representative of microalgae metabolism in day/night condition. Indeed, as observed in the experimental results, the model accurately represents lipids and carbohydrates accumulation during the day and consumption during the night (Fig 3).
To conclude, we have presented the basic principles of a new framework for modeling microbial systems under non-balanced growth. The proposed strategy results from a compromise between complexity and representativeness. It conciliates intracellular and macroscopic models.
Future work will consist in incorporating nitrogen metabolism in order to represent nitrate starvation and its impact on lipids and carbohydrates accumulation.
REFERENCES
Bastin, G. & Dochain, D., 1990. On-line estimation and adaptive control of
bioreactors, Amsterdam: Elseviers.
Bernard, O., 2011. Hurdles and challenges for modelling and control of microalgae for CO2 mitigation and biofuel production. Journal of
Process Control, 21(10), pp.1378–1389.
Boyle, N.R. & Morgan, J.A., 2009. Flux balance analysis of primary metabolism in Chlamydomonas reinhardtii. BMC systems biology, 3(4), pp.1–14.
Burgard, A.P. et al., 2004. Flux coupling analysis of genome-scale metabolic network reconstructions. Genome research, 14(2), pp.301–312. Chang, R.L. et al., 2011. Metabolic network reconstruction of
Chlamydomonas offers insight into light-driven algal metabolism.
Molecular systems biology, 7(518), pp.1–13.
Chisti, Y., 2007. Biodiesel from microalgae. Biotechnology advances, 25(3), pp.294–306.
Edwards, J.S., Ibarra, R.U. & Palsson, B.O., 2001. In silico predictions of Escherichia coli metabolic capabilities are consistent with experimental data. Nature biotechnology, 19(2), pp.125–130. Georgianna, D.R. & Mayfield, S.P., 2012. Exploiting diversity and synthetic
biology for the production of algal biofuels. Nature, 488(7411), pp.329–335.
Heijnen, J.J. & Verheijen, P.J.T., 2013. Parameter identification of in vivo kinetic models: Limitations and challenges. Biotechnology Journal, 8(7), pp.768–775.
Klamt, S. & Stelling, J., 2003. Two approaches for metabolic pathway analysis? Trends in biotechnology, 21(2), pp.64–9.
Kliphuis, A.M.J. et al., 2011. Metabolic modeling of Chlamydomonas reinhardtii: energy requirements for photoautotrophic growth and maintenance. Journal of Applied Phycology, 24(2), pp.253–266. Lacour, T. et al., 2012. Diel Variations of Carbohydrates and Neutral Lipids
in Nitrogen-Sufficient and Nitrogen-Starved Cyclostat Cultures of Isochrysis Sp.1. Journal of Phycology, 48(4), pp.966–975.
Liu, B. & Benning, C., 2012. Lipid metabolism in microalgae distinguishes itself. Current opinion in biotechnology, 24(2), pp.300–309. Mahadevan, R., Edwards, J.S. & Doyle, F.J., 2002. Dynamic flux balance
analysis of diauxic growth in Escherichia coli. Biophysical journal, 83(3), pp.1331–1340.
Manichaikul, A., Ghamsari, L. & Hom, E., 2009. Metabolic network analysis integrated with transcript verification for sequenced genomes. Nature
Methods, 6(8), pp.589–592.
Merchant, S.S. et al., 2011. TAG, You’re it! Chlamydomonas as a reference organism for understanding algal triacylglycerol accumulation.
Current opinion in biotechnology, 23(3), pp.352–363.
Orth, J., Thiele, I. & Palsson, B., 2010. What is flux balance analysis?
Nature biotechnology, 28(3), pp.245–248.
Ovádi, J. & Saks, V., 2004. On the origin of intracellular compartmentation and organized metabolic systems. Molecular and cellular
biochemistry, 256-257(1-2), pp.5–12.
Perry, J.J., Staley, J.T. & Lory, S., 2004. Biosynthèse des monomères. In
Microbiologie, cours et questions de révision. Paris: Dunod, pp. 206–
228.
Prathima Devi, M., Venkata Subhash, G. & Venkata Mohan, S., 2012. Heterotrophic cultivation of mixed microalgae for lipid accumulation and wastewater treatment during sequential growth and starvation phases: Effect of nutrient supplementation. Renewable Energy, 43, pp.276–283.
Provost, A. et al., 2006. Metabolic design of macroscopic bioreaction models: application to Chinese hamster ovary cells. Bioprocess and
biosystems engineering, 29(5-6), pp.349–366.
Ramkrishna, D. & Song, H., 2012. Dynamic models of metabolism: Review of the cybernetic approach. AIChE Journal, 58(4), pp.986–997. Rügen, M. et al., 2012. Network reduction in metabolic pathway analysis:
Elucidation of the key pathways involved in the photoautotrophic growth of the green alga Chlamydomonas reinhardtii. Metabolic
engineering, 14(4), pp.458–467.
Schuster, S., Dandekar, T. & Fell, D.A., 1999. Detection of elementary flux modes in biochemical networks: a promising tool for pathway analysis and metabolic engineering. Trends in biotechnology, 17(2), pp.53–60.
Song, H.S., Morgan, J.A. & Ramkrishna, D., 2009. Systematic development of hybrid cybernetic models: application to recombinant yeast co-consuming glucose and xylose. Biotechnology and bioengineering, 103(5), pp.984–1002.
Song, H.-S. & Ramkrishna, D., 2010. Prediction of metabolic function from limited data: Lumped hybrid cybernetic modeling (L-HCM).
Biotechnology and bioengineering, 106(2), pp.271–284.
Song, H.-S. & Ramkrishna, D., 2009. When is the Quasi-Steady-State Approximation Admissible in Metabolic Modeling? When Admissible, What Models are Desirable? Industrial & Engineering
Chemistry Research, 48(17), pp.7976–7985.
Terzer, M. & Stelling, J., 2008. Large-scale computation of elementary flux modes with bit pattern trees. Bioinformatics (Oxford, England), 24(19), pp.2229–2235.
Williams, P.J.L.B. & Laurens, L.M.L., 2010. Microalgae as biodiesel & biomass feedstocks: Review & analysis of the biochemistry, energetics & economics. Energy & Environmental Science, (3), pp.554–590.
Zamorano, F. et al., 2013. Dynamic metabolic models of CHO cell cultures through minimal sets of elementary flux modes. Journal of