Testing the Debye Function Approach on a Laboratory X-ray
Powder Diffraction Equipment. A Critical Study.
Ruggero Frison,a) Antonio Cervellino,b) Giuseppe Cernuto,c) Antonietta Guagliardi*.a)
and Norberto Masciocchic)
a) Istituto di Cristallografia del CNR and To.Sca.Lab, Via Lucini 3, 22100 Como, Italy
b) Swiss Light Source, Paul Scherrer Institut, 5232 Villigen, Switzerland
c) Dipartimento di Scienza e Alta Tecnologia, Università dell’Insubria, and To.Sca.Lab, Via Valleggio 11, 22100 Como, Italy
Total Scattering Methods are nowadays widely used for the characterization of defective and nanosized materials. They commonly rely on highly accurate neutron and synchrotron diffraction data collected at dedicated beamlines. Here, we compare the results obtained on conventional laboratory equipment and synchrotron radiation when adopting the Debye Function Analysis method on a simple nanocrystalline
material (a synthetic iron oxide with average particle size near to 10 nm). Such
comparison, which includes the cubic lattice parameter, the sample stoichiometry and the microstructural (size-distribution) analyses, highlights the limitations, but also some strengthening points, of dealing with conventional powder diffraction data collections on nanocrystalline materials.
Key words: Powder diffraction, total scattering methods, Debye function analysis, synchrotron radiation, iron oxide.
I. INTRODUCTION
Although known since long (Warren, 1990), total scattering methods have recently witnessed an unexpected Renaissance. This is largely due to the availability of dedicated neutron and synchrotron radiation beamlines (allowing the measurement of statistically significant signals at
Q values (Q = 4sin/) reaching, in the most fortunate cases, 50-80 Å-1) and to the development of suitable computational tools, capable of dealing with many aspects of the data analysis steps (data reduction, Fourier analysis, pattern simulation, etc.). Two data analysis techniques for total scattering data are nowadays employed: i) the Pair Distribution Function (PDF) strategy (Egami and Billinge, 2000), which relies on the computation (and on the signal matching) of Fourier-transformed scattering patterns, and allows the determination of structural features by fitting direct-space properties to the “observed” PDF trace; ii) the Debye Function Analysis (DFA, Hall, 2000), which operates directly in reciprocal-space, and actively uses the whole list of interatomic distances of preconceived models to obtain the best matching. The details of this second protocol, which has been recently developed in our laboratories and adopted in characterizing a number of relevant nanocrystalline [noble metals (Cervellino et al., 2004), oxides (Cernuto et al., 2011ab), bioapatites (Guagliardi et al., 2010)] or defective (a paracrystalline organometallic polymer - Masciocchi et al., 2012) functional materials, are presented in a separate section. Suffice here to say that, differently from the strict requirements imposed by the PDF approach (particularly evident in the sine-Fourier transform procedure), the necessity of reaching high–Q values is no longer valid in the DFA approach, making the method possibly suitable also when laboratory equipment with conventional Cu-tube sources are used.
In parallel activities, chemists and material scientists begun to explore the nanoworld, originally with imaging techniques (Transmission Electron Microscopy, in its Cryo-TEM or HR-TEM versions, or contact microscopies – STM and AFM). Imaging may afford valuable sub-nanometer structural, as well as morphological, information, at the expense of the poor statistical significance, being nearly impossible to sample, to a reasonable extent, the entire specimen. This problem is, however, easily overcome by diffraction techniques, where the size of the
illuminated sample is in the mm3 range, although lowering the beam-size down to a few m2 can
be achieved.
The present contribution aims to highlight the viability of the DFA method for a routine characterization of nanocrystalline matter using well conditioned, conventional, powder
diffraction (PD) equipment rather than dedicated beamlines, the access to which is necessarily limited. To this goal, the same representative material, a nanocrystalline iron oxide, has been measured at the X04SA-MS beamline of the Swiss Light Source and on an in-house diffractometer. Results and mutual comparison of the derived structural and microstructural features will be discussed, highlighting the value, and the limitations, characterizing both experiments.
II. MATERIALS AND METHODS A. SAMPLE PREPARATION
The chemicals used in the synthesis process were iron(II) chloride tetrahydrate (Sigma-Aldrich), iron(III) chloride hexahydrate (Sigma-Aldrich), ethanol (Fluka), ammonium hydroxide solution (Fluka) and were used without any further purification.
Iron Oxide Nanoparticles (IONP) were synthesized at room temperature by co-precipitating bi
and trivalent iron ions. 1.0 g (0.005 mol) of FeCl2·4H2O and 2.72 g (0.010 mol) of FeCl3·6H2O
(molar ratio Fe(II)/Fe(III) = 0.5) were dissolved in 100 mL of ultrapure water (Milli-Q) [Solution A]. Separately, to 100 mL of 1 M ammonia solution, 50 g of ethanol were added [Solution B]. Later, under vigorous stirring, Solution A was added to Solution B. A dark precipitate quickly formed, which, being magnetic, was recovered 5 minutes after precipitation by the application of a supermagnet. The recovered solid was washed several times with ultra pure water, followed by a final washing with acetone. The powders were eventually dried in an oven at 50 °C for 16 hours.
An amorphous Iron Oxide material (AIO) was obtained as follows: 2.72 g (0.010 mol) of
FeCl3·6H2O were dissolved in 100 mL of ultrapure water. This solution was added to 100 mL of
1 M ammonia solution, maintained under vigorous stirring. A precipitate quickly formed, which, after 5 minutes, was recovered by centrifugation, washed several times with ultrapure water and finally with acetone. AIO was eventually dried in an oven at 50 °C for 16 hours.
B. SYNCHROTRON RADIATION DATA COLLECTION
Diffraction data were collected at the X04SA-MS beamline of the Swiss Light Source synchrotron facility at the Paul Scherrer Institut, from a sample loaded in 0.3 mm glass capillary, using a Debye–Scherrer geometry and approximately 15 keV radiation (λ = 0.826996 Å), partial
He beam path, and a Mythen II detector covering 115° with 0.0038° angular resolution (Bergamaschi et al., 2010). Data were carefully subtracted for absorption-corrected air and capillary scattering contributions before DF analysis, following the procedure described in a manuscript in preparation.
C. CONVENTIONAL DIFFRACTOMETER DATA COLLECTION
Ca. 200 mg of the pristine material were deposited in the hollow of an aluminium sample holder, equipped with a zero-background quartz single-crystal plate (supplied by the Gem Dugout, State College, PA). Sample size: a cylinder, 25 mm in diameter and 0.2 mm deep. Diffraction data
were collected on a Bruker AXS D8 Advance : diffractometer, equipped with a 2 kW Cu-tube,
2.5° Soller slits, 0.3° divergence slit and a position sensitive Lynxeye detector. Ni-filtered
Cu-K radiation was used, with the generator operating at 40 kV and 40 mA. Two data collections
were performed in the 15-100° 2 range, 2 = 0.020°, one on the pristine material (L#1) and
one on the same material, stored in the dark, in air and at room temperature for ca. 10 months (L#2). In the last case, a fine tuning of the detector electronics allowed reduction of the fluorescence level, increasing by at least a factor of five the peak-to-background ratio.
D. THE DEBYE FUNCTION APPROACH
For many nanocrystalline materials, powder diffraction is mostly used as a qualitative tool to correctly assign the crystalline phase. This limited way of using the technique is in part due to the first apparent (and perhaps the most relevant) effect, of the nanoscale on the diffraction trace: the long range order turns, inevitably, into a short range order which - in the reciprocal space - causes diffraction peaks to broaden and overlap. Under these conditions, the conventional PD method of analysis developed for microcrystalline powders (namely, the Rietveld approach – Young, 1981) suffers of a further limitation of the information that can be extracted. In fact, in several real cases, a lot of information is contained in the scattering between and below the Bragg peaks. This is referred as diffuse scattering and is typically observed in nanosized and/or disordered materials.
If a list of coordinates of the atoms within an entire nanoparticle (whether periodic, nearly periodic or even amorphous) are known, total-scattering (X-rays or neutron) pattern simulations can be performed using Equation (1), originally introduced by Peter Debye nearly one century
ago (Debye, 1915). This equation relies on the knowledge of the complete set of interatomic distances in the nanoparticle:
(1)
where: Q = 2q, q = 2sin/ is the length of the reciprocal scattering vector, is the radiation
wavelength, fj is the atomic form factor, dij is the interatomic distance between atoms i and j, N is
the number of atoms in the nanoparticle. The first summation takes into account the contribution of the (zero) distances of each atom from itself, the second summation that of the non-zero distances within pairs of distinct atoms.
A more effective way to deal with real nanoparticles, where thermal vibrations (or static disorder) and partial occupancy factors are taken into account, is represented by equation (2), in
which each atomic species is associated with two new (in principle, refinable) parameters (Tj and
oj), suitably describing these effects (the first summation refers to the zero distances between an
atom and itself).
(2)
In addition, since no real sample can be considered as made by identical nanoparticles, but, instead, must possess specific size and shape distributions, the experimental total scattering trace can be fruitfully approximated by the sum of a set of traces calculated for individual nanocrystals (Cervellino et al, 2003). Each individual trace will then be used (and weighted) depending on the relative population of each component, normally approximated by a smoothly changing (monovariate or bivariate) log-normal distribution, characterized by specific average and variance values (Cervellino et al., 2010a).
These features have been recently introduced in the DEBUSSY suite of programs (Cervellino et
al., 2010b), which, inter alia, strongly benefits for highly reduced computational times allowed
by the use of fast distance-sampling algorithms; in our approach, several computational tricks help in overcoming the intrinsic (nearly impossible) task of using the original Debye Equation, which suffers of not practical computational times if nanoparticle sizes fall above 10 nm or so. Moreover, DEBUSSY also manages possible lattice expansions/contractions, atomic occupancy
and Debye-Waller factor variations as a function of crystal size. These aspects are simultaneously considered in the model refinement procedures, and, for the specific case here studied, commented in detail in the following section.
III. RESULTS AND DISCUSSION
Using the synchrotron (S) and laboratory (L#1 and L#2) diffraction data collected on the IONP sample, and adding the properly scaled diffraction trace of the AIO (specifically prepared
without the addition of Fe(II) ions), the DEBUSSY program (Cervellino et al., 2010b) has been run using the following model:
a) Ideally ordered magnetite nanocrystals (s.g. Fd-3m) of spherical shape were built using the
DEBUSSY Suite procedure, with diameters ranging from 1 to 34 nm and granting the correct stoichiometry (the largest nanocrystal possessing 50 shells around the central unit cell);
b) The (cubic) lattice parameter, the (isotropic) thermal factor of all atoms [one O, Wyckoff’s
32e position, and two crystallographically independent Fe sites (tetrahedral, Wyckoff’s 8a,
and octahedral, Wyckoff’s 16d position)] and the site occupancy factor of the octahedral Fe site, were simultaneously relaxed;
c) The shape (average diameter, <d>, and variance, ) of a number-based log-normal
distribution of IONP were also refined, aiming at comparing the size distributions obtained
from markedly different experiments.
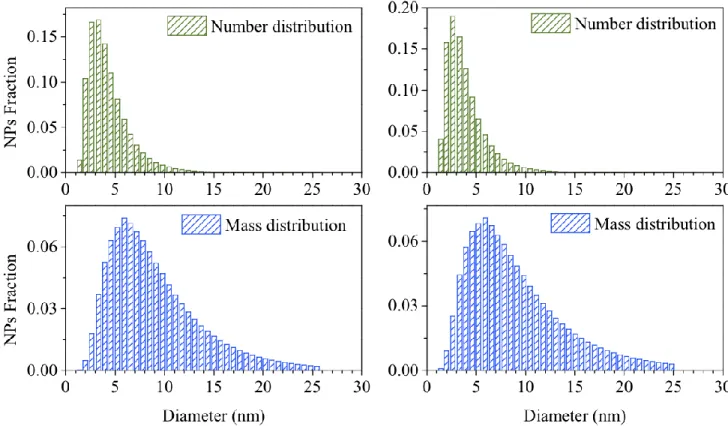
After convergence, typically reached after several hundred cycles (a few hours of CPU runtime on a computer equipped with a 3.0 GHz Intel Core Duo processor and running under Linux), the following results, shown as graphical plots of the final powder pattern matching (Figure 1) and of the 1D size distributions (number- and mass-weighted, Figure 2), and partially summarized in Table 1, were obtained.
Figure 1. Final plot of the powder pattern matching obtained on synchrotron (S, left, = 0.826996 Å) and conventional laboratory (right) equipment (L#2 dataset, Cu-K radiation), using the Debye Function Analysis as implemented in the DEBUSSY Suite of programs. Horizontal scale, 2, °; Vertical scale, Intensity, a.u. The color codes in the insets address the meaning of the different traces
Figure 2. Plots of the number (top) and mass (bottom) size distributions obtained from S (left) and L#2 (right) diffraction data on IONP material. Horizontal axis: NP Diameter (nm); Vertical axis, Relative fraction. The curves are nearly identical and demonstrate the strength of this approach, when instrumental contributions to the peak width are negligible (S) or small (L). These conditions are suitably met by nanoparticles with average sizes below 10 nm.
Table 1. Comparison of the structural and microstructural parameters derived by the Debye Function Analysis of the IONP material (see text) from Synchrotron and Laboratory datasets. E.s.d.’s in parentheses. Values in italics are obtained as averages weighted by the mass
distribution population. Note that in the FexO4 formulation, x = 3 would represent the ideal magnetite, and x = 2.667 the ideal maghemite stoichiometries.
Parameter Synchrotron Dataset Laboratory Dataset #1 Laboratory Dataset #2 Lattice Parameter, ao, Å 8.3632(2) 8.3616(1) 8.3490(3)
Average <d>, nm (number distribution) 4.4 5.2 3.9
Average , nm (number distribution) 2.2 2.3 2.1
Average <d>, nm (mass distribution) 9.0 9.0 8.9
Average , nm (mass distribution) 4.6 4.0 4.7
s.o.f. (FeO) 0.907(5) 0.950(11) 0.946(4) Biso (FeT), Å2 0.50(2) 0.70(2) 0.94(3) Biso (FeO), Å2 1.03(3) 0.31(4) 1.99(1) Biso (O), Å2 0.48(3) 0.01(1) 0.58(1) x in FexO4 2.813(11) 2.900(22) 2.892(8) Rwp, %; GOF 3.78, 3.32 0.29a, 1.68 2.62, 1.68
a This very low value depends on the high fluorescence background, not eliminated by the Ni-filter in the diffracted beam. Better S/N values have indeed been obtained in dataset L#2, by carefully tuning the electronic window of the PSD Lynxeye detector. Accordingly, more statistically significant agreement factors are obtained in the latter case.
The results shown in Table 1 clearly suggest the following observations:
i) The lattice parameters which can be derived from the S and L#1 experiments, even when the
peak broadening is significant (as in the present case), are very similar (8.363 and 8.362 Å, respectively). This suggests that relative variations from a set of samples may be fruitfully used for physico-chemical correlations, although it must be also taken into account that
small misalignments (typically, specimen displacement errors) may induce -dependent
peak shifts, which are more probable in L, rather than in S data.
ii) The lattice parameter derived from the L#2 experiment, i.e. on the pristine sample stored for
ca. 10 months with no special care in a laboratory drawer, is significantly lower (8.349 Å). If
derived by the DFA approach, this indicates the progressive aerial oxidation of the high
specific surface IONPs, leading to NPs of -Fe2O3 formulation (i.e., maghemite).
iii) Reasonable agreements are also observed in the microstructural parameters derived from the
DFA of the three datasets. Perhaps surprisingly, the average sizes and widths of the number- and mass- log-normal size distributions match very well (as pictorially shown in Figure 2), thus giving us confidence in the possibility of deriving meaningful microstructural parameters also from conventional laboratory data (as long as the diffraction peaks are not significantly affected by the instrumental broadening). This very important statement contrasts the common assumption that, on applying total-scattering methods to diffraction data of low Q-resolution, no meaningful information can be obtained. While this is certainly true for PDF and related techniques [sine-Fourier-transforming the observed data into real (direct) space], the DFA, working in the measurement (reciprocal) space does not suffer (to this extent) of truncation errors and other artefacts imposed by data analysis.
iv) A final warning should, however, accompany the comparison of “structural” features, such
as sof’s and thermal parameters; probably because of some systematic errors hidden in the experimental data, the limited Q-range and counting statistic available the L data are much less reliable.
v) Apparently, at least for cubic materials where peak overlap is minimized, much more
information can be retrieved from peak widths and shapes of L data (regardless of the knowledge – and proper treatment – of the ubiquitous, and contaminating, wider IRF), than from the intensity distribution alone. However, the much larger thermal parameter observed for the iron ion lying in the 16d position (octahedral site) may result from the presence of
cationic vacancies, which, in the -Fe2O3 structure, are known to be disordered in nanosized
materials, and order in the enantiomorphic tetragonal supercells of larger crystals (Somogyvári et al., 2002).
IV. CONCLUSIONS
The Debye Function Analysis of nanocrystalline matter, as implemented in the DEBUSSY suite of programs has been here used on conventional laboratory equipment data, (mostly) aiming at the extraction of average crystal sizes and of their dispersion. Comparison with the results
obtained from parallel experiments on the very same material, performed at a synchrotron beamline, allowed us to highlight the pitfalls, but also the strength, of this approach. If a well defined (experimental and computational) protocol, allowing the correct determination of structural and microstructural parameters of nanosized materials, can be devised even by using conventional, widely accessible, X-ray powder diffractometers, this would give to material scientists new perspectives, and new dimensions, for the characterization of their nanocrystalline samples.
Work can be anticipated in the direction of tailoring suitable experimental conditions for laboratory equipment, which would give better agreement for the still unsatisfactory match described above among some of the results obtained from different techniques; these would include elimination of fluorescence, usage of strictly monochromatic X-ray beams, longer data collections and narrower optics. Finally, inclusion of the IRF in the simulation of the diffraction trace is also lying in our roadmap, thus partially “cleaning” the laboratory data from unwanted instrumental contributions.
ACKNOWLEDGEMENTS
Partial funding from Fondazione Cariplo (Project N. 2011-0289). A few data collections were performed at the Material Science Beamline of the Swiss Light Source of the PSI, Villigen, CH.
Bergamaschi, A., Cervellino, A., Dinapoli, R., Gozzo, F., Henrich, B., Johnson, I., Kraft, P., Mozzanica, A., Schmitt, B. and Shi, X. T. (2010). “The MYTHEN detector for X-ray powder diffraction experiments at the Swiss Light Source,” J. Synchrotron Radiat. 17, 653-668.
Cernuto, G., Masciocchi, N., Cervellino, A, Colonna, G. M. and Guagliardi A. (2011). “Size and shape dependence of the photocatalytic activity of TiO2 nanocrystals: a total scattering Debye Function study,” J. Amer. Chem. Soc. 113, 3114-3119.
Cernuto, G., Galli, S., Trudu, F., Colonna, G.M., Masciocchi, N., Cervellino, A. and Guagliardi, A. (2011). “Investigating the Amorphous–Crystalline Interplay in SiO2/TiO2 Nanocomposites by Total Scattering Methods,” Angew. Chem. 123, 11020-11025.
Cervellino, A., Giannini, C. and Guagliardi, A. (2003). “Determination of nanoparticle type, size and strain distribution from X-ray data for monoatomic f.c.c.-derived non-crystallographic nanoparticles,” J. Appl. Crystallogr. 36, 1148-1158.
Cervellino, A., Giannini, C., Guagliardi, A., Zanchet, D. (2004). “Quantitative analysis of gold nanoparticles from synchrotron data by means of least-squares techniques,” Eur. J. Phys. B, 41, 485-493.
Cervellino, A., Giannini, C. and Guagliardi, A. (2010). “DEBUSSY: a Debye user system for nanocrystalline materials,” J. Appl. Crystallogr. 43, 1543-1547.
Cervellino, A. and Guagliardi, A. (2010) “Turning the Debye Function into an Efficient Total Scattering method for Nanocrystals,” in Diffraction at the Nanoscale: Nanocrystals, Defective and
Amorphous Materials edited by Masciocchi, N.; Guagliardi A. (Insubria University Press, Varese,
Italy).
Debye, P. (1915). “Zerstreuung von Röntgenstrahlen,” Ann. Phys. 46, 809-823.
Egami, T. and Billinge, S. J. L. (2003). Underneath the Bragg Peaks, Volume 16: Structural Analysis of Complex Materials (Pergamon Press, Oxford, UK).
Guagliardi, A., Cedola A., Giannini, C., Ladisa, M., Cervellino, A., Sorrentino, A., Lagomarsino, S., Cancedda, R. and Mastrogiacomo, M. (2010), “Debye function analysis and 2D imaging of nanoscaled engineered bone” Biomat. 31, 8289-8298.
Hall, B. D. (2000), “Debye function analysis of structure in diffraction from nanometer-sized particles,” J. Appl. Phys., 87, 1666-1675.
Masciocchi, N., Maspero, A., Cervellino, A., Guagliardi, A. (2012). “From paracrystalline Ru(CO)4 1D polymer to nanosized ruthenium metal: a case of study through Total Scattering analysis”, Cryst. Growth Des. 12, 3631-3637.
Somogyvári, Z., E. Sváb, E., Mèszáros, G., Krezhov, K., Nedkov, I., Sajó, I. and Bourée, F., (2010) “Vacancy ordering in nanosized maghemite from neutron and X-ray powder diffraction,” Appl. Phys. A: Solids Surf. 74, S1077-S1079.
Warren, B. E. (1990). X-ray Diffraction (Dover, New York).