WORKING
PAPERS
SES
N. 484
VII.2017
Faculté des sciences économiques et sociales
Simple Statistical Screens to
Detect Bid Rigging
Simple Statistical Screens to Detect Bid Rigging
David ImhofJuly 9, 2017
Abstract
The paper applies simple statistical screens to a bid-rigging cartel in Switzerland, and shows how well the screens detect it by capturing the impact of collusion on the discrete distribution of the bids. In case of bid rigging, the support for the distribution of the bids decreases involving a lower variance, illustrated by the coefficient of variance and the kurtosis statistic. Furthermore, when firms rig bids without side-payment, the di↵erence between the first and the second lowest bids increases whereas the di↵erence between the losing bids decreases, involving a negatively skewed distribution of the bids, highlighted by the relative distance and the skewness statistic. Finally, the collusive interaction screen shows that the behaviour of firms changed radically between the cartel and post-cartel periods. Therefore, the simple statistical screens proposed in this paper purpose to screen large dataset and to detect bid-rigging cartels by using only information on bids.
JEL-Classification
C00, C40, D22, D40, K40, L40, L41 Keywords
Bid rigging detection, screening methods, variance screen, cover bidding screen, structural and be-havioural screens.
Acknowledgement
The author would like to thank Christian At, Marc Blatter, Karine Brisset, Stefan B¨uhler, Alain Egli, Yavuz Karag¨ok, Thierry Madi`es, Armin Schmutzler and Markus Wyssling for support and helpful comments.
Disclaimer
All views contained in this paper are solely those of the author and cannot be attributed to the Swiss Competition Commission nor to its Secretariat.
1 Introduction
Although illegal, bid-rigging still remains a pervasive problem and may concern an important share of economic activities realized through auctions. Generally, price-fixing and bid-rigging cartels in-flate prices up to 10-20% (seeOECD, 2002); Connor and Lande (2005) even find that the median price increase due to collusion is around 25%. In the case studied in this paper, prices fell by 25-30% after the collapse of the bid-rigging cartel. Considering that public procurement accounts for roughly 15% of the GDP in OECD countries, the potential damage of bid-rigging may be enormous involving a vast waste of public money for governments. Therefore the fight against bid-rigging is a priority for competition agencies.
In general, competition agencies depend on whistle-blowers or leniency applications in order to prosecute and to open any investigation against bid-rigging cartels (see OECD, 2013). For the purpose of enhancing the fight against bid-rigging cartels competition agencies have to develop a proactive approach to prosecute bid-rigging cartels. They need a simple detection method for broad screening, and the detection method used must produce reliable results in order to open an investi-gation. Is there such appropriate instrument to detect bid-rigging cartels?
We construct a detection method fitting to the need of competition agencies: the method is simple to replicate, fast to implement, easy to understand in a court, and produces reliable results. Follow-ing a companion paperImhof et al. (2014), we develop theoretical and practical arguments for the implementation of simple statistical screens. We describe how bid-rigging cartels may occur under a few general assumptions and we develop screens adequate to detect them. Screens are alternative tests to determine if market outcomes are deviating from a competitive state, and we illustrate with the Ticino case how well screens capture the impact of bid rigging on the discrete distribution of the bids. The bid-rigging cartel in Ticino was a well-organized and market embracing cartel: the cartel rigged all tenders from January 1999 to March 2005, all firms participated to the cartel and prices inflated up to 25% - 30%. Such case is interesting to study both collusion and the performance of any detection method.
pro-cess. Bid coordination is crucial if the cartel wants to control the submitted bids from its members. A cartel, which cannot control the bids of its members, would have little chance to be successful. We assume that bid coordination through exchange of information reduces the support for the distribu-tion of the bids: bids from the cartel are closer involving a lower variance and a greater convergence of the bids. We test this prediction with the coefficient of variation and the unbiased kurtosis statistic, and we find for the Ticino case that bids are significantly closer in the cartel period: the coefficient of variation is lower and the kurtosis statistic is higher.
Second, we discuss that the di↵erence between the first and the second best bid matters in pro-curement: cartel members put a certain di↵erence between the two lowest bids to ensure the reward of the contract to the firm designated by the cartel. Besides, we assume also that the di↵erence be-tween losing bids is low because firms do not want to appear too expensive. In such a cover bidding mechanism, bid rigging may render the discrete distribution of the bids (more) negatively skewed. To detect this bidding behaviour, we use the di↵erence in percent between the first and the second best bid, the unbiased skewness statistic and the relative distance (see alsoImhof et al., 2014, for the relative distance). For the Ticino case, we observe that the distribution of the bids is more negatively skewed in the cartel period. Therefore, when distance between bids matters, bid rigging transforms the distribution of the bids in a more negatively skewed distribution.
Finally, repeated bid-rigging conspiracies may produce a specific bidding pattern because of cover bids and the possible rotational element due to contract allocation within the cartel. The col-lusive interaction screen proposed byImhof et al. (2014) can detect such specific colluding pattern. Unlike the previous screens, this screen does not analyse each tender but it focuses on the inter-action of one firm with another or the interinter-action of one firm within a group of firms. It assumes how competitive interaction should look like and how cover bids with contract allocation through bidder rotation produce a specific bidding pattern. We implement the collusive interaction screen to the Ticino case and we find that the bid-rigging cartel a↵ects strongly the distribution of the bids. Furthermore, the depicted interactions between bidders suggest that the bid-rigging cartel operates in a rotation pattern. When contrasted with the cartel period, our results clearly indicate a radical
change for the post cartel period: the behaviour of firms fits the hypothesis of competition predicted by the screen. Therefore, this empirical evidence supports the use of the collusive interaction screen as proposed byImhof et al. (2014).
All simple screens used in this paper are based on simple assumptions. For the cartel period, they detect serious deviations in the distribution of the bids, as theoretical and empirical arguments predict it. We show that simple screens purpose to detect bid-rigging cartels in large dataset using only information on bids. Moreover, since their implementation is uncomplicated, simple screens are an appropriate instrument for competition agencies.
The next section reviews the literature on screening methods. Section 3 describes the Ticino case. Section 4 presents the variance screen. Section 5 discusses the cover-bidding screen. Section 6 illus-trates the collusive interaction screen. Section 7 discusses policy recommendations for competition agencies. Section 8 concludes.
2 Literature on Screening Methods
The literature divides screening methods in two types: structural and behavioural methods (see Harrington, 2006; OECD, 2013). Structural methods list the factors that influence the likelihood of collusion. They are three categories of factors: structural factors as the number of competitors, market transparency or entry barriers; supply-side factors as homogeneous product, similar costs between competitors or poor innovation on the market; and demand-side factors as the demand fluctuation, strong buying power, demand elasticity or growing demand.
Unlike structural screens, behavioural methods aim to detect cartel by analysing the behaviour of firms on the markets. Generally, behavioural screens use prices to study the behaviour of firms, but others variables as quantities, market shares or firm investments can serve to study whether or not firms behave in a competitive way. However, many behavioural screens focus on the pricing strategy of firms, which is the simplest variable to analyse in order to determine how firms behave. We divide behavioural screens in two categories: the complex methods and the simple screens. For example, complex methods are the structural econometrics for auction or ARCH or GARCH model for price
Figure 1: Screening Methods
series.
Concerning simple screens,Harrington (2006) proposes a list of screens for price and for quantity as strategic variables. We consider that higher price and low variance are the most used screens in the literature (seeHarrington, 2006; Jimenez and Perdiguero, 2012; OECD, 2013). If many papers apply complex methods to both price-fixing and bid-rigging cartels, researchers solely use simple screens for price-fixing cartels and not for bid-rigging cartels. This paper and the companion paper Imhof et al. (2014) propose to fill this gap and to build a detection method based on simple screens to uncover bid-rigging cartels.
We also di↵erentiate between ex ante and ex post analysis. An ex ante analysis means that the market analysis is made without previous knowledge about collusion. Imhof et al. (2014) is one ex-ample of such ex ante analysis. In contrast, an ex post analysis refers to a paper, as this paper, for which information about collusion is available, and researchers can di↵erentiate between competi-tion and collusion. The distinccompeti-tion between competicompeti-tion and collusion is necessary to evaluate the performance of any screen.
2.1 Behavioural screens 2.1.1 Price-fixing Cartels
Some papers showex post, i. e. after the detection of the cartel, the impact of collusion using the variance screen. Abrantes-Metz et al. (2006) analyse the movements of prices for the sale of frozen seafood to the Defense Personnel and Support Center (DPSC) in Philadelphia. After the breakdown of the cartel, they observe that the simple mean of prices decreases by 16% whereas the standard deviation increases by over 200%. Esposito and Ferrero (2006) analyse the Italian gasoline and baby food markets using the simple mean and the standard deviation for prices. Again, they find under collusion that prices are higher and that variance of prices is lower. More complex method as econo-metric analysis of price series are also implemented for price-fixing cartels: Bolotova et al. (2008) demonstrate the impact of the lysine cartel and the citric acid cartel by analysing the price evolution with an ARCH and GARCH model.
Very few papers try to identifyex ante possible price-fixing cartels, where no prior information about collusion is available.Abrantes-Metz et al. (2012) show possible evidence of Libor manipulation using di↵erent indicators. One of them is the coefficient of variation calculated with the daily quote of the banks comprised in the panel. The authors conclude that a sudden increase in the variance may be indicative of an anomalous outcome. Jimenez and Perdiguero (2012) propose a good review on empirical papers for the variance screen. Using the coefficient of variation and the average price for each gas station, they analyse the retail gasoline market in Canary Islands. Because they have no information on collusion, they rely on two benchmarks: a monopoly firm located in two islands and an independent firm acting more aggressively on the gasoline market. First, they show the negative impact of independent gas stations on prices and on a rigid pricing structure: prices are lower and price variance is higher in the presence of an independent gas station. Second, firms in an oligopoly situation behave very closely to the monopoly situation indicating potential competitive issues. Their empirical analysis contributes to illustrate the relationship between price rigidity and market structure: we should consider it when applying the variance screen.
2.1.2 Bid-rigging Cartels
The detection of bid-rigging cartels generally relies on structural econometrics of auction models. Some papers illustrate the impact of bid riggingex post: Porter and Zona (1993) analyse the rank of the bids with a multinomial logit model. They show that the ranks of cover bids are not related to the control variables like the distance or the free capacity of a firm. However, they find the opposite results for the non-cartel firms, whose bids are related to the control variables. Porter and Zona (1999) also analyse the milk school market using a reduced bid function and they find that collusive bidders bid lower in more distant place than in near places. They argue that this result does not fit a competitive bidding behaviour.Pesendorfer (2000) uses also the data from the milk school market and emphasizes the di↵erence between a strong and a weak cartel.1 He demonstrates that weak cartel can achieve efficiency if there are many contracts to allocate between cartel members. Using the property of statistics order, he shows that non-cartel bids stochastically dominate cartel bids. Then, he estimates the reduced bid function, and he confirms his prediction: the residuals of non-cartel bidders stochastically dominate the residuals of the cartel members.
Bajari and Ye (2003) formalize a method to detect bid-rigging cartels ex ante with no prior infor-mation, using auction theory developments, especially in first-sealed bid auction with asymmetric bidders (see Lebrun, 1996, 2002; Maskin and Riley, 2000a,b). They propose two econometric tests, namely, the conditional independence test and the test for the exchangeability of bids. The test for the conditional independence of the bids checks if residuals between firms are correlated: contem-poraneous correlation between firms could indicate collusive issues. The test for the exchangeability of bids postulates that if the control variables are permuted among firms, then the bids should also be permuted. In other words, the control variables enter symmetrically in the reduced bid function for each bidder. They apply the two tests and find that three firms may be colluding in two potential bid-rigging cartels.Jakobsson (2007) applies the conditional independence test on a Swedish database using a spearman rank correlation test, and finds significant correlation for 50% of the pairs of firms. Chotibhongs and Arditi (2012a,b) implement the two econometric tests, and show evidence of
collu-1A strong cartel operates with side-payment whereas a weak cartel functions without side-payment (seeMcAfee and
sion for a group of 6 firms. Three of these six firms were involved in bid-rigging cases or bid frauds. Related to the econometric estimation of the reduced bid functions,Ishii (2008) uses a conditional logit model to explain the intern functioning of a bid-rigging cartel in Osaka. He validates that the cartel operates in a rotation scheme and allocates contracts within cartel members based on a simple rule: the number of days of no winning determines the cartel member, to whom the cartel allocates the contract.
Structural estimation of auction model is also used to detect bid rigging: Baldwin et al. (1997) construct a competitive and a collusive structural model, and apply them to oral-timber auction data using maximum likelihood estimation. They find that the collusive model outperforms the compet-itive model. Banerji and Meenakshi (2004) find also that a collusive model explains better the data than a competitive model when applied to oral ascending auctions for rice.Aryal and Gabrielli (2013) combine both econometric and structural estimations of auction models to detect bid-rigging cartels within anex ante procedure. They suggest that cost under collusion must stochastically dominate cost under competition but find no conclusive results.
As we can see, detection methods for bid-rigging cartels use extensively econometric or structural estimations. However, if we look for simple methods to detect bid-rigging cartels, we find very few papers: Feinstein et al. (1985) develop a model of collusive behaviour in a multi-period auction market where purchasers are asymmetrically misinformed from bidders. They test their model on the highway construction cartels of North Carolina, and find that the coefficient of variation is lower when bidders collude and colluding bidders submit higher bids. They also find that collusion is characterized by a frequent and repeated interaction of the same group of bidders. Furthermore, this paper and the companion paperImhof, Karagoek, and Rutz (2014) lie exactly in the specific segment of the screening literature for simple detection methods applied to bid-rigging cartels.
2.1.3 Structural screens
Many theoretical papers discuss structural screens, which identify market characteristics favouring collusion. Generally, researchers use a Cournot or a Bertrand model in a context of supergame or
repeated interactions to study tacit collusion (see?, for a theory of oligopolies). Factors that favour tacit collusion may also explain explicit collusion. However, any screen developed in a context of tacit collusion produces generally too many false positive results: for example, if a few number of firms are active on an industry with high entry barriers, it does not mean that they are necessary colluding. On the other hand, structural screens produce very few false negative results: if a high number of firms are active in an industry with no entry barriers, the likelihood that they collude is very low. Therefore, structural screens may help to exclude industries for deeper investigations, and to suggest suitable candidates for the use of behavioural screens. We consider that both types of screens are complementary: competition agencies should investigate closely industries flagged by both structural and behavioural screens.
OECD (2013) divides the factors that render collusion more likely in three groups: structural, supply-related and demand-related factors. Among all factors, concentration in a peculiar industry increases the likelihood of collusion (seeTirole, 1988; Bain, 1956). Empirical studies also confirm this theoretical prediction. Fraas and Greer (1977) analyse more than 600 cases and prove that few firms participate to a majority of cartels examined. Related to concentration, entry barriers, high degree of interaction among firms and market transparency enhance the likelihood of collusive outcome (seeStigler, 1964; Green and Porter, 1984; Snyder, 1996). Stigler (1964) show that transparency allows immediate retaliation in case of deviation and favours tacit cooperative outcome.
Concerning supply-related factors, production capacities have an ambiguous e↵ect. Using a Bertrand supergame with exogenous capacity constraint,Brock and Scheinkman (1985) show that the minimum discount factor supporting tacit collusion depends non-monotonically on firm capacity. When total capacity of all firms is slightly below the monopoly outcome, the severity of the pun-ishment exceeds deviation gains form collusion: firms continue to collude. In contrast, when total capacity of all firm increases, harshness of punishment diminishes and collusive equilibria are sus-tainable until gains from one period deviation outweighs the punishment e↵ect. Compte et al. (2003) use equally a Bertrand supergame with exogenous capacity and find that asymmetry in capacity may have pro-competitive e↵ect even if the market is concentrated. Compared to a situation where
firms are symmetric, large firms have an incentive to cheat because short-term gains are superior considering the limited capacity of small firms to retaliate. Benoit and Krishna (1987) and Davidson and Deneckere (1990) endogenize the firm capacity in a model with a capacity choice game followed by a price supergame. Both papers find that collusion implies capacities in excess to punish devia-tion from collusive outcome. Furthermore,Davidson and Deneckere (1990) show that any increase in collusive price is paired with a higher level of capacity.
Multimarket contact may support collusion because punishment for deviation from a collusive equilibrium a↵ects all markets. Bernheim and Whinston (1990) show that multimarket contacts en-hance the probability of collusion, if markets and firms are asymmetric. In case of symmetry, multi-market contacts do not influence incentives for colluding. Gilo et al. (2006) demonstrate that cross-shareholding in competitive firms may favour the emergence of cooperative outcome. Anti-trust practitioners consider also product homogeneity as a characteristic supporting collusion. But, theo-retical results remain ambiguous (seeRoss, 1992). However, Hay and Kelley (1974) analyse previous antitrust cases and show that products are relatively homogeneous in most cases of collusive agree-ments. In addition, collusion is more likely in mature industries with poor innovation rate.
Concerning the demand side, growing demand or stable demand might favour collusion and price wars appear to be more frequent in period of recession. Green and Porter (1984) suggested that, lower demand trigger price wars, unless those observed sharp price drops are a self-enforcement policy used by the cartel. In contrast,Rotemberg and Saloner (1986) show that collusion is more prof-itable when demand is low because punishment is tougher than when demand is high. Empirically, Suslow (1991) addresses with question and find that recession and economic depression increase the probability of collapse for a cartel. The power of a buyer may also hinder collusion: Snyder (1996) demonstrates that a buyer can reduce the likelihood of collusion if he group his purchases in large and less frequent orders.Pesendorfer (2000) also concluded that large contracts are better than small and medium sized contracts, because it impedes firms to reach sustainable agreements without side-payment.
use disaggregated data for industries classified by three digits, and they estimate logit and ordered logit models to investigate the relationship between uncovered cartels as endogenous variable and structural variables favouring collusion as exogenous variables. They find that growing demand a↵ects positively the likelihood of collusion. In contrast, demand variability has a negative impact on collusion.
3 Ticino Asphalt Cartel
The Ticino cartel has existed since the 50s.2 However, since the mid-90s, collusion has not been so easily sustainable as it used to. Less disciplined cartel members acted more competitively and price war reached its peak in intensity in the year 1998. In fact, harsh competition and weak prices associated with the risk of bankruptcy motivated firms to settle down an agreement at the end of 1998. They applied this agreement called the convention3from 1999 to April 2005, date to which the new revision of the Cartel Act in Switzerland entered in force with direct sanctions.4 During this period, called hereafter the cartel period, all firms active in the road construction sector participated to the cartel, and they rigged all contracts for road construction without exception. Therefore, the Ticino cartel is certainly one of the most severe bid-rigging cartel, also called all-inclusive cartel because all firms participated to rig every contract. It is also an excellent case to study collusion and to test how well detection methods perform.
Close to the end of the cartel, local politicians went to COMCO because they began to suspect prices to be exaggerated. COMCO investigated the prices for road construction, and found that the price index for road construction was significantly higher in Ticino. In fact, as the price index for the rest of Switzerland decreased in 2002, the price index for Ticino continued rising, as depicted on figure 2.5 Finally, the bid-rigging cartel denounced itself in order to benefit immunity until April 2005.
The cartel convention was a written document, and instituted weekly mandatory meeting, at
2Ticino is a Canton in Switzerland, which is comparable to a State. 3In Italian:la convenzione
4For COMCO decision, see Strassenbel¨age Tessin (LPC 2008-1, pp. 85-112). 5Source: Swiss Federal Statistical Office.
Figure 2: Evolution of the Price Index for Road Construction
which all firms active in the road construction sector participated. The cartel convention sanctioned absence to these meetings without valid and legitimate reasons, and punished absent firms by possi-ble loss of future contracts. In practice, it is unknown if such punishment took e↵ectively place. In each meeting, firms had to announce every new construction contract from public procurement au-thorities as every other private construction contract above 20’000 CHF. During the meetings, firms discussed contract allocation among them and the bids to submit.
The cartel convention defined di↵erent criteria to allocate new construction contracts. As first criterion, the free capacity of a participant firm was preponderant in the allocation mechanism. Second, the location of the contract work played also a crucial role in the allocation mechanism among participants, especially for contracts below 500’000 CHF. Third, firms considered also the specialization of the participants to allocate contracts. Fourth, the convention privileged participants first invited by private actors to estimate a quotation considering the other criteria. 6 The final decision of contract allocation was adopted by a majority. In case of divergence, firms vote in secret, except firms involved in litigation.
The Ticino bid rigging cartel never used side-payments, and is therefore a weak cartel (seeMcAfee
6Estimating a quotation causes costs, which are not recoverable if another firm wins the contract. To avoid such sunk
costs, the convention stipulated that the firm who first announced a private contract had the priority on the contract. It fostered also the announcement of contracts to the cartel because private contracts are more difficult to observe than public contracts.
and McMillan, 1992, for the definition of a weak and a strong cartel). Following Pesendorfer (2000), two conditions allow a weak cartel to achieve efficiency as a strong cartel. First, there must be many contracts to allocate every year within the cartel members. As we can see from table 2 below, the high number of contracts tendered in the years 1999 to 2004 meets the first condition.
The second condition is the Ranking Mechanism, as described byPesendorfer (2000), which should be a sort of algorithm to allocate contracts among cartel members. In the Ticino cartel, the cartel con-vention played the role of the Ranking Mechanism described byPesendorfer (2000). It forced cartel members to reveal their true preferences, systematically controlled by the allocation criteria of the cartel convention, in order to avoid adverse selection problem. In fact, the cartel convention on its own searched to determine the bidder with the lowest cost for a specific contract in order to maximize theex ante payo↵ of the cartel.
After allocating contracts between cartel members, firms discussed prices. For public contracts, all involved firms had to calculate their bids before the meeting. The cartel member, chosen con-sidering all criteria, revealed his price. All participants discussed then the revealed price, and they determined together the best price to submit for the designated winner and the cover bids. Involved participants could not renounce to submit a bid in public tenders; the convention made them submit a bid, respectively a cover bid.
COMCO did not investigate how the cartel members determined the price for the designated winner. However, it is likely that they should have used a rule or any other mechanism to determine relatively quickly the price for the designated winner. In fact, without such a rule, discussions about price could linger too much. One rule could be the following one: the designated winner revealed his price and if the price was not exaggerated, he could submit the bid to this revealed price. Another rule could be that every member revealed their prices and then calculated the arithmetic mean of all prices; the price of the designated winner could be the calculated arithmetic mean.
If other cartel members had calculated a cheaper bid than the one determined in the discussion, they inflated their bids by some factor to ensure that the designated cartel member would win the contract. The convention stipulates that submitted cover bids should be calculated and justifiable
for each position on the bidding documentation provided by procurement agencies. Moreover, cover bids should be high enough relative to the winning bid so that they would not be considered by procurement agencies ensuring the rewarding of the contract to the designated winner.
At the end of the cartel, prices dropped significantly: they were suddenly 25%-30% cheaper than engineer estimates7. It is interesting to note that engineers progressively endogenized the higher cartel price, as proposed by Harrington and Chen (2006). Thus, this observation is an indication to use with caution engineer estimates to normalize the bids to obtain the dependent variable for econometric estimations, as used byBajari and Ye (2003).
COMCO condemned all involved firms rendering the decision in 2007 but did not pronounce sanctions against them because the involved firms ceased illegal conducts before April 2005, date to which the revised Federal Act on Cartels entered in force with a sanction regime after a transi-tion phase from 2004.8 Because the Ticino road construction cartel was discovered before this date and because the cartel stopped illicit infringements before the final transitory date of April 2005, COMCO did not sanction the involved firms. If they had been sanctioned, they would have paid a roughly CHF 30 mio penalty.
COMCO defined the relevant market as the market for road construction and pavement in Can-ton Ticino with an upstream market for asphalt pavement material, which plays a strategic role on the road construction and pavement industry. Asphalt pavement material constitutes of 95% of ag-gregates and 5% of asphalt or bitumen and is a crucial input for covering and pavement works. It has to be heated at a mixing plant in order to be mixed and transported quickly to the contract location to cover the road before getting cold. Market specialists say that the duration of asphalt once mixed is comprised between one hour and one hour and half; it is then possible to be operational in a radius of 50-80 km from the production mixing plant.
Because its importance in pavement works and the necessity to transport it heated, pavement material is typically a strategic input. This influences the market structure: firms try to integrate vertically their production process by owning an asphalt mixing plant (see table 5 in Appendix, firm
7See decision Strassenbel¨age Tessin, LPC 2008-1, p. 103
3, 4, 5 and 6). Because the infrastructure for an asphalt mixing plant is important and expensive, small and local road construction firms try to join their e↵ort in vertical integration by owning com-monly asphalt production plants. In our case, twelve road construction firms own the two biggest asphalt production plants with a capacity of 80% of the overall asphalt production market in Ticino. This cross-ownership on the upstream market conditions the downstream market structure and put serious entry barriers for new competitors because the convention included a clause foreclosing the road construction market: it was forbidden to sell asphalt or other inputs for road construction to third firm not involved in the convention.9 Then, the costs to enter the market were prohibitive because any new entrant should build its own mixing plant. Second, the disciplinary e↵ect of mixing plants was real and enormous. Defecting to the cartel, respectively not taking part to the convention could have raised important difficulties for a single firm considering that asphalt may account for 50% to 80% of the price for pavement works.
3.1 Data
The database contains 334 tenders from 1995 to April 2006 (see table 1). We have the records of the tender opening10for 238 contracts and information on 1381 submitted bids concerning the identity of bidders, the price of each bids and the location of the contracts. Less information is available for 96 tenders for the years 1995 to 1998. Nevertheless, even with less information, we can still apply statistical screens to detect bid-rigging cartels except the collusive interaction screen.
Table 1: General Descriptive Statistics
Number of tenders 334
Number of submitted bids 2179
Number of tenders with details 238
Number of submitted bids 1381
Number of submitted bids from individual firm 1100
Number of bids from consortia 281
Number of winning bids from individual firms 148
Number of winning bids from consortiums 90
9Gilo et al. (2006) show that cross-ownership may sustain collusion.
10At a fixed date announced by the procurement procedure, public officials open the sealed bids received from the
submitting firms and write the price for each bid and the name of the bidder on a record. After this record, the precise examination of the bids begins.
Table 2 recapitulates the amount of contracts in CHF tendered per year. For the years 1995, 1996 and 2006, our data do not contain all contracts. However, we have all contracts for the years 1997 to 2005 and we observe an important variation for the sum of contracts tendered per year, especially between the years 1997 to 2001. There is a maximal di↵erence of 23 million between the years 1998 and 1999 representing 45% of the maximal amount tendered per year. Major and regular contracts tendered each two years explain such di↵erences.
Table 2: Tenders per year
Year Contracts Amount
1995 7 16’365’378.95 1996 18 15’881’311.40 1997 50 42’929’902.85 1998 36 28’802’066.70 1999 28 51’896’534.75 2000 27 31’479’500.25 2001 24 46’762’575.10 2002 30 38’713’586.60 2003 21 38’985’740.80 2004 45 35’282’493.70 2005 35 20’926’231.70 2006 14 19’079’459.70 Total 334 387’104’782.50
A very high degree of frequent interaction among firms characterizes our sample. This structural feature favours collusion (seeSnyder, 1996). In total, we record 24 firms in our sample but only 17 firms regularly submitted bids for covering and pavement works in Ticino. Table 3 describes the number of bids per tenders for the period from 1995 to 2006. The modus is 4 bids, the mean is 6.5 bids and the median is 6 bids. Be aware that the number of bids is not equal the number of bidders because the possibility to build a consortium.11
Table 3: Bids Distribution
Number of bids 2 3 4 5 6 7 8 9 10 11 12 13 Total
Number of tenders 13 31 53 37 42 44 33 30 18 15 10 8 334
11A consortium is a joint bidding or a business combination: two bidders or more submit jointly a bid and execute the
4 Variance Screen
Many empirical and theoretical papers, discussed in section 2, indicate that price rigidity may un-derline competitive issues. The variance screen is appropriate to capture such price rigidity by using simple statistics as the standard deviation or the coefficient of variation. In a context of bid rigging, the use of the coefficient of variation is advantageous because it is scale invariant: we can implement it to compare and characterize tenders of di↵erent values. Feinstein et al. (1985) and Imhof et al. (2014) find that lower values for the coefficient of variation indicate the activity of bid-rigging cartels.
The coefficient of variation CVtis calculated for each tender t as the standard deviation tdivided by the arithmetic mean µt:
CVt= t
µt
(1) A cartel strives to rise its rent, and firms from the cartel submit higher bids. This increases necessarily the mean µ for a tender t. Therefore, the evolution of determines the e↵ect on the coefficient of variation. We assume that decreases in case of bid rigging. In the following, we explain why exchange of information and bid coordination reduce .
Assumption 1: In case of bid rigging, the variance of the bids decreases.
Let be the distribution of the bids G(b) and its probability density function g(b) continuously dif-ferentiable in b with the following support: [
¯
b, ¯b]. Let further assume that the procurement authority has information on the G(b): it cannot directly depict G(b) but can approximate it with its support.
If bidders collude, they must exchange basic information in order to coordinate their bids. For example, a basic exchange of information could specify that firms should bid over a certain value of a. This may occur in a brief meeting or by call, sms, fax or emails with a simple message like ”bid over a”. In case of bid rigging, a is necessarily greater thanb, since the cartel submits higher bids¯ to rise its rent. In addition, bidders are also aware that the procurement authority has information about G(b) because it hires engineers and regularly holds tenders. Firms cannot choose fancy values for a, which should be less than ¯b. Therefore, we assumeb < a < ¯b and a truncates the distribution¯
of the bids G(b). We denote the truncated distribution of the bids ˜G(b) with its probability function ˜g(b) and its support [a, ¯b] where a >
¯
b. The reduction of the support due to the truncation point a lower automatically the standard deviation for ˜G(b). Therefore, we postulate in proposition 1 that the coefficient of variation for ˜G(b) is lower than the coefficient of variation for G(b)
Proposition 1. Let be G(b) the normal cumulative distribution of the bids with the distribution support [
¯
b, ¯b] and ˜G(b) the normal truncated cumulative distribution of the bids with the distribution support [a, ¯b] where a >
¯
b. The coefficient of variation of ˜G(b) is lower than the coefficient of variation of G(b). Proof. See appendix A.
If proposition 1 is true, the following equation holds:
CVG(b)=µG(b) G(b) >
˜ G(b)
µG(b)˜ = CVG(b)˜ (2)
To sum up, bid-rigging cartels need to coordinate their bids to rise prices and obtain a greater rent. Bid coordination implies explicit exchange of information on price. Because firms cannot exaggerate the price of their bids, they truncate the distribution of the bids through exchange of information: bid coordination reduces simultaneously the support for the distribution of the bids and the coefficient of variation.
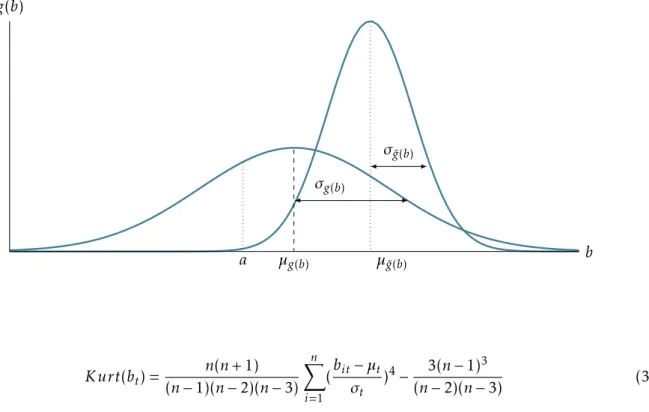
The phenomenon of truncation is valid but remains incomplete if we omit one further argument. Bidders with a bid smaller than a do not automatically renounce to submit a bid.12 If bidders with a bid smaller than a submit a bid higher than this value a, they reshape the form of the distribution of the bids as depicted on the graphic 3: the distribution of the bids become more pointed because bids converge. The convergence of the bids turns the truncated distribution of the bids ˜G(b) in a more pointed distribution than G(b). Note that the result from equation 2 still holds, because the support for the distribution of the bids remains reduced. We check the convergence of the bids with the following unbiased kurtosis statistic13for each tender t:
12In the Ticino case, the convention obligates firms to submit a bid in public tender (see section 3). 13The unbiased skewness statistic is calculated for each tender with a number of bids superior to 3.
Figure 3: Untruncated and Truncated Distributions g(b) ˜g(b) b g(b) µg(b) a µ˜g(b) Kurt(bt) =(n 1)(n 2)(n 3)n(n + 1) n X i=1 (bit µt t ) 4 3(n 1)3 (n 2)(n 3) (3)
If exchange of information transforms the distribution of the bids in a more pointed distribution, we expect higher values for the kurtosis statistics revealing the convergence of the bids during the cartel period.
We have implicitly assumed above that bidders do not scale cleverly their bids as Bajari and Ye (2003). Bid scaling would not reduce the support of the distribution of the bids, and it would produce the e↵ect of a geometrical translation, preserving more or less the properties of the function G(b). Hence, if firms cleverly scale their bids with a common factor according to their true costs, it would be impossible to detect bid rigging with the variance screen, as stated in proposition 2.
Proposition 2. If all firms collude in a specific tender t and scale their bids bi with a common factor a,
the coefficient of variation remains unchanged
Appendix A shows the trivial proof of proposition 2. In addition, proposition 2 holds not only for the coefficient of variation but also for all simple statistics presented in this paper. However, if bid scaling is theoretically possible, it is limited in practice because procurement authorities have some knowledge of G(b) and its support: bids above the estimated ¯b from the procurement author-ities would raise concern about bid rigging or bid frauds. If firms want simultaneously rise a and
not exceed ¯b in order to rise their rents and not exaggerate prices, bid scaling is limited and bid coordination still reduces the support for the distribution of the bids, and therefore the variance decreases.
4.1 Empirical Implementation
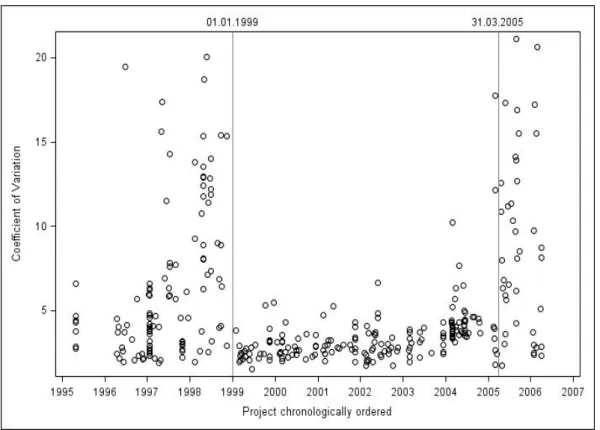
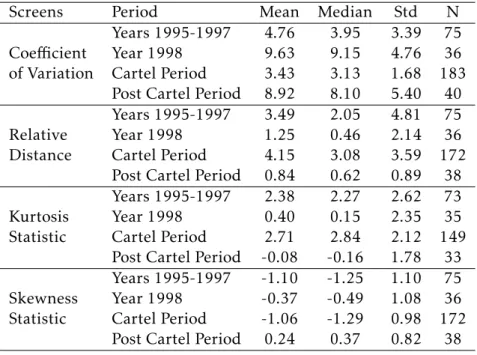
The graphic 4 depicts the evolution for the coefficient of variation. The two vertical lines delimit the cartel period between 1999 and April 2005. Each point on the graphic represents the value of the coefficient of variation for a peculiar tender. We note immediately that the coefficient of variation is significantly lower during the cartel period compared to the years 2005, 2006 and 1998. The coefficient of variation declined exactly at the beginning of the cartel convention in January 1999 and increased abruptly at the end of March 2005, just before the application of the new Cartel Act. The match between the cartel period and the modification of the coefficient of variation is perfect: we show doubtless the negative impact of the bid-rigging cartel on the coefficient of variation. The median of the coefficient of variation during the cartel period is 3.1 and the mean is 3.4 as pictured in table 4. For the post-cartel period14, the median and the mean of the coefficient of variation are respectively 8.1 and 8.9. The Mann-Whitney test15rejects the null hypothesis of no di↵erence for the coefficient of variation between the cartel period and the post-cartel period (z = 6.4318, p value < 0.0001).
Higher values for the coefficient of variation in 1998 preceding the cartel period confirm also the allegations of the defendants that firms entered in a price war during the mid of the nineties. Again, we perform a Mann-Whithney test for the post cartel period and the year 1998 and find no rejection of the hypothesis of no di↵erence (z = 0.8479, p value = 0.3965). Thus, the values of the coefficients of variation for the year 1998 are quite similar to those of the post cartel period. If high values for the coefficient of variation indicate competition, it means that competition should have characterized both periods.
However, the Mann-Whitney test rejects the null hypothesis for the post-cartel period and the
14The post-cartel period starts in April 2005.
Figure 4: The Evolution of the Coefficient of Variation
years before 1998, called pre-cartel period (z = 4.2603, p value < 0.0001) and for the cartel period and the pre-cartel period (z = 3.3788, p value = 0.0007). Therefore, the bidding behaviour of the firms during the pre-cartel period di↵ers from the post-cartel and the cartel periods: values for the coefficient of variation are lower in the pre-cartel period than in the post-cartel period but they are higher than in the cartel period, although they are closer to the cartel period than to the post-cartel period, as illustrated by the median and the mean of the coefficient of variation for the pre-cartel period in table 4. It is then very likely that firms solely collude for a subset of contracts in the pre-cartel period. To sum up, four periods emerge from the analysis of graphic 4: the pre-cartel period (from January 1999 to April 2005), the post-cartel period (from April 2005 to the end of 2006), the year 1998 and the pre-cartel period (from year 1995 to 1997).
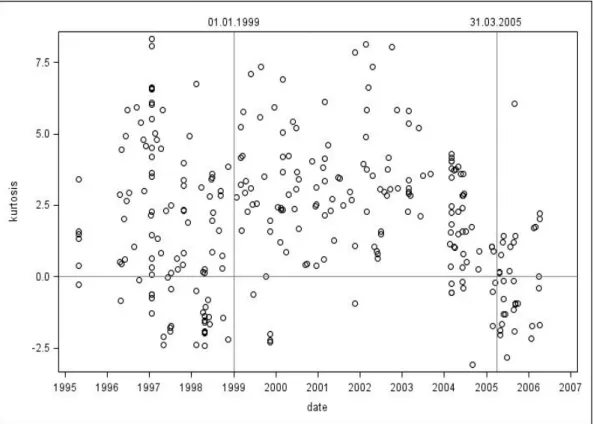
The graphic 5 shows the evolution for the values of the kurtosis statistics. The values are higher in the cartel period compared to the post-cartel period showing bid convergence: the distribution of the bids is more leptokurtic for the cartel period. Conversely, the distribution of the bids after the collapse of the cartel becomes more mesokurtic or even platykurtic: values for the kurtosis statistics
Figure 5: Evolution of the Kurtosis Statistic
become near to zero or even negative. The pre-cartel period produces mixed results comprised in the middle of the cartel and post cartel periods.
5 Cover Bidding Screen
The cover bidding screen analyses the di↵erence between the submitted bids of the cartel. We assume that a cartel, who controls the bids of its members, artificially manipulate the di↵erence between the bids. More precisely, we divide the manipulation of the di↵erence in two assumptions. First, we assume that bid-rigging cartel increases the di↵erence between the first and the second lowest bids. Second, we assume that di↵erence between losing bids decreases in case of bid rigging. For both assumptions, we outline some theoretical and practical arguments, and we propose adequate screens to capture the manipulation of bids in a first-sealed bid auction.
Assumption 2: In case of bid rigging, di↵erence between the first and the second lowest bids increases. To manipulate bids, a bid-rigging cartel must be able to control the submitted bids from its mem-bers. To control the submitted bids, firms must have an incentive to cooperate and to exchange their
true costs for the contracts to manipulate. Since a strong cartel uses side-payment, firms have in-centive to reveal their true costs (seePesendorfer, 2000). However, the Ticino’s bid-rigging cartel is a weak cartel and it operates without side-payment. Then, it is important for a weak cartel function-ing without side-payment to ensure contract allocation within the cartel. If allocation between firms participating in the cartel without side-payment is not possible, the cartel cannot control the sub-mitted bids, and it is unstable because firms do not have incentive to reveal their true costs. In fact, Pesendorfer (2000) shows that any incentive compatible mechanism without side-payment is not e ffi-cient for a finite number of contracts because any effiffi-cient cartel mechanism implies that firms truly revealed their costs. In the absence of side-payment, firms do not report truthfully their costs, and the cartel cannot control their bids. However, if the probability of winning for all firm participating in the bid-rigging cartel is sufficiently large and is independent from the reports, then weak cartels perform better. Securing the allocation of contracts to all firms in the cartel ensures the probability of winning to be large enough: firms reveal their true costs and cooperate. To secure the allocation of contracts, the cartel manipulate bids and put distance between the first and the second lowest bids, so that the procurement agency choice the designated firm from the cartel. This protection or cover pattern ensures the stability and the continuity of the cartel.
Furthermore, price is not the unique criterion in the awarding procedure of contracts. Procure-ment authorities regard other criteria such as work timing, organization, references, quality and environmental aspects in the awarding process. Therefore, coordination of bids must consider this non-price competition, and artificially rise the di↵erence between the first and the second lowest bids to ensure that the designated firm from the cartel wins the contract. COMCO observation con-firms this prediction: witnesses in bid-rigging cases have reported that con-firms from bid-rigging cartels regularly put a cover distance of 3-5% between the first and the second lowest bids submitted from the cartel.16
Structural asymmetry between bidders does not change unless external shocks. The existence of
16See e.g. Strassenbel¨age Tessin (LPC 2008-1, pp. 85-112, in particular recital 60) or Wettbewerbsabreden im
Strassen-und Tiefbau im Kanton Z¨urich (LPC 2013-4, pp. 524-652, in particular p. 561, recital 182 and p. 573, recital 309 and 314).
asymmetry between bidders, also calledmoney on the table, may explain the di↵erence between the first and the second lowest bids. An external shock a↵ecting all the market can reduce or increase asymmetry between bidders and therefore significantly a↵ects the di↵erence between the first and the second lowest bids. Structural screens detect such external shock. However, if structural screens indicate no external shock, and if the di↵erence between the first and the second lowest bids signif-icantly increases or decreases for a non-temporary period, then bid rigging is a better explanation than structural asymmetry between bidders.
All arguments presented above indicate that a bid-rigging cartel manipulates the di↵erence be-tween the first and the second lowest bids to ensure contract allocation to firms in the cartel. There-fore, we should analyse the di↵erence between the first and the second lowest bids, and its evolution over the time. Any important and non-temporary variation could indicate bid-rigging issues, es-pecially if no structural screens indicate an external shock. To examine this di↵erence, we use the percentage di↵erence between the first and the second lowest bids as screen. We check if it increases during the cartel period.
Assumption 3: In case of bid rigging, di↵erence between the losing bids decreases.
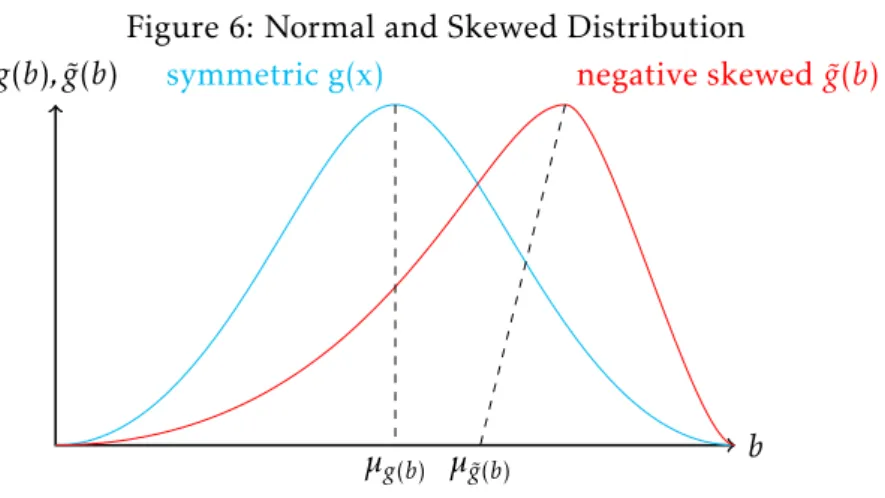
Several practical reasons explain why distance between losing bids decreases. First, firms do not want to appear too expensive. E↵ectively, a firm submitting too high bids may give a negative signal to procurement authorities. The potential reputation costs associated with higher bids push the losing firms to submit similar bids: therefore, the di↵erence between cover bids is low. Second, cover bids are close in order to replicate competition process: (losing) firms compete hardly for the contract and only a firm (the designated firm by the cartel) submits a slight better bid. Third, calculating bids may take time. If a firm submits a cover bid, it has no interest to invest time to calculate an accurate bid, and focuses on the value of the winning bid, designated by the cartel, to submit its own bid, just a bit higher to ensure that the designated firm wins the contracts. If all firms submitting cover bids behave the same, then cover bids may be close one with another. All these practical reasons explain why the di↵erence between the losing bids is low in case of bid rigging.
Figure 6: Normal and Skewed Distribution g(b), ˜g(b)
b
symmetric g(x) negative skewed ˜g(b)
µg(b) µ˜g(b)
a (more) negatively skewed distribution as depicted on figure 6. We calculate directly the skewness for the discrete distribution of the bids for each tender t to check this assumption with the following unbiased skewness statistic17:
Skew(bt) = n (n 1)(n 2) n X i=1 (bit µt t )3 (4)
Note also that assumption 2 reinforce the skewness for the distribution of the bids. E↵ectively, if the di↵erence between cover bids is small, and simultaneously if the di↵erence between the first and the second lowest bids is important, then skewness will be more striking. Therefore, we expect to find a more negatively skewed distribution of the bids for the cartel period.
If we combine assumption 2 and 3, we build a screen to check precisely for tenders, where the di↵erence between the first and second lowest bids is important and the di↵erence between the cover bids is small. Imhof et al. (2014) propose to use the relative distance to capture such cover bidding mechanism. The relative distance divides the di↵erence between the first and second lowest bids
1t= b2t b1tby the standard deviation of the losing bids t,losingbids.
RDt= 1t t,losingbids
(5) Formula 5 normalizes the di↵erence between the first and second lowest bids by the standard deviation of the losing bids in order to compare the relative distance among tenders, which basically
remains a rough marker for the skewness of the distribution of bids.18
Considering the formula 5, if the ratio of the relative distance is equal to 1, there is no significant di↵erence between both distances, i. e., there is no significant positive or negative skewness within the distribution of the bids. If the ratio is superior to 1, it indicates that the di↵erence between the first and second lowest bids exceeds the di↵erence between losing bids. The distribution of the bids is negatively skewed. However, if the relative distance is inferior to 1, this indicates that the di↵erence between the first and second lowest bids is small: the second lowest bid could be a credible alternative for procurement authorities. For the cartel period, we expect to find values for the relative distance above 1 and values under 1 for the post-cartel period.
5.1 Empirical Implementation
Graphic 7 depicts the evolution for the percentage di↵erence between the first and the second lowest bids. We observe that many tenders for the cartel period exhibit an approximate percentage di ↵er-ence of 5%. However, we find very few observations under 2.5%. Contrasting with the cartel period, the percentage di↵erence substantially decreases for the post-cartel period. Nevertheless, we still find for the post-cartel period five observations above the level of 5%. We explain this high percent-age di↵erence by the large cut in prices after the collapse of the cartel, and not by the existence of bid rigging.19 Similar to the post-cartel period, we find again many observations under 2.5% for the year 1998 before the cartel onset. Therefore, graphic 7 confirms that the bid-rigging cartel ar-tificially manipulates the di↵erence between the first and the second lowest bids. It also suggests that the percentage di↵erence between the first and the second lowest bids can screen for abnormal outcomes.
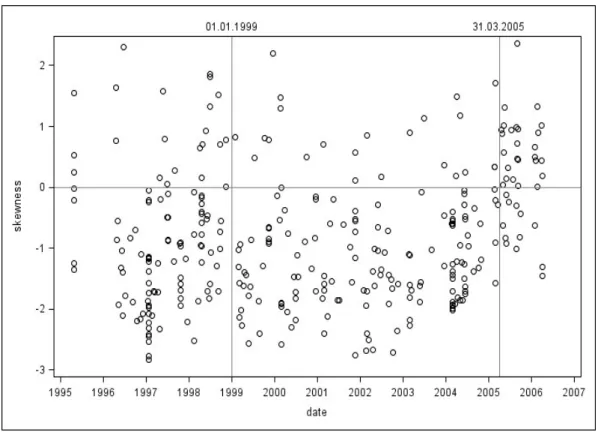
Graphic 8 illustrates the evolution of skewness calculated with an unbiased estimator for each tender t. The skewness analyses the di↵erence between all bids in a tender, and not just between the first and second lowest bids, as the percentage di↵erent presented above. For the cartel period,
18We also calculate the ratio of the relative distance screen as the di↵erence between the first and second lowest bids
divided by the mean of the di↵erence between the losing bids. In this case, we find similar results as for the relative distance.
Figure 7: Evolution of the Di↵erence Between the First and Second Best Bid
we observe that the skewness statistic is negative: the distribution of bids is skew to the left side. However, the results for the post-cartel period contrast with the cartel period, since we find a more centred or even positively skewed distribution of bids with values around zero or positive values. For the pre-cartel period, we observe again mixed evidences.
Graphic 9 pictures the evolution of the relative distance whereby the horizontal line of 1 indicates that the di↵erence between the first and second best bids equals the standard deviation of the losing bids. We consider all tenders above the threshold of 1 as suspicious, and we find that the cartel convention strongly a↵ects the relative distance, which increases during the cartel period. From table 4, the median of the relative distance during the cartel period is 3.08 and the mean is 4.15. For the post-cartel period, the median and the mean for the relative distance are 0.62 and 0.84. The Mann-Whitney test rejects the null hypothesis of no di↵erence between the cartel period against the post-cartel period (z = 7.848, p value < 0.0001).
We also observe also that the values of the relative distance are essentially below the threshold of 1 during the year 1998 preceding the cartel convention. The Mann-Whitney test do not reject the
Figure 8: Evolution of the Skewness Statistic
null hypothesis of no di↵erence for the year 1998 and the post-cartel period (z = 0.5137, p value = 0.6075). However, we find a rejection of the null hypothesis of no di↵erence between the post-cartel period and the pre-cartel period (z = 4.7008, p value < 0.0001) and between the cartel period and the pre-cartel period (z = 3.1327, p value = 0.0019). Results for the relative distance confirm the conclusions drawn from the analysis of the coefficient of variation. We identify four periods from graphic 9: the cartel period (from January 1999 to April 2005), the post-cartel period (from April 2005 to the end of 2006), the year 1998 and the pre-cartel period (from year 1995 to 1997).
Figure 9: Evolution of the Relative Distance
Table 4: Descriptive Statistics for the Screens
Screens Period Mean Median Std N
Coefficient of Variation
Years 1995-1997 4.76 3.95 3.39 75
Year 1998 9.63 9.15 4.76 36
Cartel Period 3.43 3.13 1.68 183
Post Cartel Period 8.92 8.10 5.40 40
Relative Distance
Years 1995-1997 3.49 2.05 4.81 75
Year 1998 1.25 0.46 2.14 36
Cartel Period 4.15 3.08 3.59 172
Post Cartel Period 0.84 0.62 0.89 38
Kurtosis Statistic
Years 1995-1997 2.38 2.27 2.62 73
Year 1998 0.40 0.15 2.35 35
Cartel Period 2.71 2.84 2.12 149
Post Cartel Period -0.08 -0.16 1.78 33
Skewness Statistic
Years 1995-1997 -1.10 -1.25 1.10 75
Year 1998 -0.37 -0.49 1.08 36
Cartel Period -1.06 -1.29 0.98 172
6 Collusive Interaction Screen
FollowingImhof et al. (2014), we use the collusive interaction screen to analyse relationships among bidders. As the cover-bidding screens, it relies again on the same hypotheses. But, unlike the previ-ous screens presented above, which characterize the discrete distribution of the bids for a peculiar tender, the collusive interaction screen characterizes the interrelationship between firms using their submitted bids. If we consider a tender as a game, the collusive interaction screen analyses the emer-gence of equilibria in repeated games. The turn taking literature has shown, how repetition a↵ects the adoption of any equilibrium, and how history-dependent strategies play a crucial role in the emergence of a cooperative equilibrium (Mailath and Samuelson, 2006). Teaching history-dependent strategies is also a component of the successful implementation of turn taking (Cason et al., 2013).
Thus, the emergence of equilibria needs repetition of similar strategies, and repeated strategies leave distinct signals in the bidding behaviour of firms. We suggest that the collusive interaction screen is such an appropriate screen to detect traces of bid-rigging equilibria. In the following, we describe first how we normalize the bids in order to compare tenders of di↵erent amounts. Sec-ond, we present the hypotheses of competition and collusion, and we characterize the cooperative equilibrium for a bid-rigging cartel operating in a more or less pronounced cover-bidding scheme.
In order to analyse the interaction among bidders in di↵erent tenders, we normalize the bids with the following min-max formula:
ˆbit= bit bmax,t
bmax,t bmin,t 2 [0,1] (6)
This transformation assigns to all normalized bid ˆbit a value between 0 and 1, where the lowest bid takes the value of 0 and the highest bid takes the value of 1. Unlike the variance or the cover bidding screens, the min-max formula does not focus on the variance of the bids, but on the intern distribution of the bids per tender. By using the formula 6, we compute the Cartesian coordinates comprised in the space [0, 1] x [0, 1] for each pair of bidders involved in the same tender process. Note also that, if all normalized bid ˆbit are positive, the min-max transformation is a monotonic
transformation and a zero homogeneous function.
In a competitive environment, we assume that the normalized bids are distributed in all the regions of the space [0, 1] x [0, 1] on figure 10 over time. We justify this assumption for firms calculate independently their bids based on their costs in a competitive environment. Costs vary among firms: specialization, capacity restriction or location may influence the bidding behaviour of a firm. Some firms may have cost advantages for specific contract, and they should bid more aggressively than firms with cost disadvantages. Therefore, we should find their bids in the bottom left quadrant or near the axes on figure 10, whereas bids of cost disadvantaged firms should lie on the remaining space of figure 10, especially in the top right quadrant.20
However, we postulate that normalized bids are not distributed in all the regions of the space [0, 1] x [0, 1] in a collusive equilibrium, because repeated bid rigging produces a specific bidding pattern. In order to determine the localisation of rigged bids in the space [0, 1] x [0, 1], we have first to characterize bid rigging and how it a↵ects the bidding behaviour of firms. Again, we rely on the same assumption as for the cover-bidding screens: di↵erence between the first and the second best bids matters. The necessity to raise this di↵erence to ensure the rewarding of the contract to the designated cartel member produces a specific bidding pattern. To apprehend this bidding pattern, we make a di↵erence between two types of possible cover bids on figure 10: direct and indirect cover bids. In the case of direct cover bids, firm i wins the contract and firm j submits a higher bid to cover firm i. We find the direct cover bids on the abscissa in the bottom right quadrant or on the ordinate in the top left quadrant, as depicted by the grey shadow on figure 10.
In the case of indirect cover bids, both firm i and firm j deliberately submit higher bids in order to cover firm g. Indirect cover bids lie in the top right quadrant as indicated by the red area of figure 10. In this red area, both firms submit indirect cover bids in favour of a third firm involved in the cartel. Note that firm i and j agree to cover the designated winner g in a cartel operating without side-payment only if the reciprocal is true, respectively only if g agrees to protect firm i and g. It implies that we should find the same pattern for all, or at least, for a majority of firms involved in
Figure 10: Illustration of the Cover Bidding Test
the cartel. To sum up, the red and the grey area of figure 10 depict non-competitive area because the bids remain too high to be considered as potential alternative for the procurement authority. Thus, finding an anomalous high number of points in these two regions may be indicative of collusive equilibria.
6.1 Empirical Implementation
Figure 11 illustrates the results of the collusive interaction screen in the cartel period. For each graphic on figure 11, the abscissa depicts a single firm, whereas the ordinate shows all firms involved in the cartel: it is then possible to analyse the relationship of one firm within the cartel. First, we observe that the greatest part of normalized bids are located in the non-competitive area, as defined in figure 10. Second, we find very few normalized bids (if none) in the left bottom quadrant or near both axes. Third, all graphics exhibit the same specific bidding pattern over a period of five years and for all tenders in Ticino.
The symmetry observed on the graphics is noteworthy: each firm submitted high bids and won contracts. Such rotation pattern excludes that the cost advantage of one firm over the other bidders could explain the di↵erence between the first and the second best bids. In other words, if cost ad-vantage explains this bidding pattern, it means that all winners have systematically a significant and
a similar cost advantage for each contract over the other firms. If we cannot formally exclude such a random phenomenon, it seems however more likely that collusion explains this bidding pattern, es-pecially if we consider that we find the same pattern for all graphics on figure 11. With other words, this finding would have raise serious doubts about the existence of bid rigging in anex ante analysis, certainly sufficient to justify a deeper investigation.
To sum up, all pictures on figure 11 reject the hypothesis of competition in favour of the al-ternative hypothesis of collusion. Moreover, the specific bidding behaviour observed fits well the characteristics of a bid-rigging cartel operating on a cover-bidding scheme, as defined overhead.
The post cartel period presents the opposite picture: after the collapse of the cartel in April 2005, the bidding behaviour changes significantly as depicted on figure 12. We do not find any specific bidding pattern: for all graphics, the normalized bids are distributed in all the space [0, 1] x [0, 1], including the bottom left quadrant and the space near the axes. The observed bidding pattern fits the hypothesis of competition. In conclusion, we validate the collusive interaction screen and its assumptions proposed byImhof et al. (2014).
7 Discussion
Any detection method should be simple. Non-economist, especially agency lawyers or judges in court must assess the results produced by the detection method in order to decide whether to open an investigation or how to decide in a certain case. If they do not understand the detection method applied, they would certainly not approve to open an investigation, nor would they sign warrants to search firms for evidences. In addition, the detection method should be as little time consuming as possible. Competition agencies have limited resources: they cannot spend many resources to screen markets, since they need resources to prosecute in parallel a multitude of di↵erent cases and fulfil a variety of tasks alongside with investigations. If the detection method is complex and consume many resources, competition agencies would be reluctant to implement it. In order to save resources e↵ectively the detection method must be suitable to screen large datasets. Only a detection method screening large datasets minimizes the resources invested, and it is therefore appropriate for competition agencies. Finally, the detection method should run in secrecy. This implies again that the data requirements for the detection method should be uncomplicated: it must rely essentially on publicly available data. To sum up, any detection method must be simple to understand for agency lawyers and judges and should minimise the resources invested and must allow to screen large dataset in secrecy.
The detection method presented in this paper fulfils the requirement of simplicity. Because we model how bid rigging a↵ects the distribution of the bids, we use solely information about the ob-served bids. Therefore, the data used is publicly available. Its collection does not raise the cartel member’s attention. As the data requirements are uncomplicated, we can apply simple screens even in a context where little information is available, and it is useful for researchers or practitioners fac-ing data restriction problems. In addition, the implementation of simple screens does not require special know-how, and competition agencies, procurement bodies as large customers can also screen markets. Finally, the simple screens are flexible and may be adaptable to other cases or industries, extended or refined depending on available information as illustrated in the companion paperImhof et al. (2014).
Simple screens fulfil the requirement of simplicity, but are they reliable? To answer this question, we must first highlight one point: the detection method does not intend proof a case by itself but aims at providing enough proof or in terms of the Swiss Cartel Act ”sufficient suspicion” that allows an agency to open an investigation.21 The definition of ”sufficient suspicion” that allows an agency to open an investigation depends on the legal framework of each jurisdiction. Generally, a ”sufficient suspicion” must be coherent and objective. It must credibly substantiate the existence of a potential bid-rigging cartel, which also means that it must raise a substantial doubt on the presence of bid rigging.
For the Ticino case presented in this paper, the results are clear: simple screens reveal striking irregularities remaining unexplained by structural screens. If we would have obtained ex ante the same results as in the ex post analysis of the Ticino case, the likelihood to open an investigation would have been high. Nonetheless, future cases might not be as obvious as the Ticino case, and this observation raises another question: which degree of irregularity should we demonstrate in order to open an investigation? There is of course no clear threshold, and the answer depends on human judgement. However, the following arguments may help to assess the results obtained from simple screens.
First, any non-temporary and significant evolution for one screen shows a problem. In an ex-ante analysis, we recommend to look for structural changes. If no structural screens can explain the non-temporary and significant evolution observed for one screen, then the market may be worthy of deeper investigation. Second, how important should be the non-temporary and significant evolution to flag collusive issues on a market? For example, should the coefficient of variation increase by 20% or by 200% to alert competition agencies? It is clear that the stronger the evolution, the more suspect the market is. Competition agencies should rely on previous information from closed cases to approximate problematic values and suspect evolutions for screens. Third, the size of the sample is important: do we observe all tenders for many years or do we have only a sub-sample? The size of the sample determines the robustness of the results obtained from the screens. This last argument is
21Note that simple screens can also serve to prosecute cartels. They do not purpose to prove the existence of cartels on