HAL Id: hal-00477541
https://hal.archives-ouvertes.fr/hal-00477541v2
Submitted on 4 May 2010
HAL is a multi-disciplinary open access
archive for the deposit and dissemination of
sci-entific research documents, whether they are
pub-lished or not. The documents may come from
teaching and research institutions in France or
abroad, or from public or private research centers.
L’archive ouverte pluridisciplinaire HAL, est
destinée au dépôt et à la diffusion de documents
scientifiques de niveau recherche, publiés ou non,
émanant des établissements d’enseignement et de
recherche français ou étrangers, des laboratoires
publics ou privés.
Performance Evaluation of Core Numerical Algorithms:
A Tool to Measure Instruction Level Parallelism
Bernard Goossens, Philippe Langlois, David Parello, Eric Petit
To cite this version:
Bernard Goossens, Philippe Langlois, David Parello, Eric Petit. Performance Evaluation of Core
Numerical Algorithms: A Tool to Measure Instruction Level Parallelism. Para: State of the Art in
Scientific and Parallel Computing, Jun 2010, Reykjavík, Iceland. �hal-00477541v2�
Performance Evaluation of Core Numerical Algorithms:
A Tool to Measure Instruction Level Parallelism
Bernard Goossens, Philippe Langlois, David Parello, and Eric Petit
∗DALI Research Team, University of Perpignan Via Domitia, France †
Abstract We measure and analyze the instruction level paral-lelism which conditions the running-time performance of core numerical subroutines. We propose PerPI, a programmer ori-ented tool to fill the gap between high level algorithm analysis and machine dependent profiling tools and which provides repro-ducible results.
Keywords Running-time performance, instruction level paral-lelism, ideal processor, BLAS, polynomial evaluation, mixed pre-cision
1 Introduction
We introduce PerPI, a programmer oriented tool to focus the instruction level parallelism of numerical algorithms. This tool is motivated by results like those presented in Ta-ble 1 where two algorithms are compared with respect to flop counts and running-time measures. The first two lines are significant of the algorithm complexity while the last one presents the range of running-times measured for sev-eral desktop computers. Such measures are very classical when publishing new core numerical algorithms, e.g., dot product, polynomial evaluation — see entries in [6] for instance. These two algorithms solve the same problem:
Measure Eval AccEval1 AccEval2
Flop count 2n 22n + 5 28n + 4
Flop count ratio 1 ≈ 11 ≈ 14
Measured #cycles ratio 1 2.8 – 3.2 8.7 – 9.7
Table 1: Flop counts and running-times are not propor-tional
how to double the accuracy of a core numerical subrou-tine? Such a need appears for example in numerical linear algebra where the accurate implementation of iterative re-finement relies on a dot product performed with twice the current computing precision [2]. In Table 1, Eval is the classical Horner algorithm for polynomial evaluation and AccEval1 and AccEval2 are two challenging twice more accurate evaluations (the polynomial degree is n). AccE-val1 appears to run about three times faster than AccEval2
∗Email: first_name.name@univ-perp.fr
†This work is partly funded by the ANR Project EVA-Flo ANR-BLAN 06-2-135670 2006.
whereas their flop counts are similar. Such a speedup is interesting for basic numerical subroutines that are used at any parallelism level, and so has to be justified.
Of course only counting the number of flops within an algorithm is not significant of the actual performance of its implementation. This latter depends a lot on other fac-tors as, e.g., parallelism and memory access. Moreover measuring actual running-times is a task that is hard to re-produce and that yields results with a very short life-time since computing environments change quickly. This pro-cess is very sensitive to numerous implementation param-eters as architecture characteristics, OS versions, compil-ers and options, programming language, . . . Even when us-ing the same input data set in the same execution environ-ment, measured results suffer from numerous uncertain-ties: spoiling events (e.g., OS process scheduling, inter-rupts), non deterministic execution and timings accuracy.
Measuring the computing time of summation al-gorithms in a high-level language on today’s ar-chitectures is more of a hazard than scientific re-search [6].
This recent quotation seems to us significant of (a call for) a change of practice in the numerical algorithm commu-nity. Indeed uncertainty increases as the computer system complexity does, e.g., multicore or hybrid architectures. Even in the community of program and compiling opti-mization, it is not always easy to trust this experimental process.
If we combine all the published speedups (accel-erations) on the well known public benchmarks since four decades, why don’t we observe exe-cution times approaching to zero? [7]
A last problem comes from the gap between the algo-rithm design step and the profiling one. The algoalgo-rithmic step benefits from the abstraction of high level program-ming languages and, more and more, from the interactiv-ity of integrated developing frameworks such as Matlab. Running-time performance analysis is processed later and in a technically more complex and changing-prone envi-ronment. The programmer suffers from the lack of perfor-mance indicators, and associated tools, being independent
* * * * * + + − − − − − − − − + + + + + x_lo x_hi x P[i] P[i] r c c (i) (i+1) (i) * * x_lo x_hi x (i+1)r splitter 1 2 3 4 5 6 7 8 9 10 c c r (i+1) (i) (i) (i+1) r (n−1) (n−2) (n−3) (n−4) (n−5) (0) (1) (2) (3) (4) (a) (b) (c)
Figure 1: Data-flow graph of AccEval1
of the targeted computing architecture that would help him at the algorithmic level to chose more efficient and peren-nial solutions.
2 Analysis principles
In this Section, we describe the principles of our analysis and illustrate it with an introductory pen-and-paper analy-sis.
2.1 Principles
We propose to analyze the instruction level parallelism (ILP) of a program through a simulation of its run with a Hennessy-Patterson ideal machine [1]. The ILP represents the potential of the instructions of a program that can be executed simultaneously. Every current processor exploits program ILP thanks to well known techniques such as pipelining, superscalar execution, prediction, out-of-order execution, dynamic branch prediction or address specula-tion,. . . The ideal machine removes all artificial constraints on the ILP. A simulated ideal machine runs the program in a way such that every instruction is scheduled immedi-ately after the execution of the last predecessor on which it depends.
The following example illustrates how to quantify this ILP and what kind of information is useful to understand and improve the potential performance of an algorithm. 2.2 A first pen-and-paper analysis
Algorithms presented in Table 1 consist of one loop of length n. Figures 1 and 2 represent the data-flow graphs of the two accurate algorithms: (a) represents one iteration, (b) how one iteration depends on the previous one, and (c) the shape of the whole loop (or part of it) [3]. Two consec-utive horizontal layers represent two consecconsec-utive execution cycles within the ideal machine.
As it was manually performed, the data dependencies analysis has been here restricted to the floating-point oper-ations, i.e., to the algorithmic level description. The whole
+ − − − + − − + + + − + + x_lo x_hi x_hi x_lo x P[i] sh sh sl (i+1) (i) (i) x (i+1)sl * * + − − − − * * * * − + + splitter sh sl sh sl (i+1) (i+1) (i) (i) 10 12 19 2 1 3 4 5 6 7 8 9 11 13 14 15 16 17 18 (n−1) (n−2) (n−3) (n−4) (a) (b) (c)
Figure 2: Data-flow graph of AccEval2
program instructions will be covered with the PerPI tool further introduced. From these graphs, we count the num-ber of floating-point operations and the numnum-ber of cycles to run the code, i.e., the total number of nodes and the depth of the (c) graph. The ratio of these values measures the (floating-point) ILP, i.e., the average width of the data-flow graph. These values are reported in Table 2. AccEval1
Measure Eval AccEval1 AccEval2
FP ILP 1 ≈ 11 ≈ 1.65
Table 2: Floating-point ILP as in Table 1
benefits from about 6.66 times more ILP than AccEval2. This certainly justifies that AccEval1 runs faster than Ac-cEval2 on modern processors which are designed to cap-ture some of the ILP. Of course no quantitative correlation with the measured cycles ratios can be done as current pro-cessors have limited resources that the ideal machine has not. Nevertheless comparing the FP ILP to the FP count ratios, we deduce that the accurate evaluation AccEval1 would run as fast as the classical Eval on a processor which would capture the whole ILP of this algorithm. The anal-ysis of the graphs also exhibits the origin of such ILP dif-ferences. The two algorithms use almost the same groups of operations but AccEval2 suffers from two bottle-necks identified as vertical rectangles on the (a) graph. In this scope, this property will be useful to design other accurate algorithms based on AccEval1 rather than on AccEval2.
3 The PerPI tool
We now present the PerPI tool which automatizes this anal-ysis. PerPI currently includes the following facilities: ILP computation, ILP histogram and data flow graph display.
3.1 Computing the ILP
The measuring part of PerPI is a Pin tool[5]. It computes ILP= I/C, where I is the number of machine instructions run and C is the number of steps needed to complete the run. The higher ILP, the more parallel the piece of code.
A step is defined as the following sequence of opera-tions: for every runnable instruction, its source registers are read, its memory read references are loaded, its opera-tions are computed, its destination registers are written and eventually its memory write references are stored.
For example, addl %eax,4(%ebp) reads registers EAX and EBP, computes a = EBP + 4, loads memory referenced by a (assume value v is loaded), computes r= EAX + v and stores r to memory referenced by a (the addl instruction could be the translation of a C source code instruction such as x=x+y where x is in the function frame on the stack at address a and y is in register EAX).
A step is performed in many cycles in a real machine. However in our tool, a step is considered as atomic to match the ideal machine. As in the example, ILP is the average number of machine instructions run per step. This definition of the ILP removes any micro-architectural de-tails such as latency and throughput. We assume the piece of code is run on the best possible processor, with infi-nite resources and single cycle latency operators (including memory access and conditional and indirect branch reso-lution).
An instruction is runnable when all the source registers and all the memory read references are ready, i.e., have been written by preceding instructions.
The Pin tool computes ILP as follows. For each instruc-tion of the run, apply the following procedure.
1. For each source register, get the step at which it is updated
2. For each memory read reference, get the step at which it is updated
3. Let R be the latest of all the source register update steps
4. Let M be the latest of all the memory read refer-ence update steps
5. The instruction is run at step s = max(R, M) + 1 6. For each destination register, mark it as being
up-dated at step s
7. For each memory write reference, mark it as being updated at step s
While we compute for each instruction its step s, we up-date the number of run cycles C the following way: C = max(s,C).
For any piece of code, the set of registers and memory references are assumed to be updated at step 0 when the run starts. For reproducibility reasons, the system calls involved in the measured piece of code are not considered.
3.2 Analyzing the ILP
The observation part of PerPI consists in histograms and graphs displaying functions. These functions allow the user to zoom in and out of the trace. As before, the graph represents the instructions dependencies where an instruc-tion j depends on an instrucinstruc-tion i iff j has a source pro-vided by i ( j reads a register or a memory word x written by iand no instruction between i and j writes to x). The his-togram represents the variation of the ILP along the steps. The histogram tool is useful to locate the good (high ILP) and the bad (low ILP) portions of the code run. The graph tool is useful to analyze why a code has a high or low ILP as the example illustrates.
3.3 Results examples
We present PerPI results for some accurate summation al-gorithms introduced in [4] and previous polynomial evalu-ation algorithms. Sum2 and SumXBLAS are respectively similar to AccEval1 and AccEval2. These algorithms are implemented as C functions and are called in a main part. From a practical point of view, binary files are submitted to PerPI through a graphical interface and then some menu items generate the following outputs.
We first illustrate the ILP measured with Figure 3. Every called subroutine is analyzed, i.e., PerPI returns the num-ber of machine instructions I, the numnum-ber of step C and the corresponding ILP. The given results are those ob-tained after a single run as, as we have mentioned earlier, the computed values are fully reproducible.
s t a r t : s t a r t . . . s t a r t : main s t a r t : i n i t s t o p : i n i t : : I [ 5 3 4 ] : : C [ 1 0 5 ] : : ILP [ 5 . 0 8 ] s t a r t : Sum s t o p : Sum : : I [ 5 1 1 ] : : C [ 1 0 5 ] : : ILP [ 4 . 8 6 ] s t a r t : Sum2 s t o p : Sum2 : : I [ 1 6 1 7 ] : : C [ 2 1 4 ] : : ILP [ 7 . 5 5 ] s t a r t : SumXBLAS s t o p : SumXBLAS : : I [ 2 0 9 7 ] : : C [ 8 9 8 ] : : ILP [ 2 . 3 3 ] s t o p : main : : I [ 4 8 1 2 ] : : C [ 1 2 2 6 ] : : ILP [ 3 . 9 2 ] . . . G l o b a l ILP : : I [ 4 9 1 9 ] : : C [ 1 2 7 9 ] : : ILP [ 3 . 8 4 ]
Figure 3: A call graph with the ILP of three summation algo-rithms for 100 summands
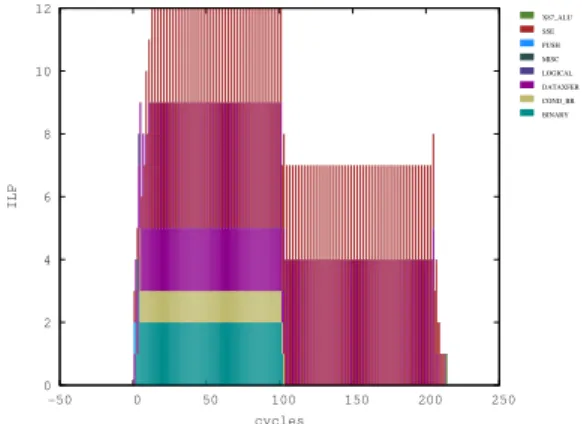
The matching histograms are presented in Figures 4 and 5 – legends are not displayed here. Zooms are available, e.g., Figure 6. In this case the red bars indicate float-ing point operations while purple ones are data transfers. These histograms exhibit the regularity of the two algo-rithms ILP and Sum2 better efficiency.
The last presented outputs are the data-flow graphs Fig-ures 7 and 8. As for the introductory ones, cycles are on the Y-axis. When zooming in some interesting parts the corresponding program instructions are displayed to help the programmer analyzing his code.
0 2 4 6 8 10 12 -50 0 50 100 150 200 250 ILP cycles BINARY COND_BR DATAXFER LOGICAL MISC PUSH SSE X87_ALU
Figure 4: Sum2 histogram for 100 summands
0 2 4 6 8 10 -100 0 100 200 300 400 500 600 700 800 900 ILP cycles BINARY COND_BR DATAXFER POP PUSH SSE X87_ALU
Figure 5: SumXBLAS histogram for 100 summands
0 1 2 3 4 5 500 505 510 515 520 ILP cycles BINARY COND_BR DATAXFER POP PUSH SSE X87_ALU
Figure 6: Zoom of Figure 4
4 Conclusions and current work
The presented performance analysis and its PerPI tool aim to fill the gap between the high level algorithm analysis and machine dependent profiling tools. We show from exam-ples on some core numerical algorithms that our prelim-inary results are interesting enough and we estimate they validate the proposed approach. We highlight the fact that these results are reproducible. They should help the pro-grammer to both justify his measured performances and improve his algorithm. The presented version of PerPI will be publicly available soon. Work is in progress to extend
the analysis facilities implemented in PerPI, as for example
Figure 7: Sum2 data flow graph for 100 summands
Figure 8: SumXBLAS data flow graph for 100 summands
identifying and observing the longest dependency chains of instructions or constraining the ideal machine. As PerPI is based on Pin it concerns x86 machine code only. We are investigating in what extent the machine language impacts the ILP measure. This is out of the scope of this paper — it is easy to find examples in which a CISC x86 piece of code has a higher ILP than its equivalent RISC MIPS or PowerPC and conversely.
References
[1] J. L. Hennessy and D. A. Patterson. Computer Architecture – A Quantitative Approach. Morgan Kaufmann, 2nd edition, 2003.
[2] N. J. Higham. Accuracy and Stability of Numerical Algo-rithms. SIAM, 2nd edition, 2002.
[3] P. Langlois and N. Louvet. More instruction level
par-allelism explains the actual efficiency of compensated al-gorithms. Technical report, DALI Research Team, 2007. http://hal.archives-ouvertes.fr/hal-00165020.
[4] T. Ogita, S. M. Rump, and S. Oishi. Accurate sum and dot product. SIAM J. Sci. Comput., 26(6):1955–1988, 2005. [5] Pin. URL = http:www.pintool.org.
[6] S. M. Rump. Ultimately fast accurate summation. SIAM J. Sci. Comput., 31(5):3466–3502, 2009.
[7] S. Touati. Towards a Statistical Methodology to
Evalu-ate Program Speedups and their Optimisation Techniques. Technical report, PRISM, UVSQ, 2009. http://hal.archives-ouvertes.fr/hal-00356529/en/.