Combined CO2
Capture and Electrochemical Conversion
in Non-Aqueous Environments
by
Aliza Khurram
Bachelor of Science, Physics and Mathematics Bates College, 2015
Master of Science, Mechanical Engineering Massachusetts Institute of Technology, 2017
SUBMITTED TO THE DEPARTMENT OF MECHANICAL ENGINEERING IN PARTIAL FULFILLMENT OF THE REQUIREMENTS FOR THE DEGREE OF
DOCTOR OF PHILOSOPHY IN MECHANICAL ENGINEERING at the
MASSACHUSETTS INSTITUTE OF TECHNOLOGY May 2020
© 2020 Massachusetts Institute of Technology. All rights reserved.
Signature of Author:
Department of Mechanical Engineering May 15, 2020
Certified by:
Betar M. Gallant Assistant Professor of Mechanical Engineering Thesis Supervisor
Accepted by:
Nicolas Hadjiconstantinou Professor of Mechanical Engineering Chair, Committee on Graduate Programs
Combined CO
2Capture and Electrochemical Conversion in
Non-Aqueous Environments
ByAliza Khurram
Submitted to the Department of Mechanical Engineering on May 15, 2020
in Partial Fulfillment of the Requirements for the Degree of Doctor of Philosophy in Mechanical Engineering
Abstract
Carbon capture, utilization, and storage (CCUS) technologies have a central role to play in mitigating rising CO2 emissions and enabling sustainable power generation. Most
industrially mature CCS technologies based on amine chemisorption are highly energy-intensive, consuming up to 30% of the power generating capacity of the plant in order to thermally regenerate the sorbents for continued capture. Moreover, the released CO2 must
additionally be compressed and stored permanently, which adds additional energy penalties and potential risks of release. To address these challenges, this thesis develops a new strategy for integrating CO2 capture and conversion into a single process stream. Such an approach,
which employs CO2 in the captured state as the reactant for subsequent electrochemical
reactions, eliminates the need for energetically-intensive sorbent regeneration and CO2 release
between capture and utilization steps while potentially providing new solutions for the storage challenge.
In the first part of this thesis, a proof-of-concept demonstration of combined CO2
capture and conversion within a Li-based electrochemical cell is presented. To develop this system, new electrolyte systems were first designed to integrate amines (used in industrial CO2
capture) into nonaqueous electrolytes. The resulting systems were found to be highly effective in both capturing and activating CO2 for subsequent electrochemical transformations upon
discharge of the cell. This activity was particularly well-demonstrated in solvents such as DMSO where CO2 normally is completely inactive, in which the amine-modified electrolytes
containing chemisorbed CO2 were found to enable discharge at high cell voltages (~2.9 V vs.
Li/Li+) and to high capacities (> 1000 mAh/gc), converting CO2 to solid lithium carbonate.
Formation of a densely-packed, solid phase product from CO2 is not only logistically attractive
because it requires less storage space, but also eliminates the costs and safety risks associated with long-term geological storage of compressed CO2. In addition, the conversion process
generates electricity at point-of-capture, which may help to incentivize integration of the technology with existing point-source emitters.
While promising, this initial system exhibited several challenges including slow formation of the active species in solution. To address this, a suite of experimental and computational methods were employed to elucidate the influence of the electrolyte on electrochemical reaction rates. Reduction kinetics were found to be influenced by alkali cation desolvation energetics, which favors larger alkali cations such as potassium. Through further development, amine-facilitated CO2 conversion was also demonstrated to be transferrable to
other amine- and solvent- systems, opening a potentially large design space for developing improved electrolytes. Furthermore, the effect of operating temperature was investigated to evaluate the potential of this technology to integrate with practical CO2 capture needs. While
higher temperatures (40°C<T<70°C) improve the conversion kinetics of CO2-loaded amines,
device-level performance – especially in the low-rate regime – remains largely governed by the Li-electrolyte stability at elevated temperatures, which needs to be addressed in future work.
Lastly, CO2 discharge activity as a function of electrolyte composition was also
investigated in non-amine electrolytes for rechargeable Li-CO2 batteries. In these systems,
increased availability of the Li+ cation was found to be critical for supporting CO
2 activation
and sustaining discharge to high capacities.
Overall, the central advance of this thesis is the successful demonstration of using amine sorbents in an electrochemical context to activate new modes of CO2 reactivity,
establishing the feasibility of integrated CO2 capture-conversion. This work not only provides
a new reaction platform, but also proposes post-combustion storage concepts of CO2 in solid
phases that simultaneously achieve permanent CO2 fixation and power delivery.
Thesis Supervisor: Betar M. Gallant
Dedication
To my parents, M. Khurram Akhtar and Naila Khurram,
who were courageous enough to let me take “the road less traveled by.”1
Acknowledgements
I owe a debt of gratitude to many people who have been instrumental in shaping my graduate school experience and helping me get to the finish line. First and foremost, I would like to thank my advisor, Prof. Betar Gallant, for her dedicated mentorship and unwavering support over the course of my graduate career. Her intellectual and personal generosity have pushed me to become a better researcher and a better person. I am grateful to her for taking the time to guide me and provide me with detailed and constructive feedback, which greatly improved the quality of my work. Betar has taught me to pursue scientific research with intellectual rigor, curiosity, creativity, and most importantly, integrity. Her positive and friendly demeanor always made for a nurturing environment in which I felt comfortable to fail, learn and grow. I will forever be inspired by her bold ideas and her willingness to take on tough, scientific problems with far-reaching societal impact. Being the first PhD graduate from her lab is a matter of great honor and responsibility – I hope I can do justice to all that I have learnt from her.
I am also deeply grateful to my thesis committee members, Prof. Ahmed Ghoniem and Prof. Fikile Brushett, for their guidance. This thesis is better for their insightful comments and their encouragement to push my research further into new directions. I thank them for being so generous with their time and intellect. I am also thankful to my collaborators, Prof. Lingling Zhao and her students, Lifu Yan, and Yuming Yin for carrying out the computational work in this thesis. I gratefully acknowledge Prof. Elsa Olivetti and Olivia Pfeiffer for our joint work on assessing the climate impact of metal CO2 batteries. I feel incredibly fortunate to have had
the chance to be part of such enriching and rewarding collaborations during my time at MIT. I would like to thank my former lab members, Christopher Mutty and Wenhui Tang, for their work on exploring the translation of our initial, model process to other electrolyte systems. I am deeply grateful to Dr. Mingfu He, not only for helping with experimental matters and for patiently answering all my chemistry and electrochemistry questions, but also for our many thought-provoking discussions on science, career paths and life.
I am also indebted to my current lab-family and my dream team – Haining, Gustavo, Rui, Aaron, Yu, Stefano, and Luc. Their sense of humor in the toughest of times, and their
sensitivity and encouragement at times when I doubted myself made so many stressful times bearable, even enjoyable. I will look back at the many memories we made both in and out of the lab – including our weekly group meetings, musical lab cleanings, our failed gym and barbecue plans etc. – and I know that they will always bring me joy. To all my lab mates, past and present: You all inspire me for your brilliance and your humanity. I couldn’t have asked for a better group of people to work with – I will miss you all dearly.
To my friends outside of MIT, thank you for giving my life balance, and for always showing up when it mattered most. Thank you to Ness for being the most extraordinary teammate and friend throughout my undergraduate and graduate years. Your calm and stable presence, and your dependable nature meant that I never had to worry about anything other than school, which is truly one of the greatest gifts I could have ever asked for. To Mahnum who has been my support system since my high school years: having you in Cambridge these past five years was like having a little piece of home. Thank you for being my advocate in both my personal and professional life. And of course, a special thanks to Roch, for always enlightening me with his DC adventures and making me laugh even in the toughest of circumstances.
And lastly, I want to thank my family for their unconditional love and support which has kept me afloat not only during my five years at MIT but my entire life. I am grateful to my parents for instilling in me the value of education since my early years, and my siblings, Shanzeh and Abdul Wasaay, for showing me what that means. My family has taught me, by example, to lead life with a sense of purpose, compassion and humility. Their sacrifices and endless dedication to helping me be the best version of myself has enabled everything. A special thank you to my brother-in-law Ahsan Bhai, my nephew Hamza, and my niece Zara for adding so much meaning and joy to my life. To my Hamzu and Zaru: You two are the brightest lights in my life. I hope I can make you proud.
Table of Contents
Abstract ... 3 Acknowledgements ... 8 List of Figures ... 15 List of Tables ... 31 Chapter 1: Introduction ... 34Executive Summary and Motivation ... 34
Carbon Dioxide: Primary Sources and Emissions ... 41
CO2 Electronic Structure as a Predictor of Reactivity ... 46
CO2 capture: Amine-based Chemisorption ... 47
1.4.1 Amine-CO2 chemistry ... 48
1.4.2 Thermal amine scrubbing ... 50
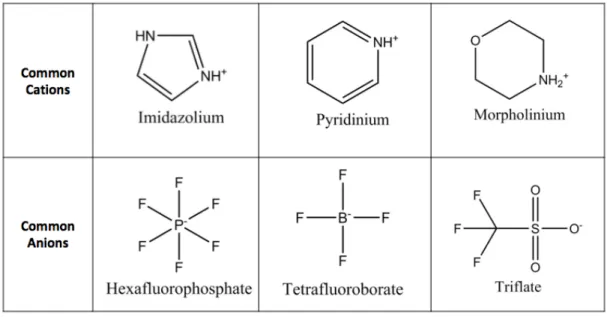
1.4.3 Ionic liquids for carbon capture ... 52
CO2 Utilization: Electrochemical CO2 Conversion ... 56
1.5.1 CO2-to-fuels approaches in aqueous media ... 56
1.5.2 CO2-to-solids approaches in non-aqueous media ... 60
Combined CO2 Capture and Electrochemical Conversion ... 65
Chapter 2: Amine-Mediated Electrochemical Mineralization of Post-Combustion CO2 in a Li-CO2 Battery ... 71
Introduction ... 71
Experimental Methods ... 74
Results and Discussion ... 79
2.3.1 Electrolyte screening: Amine and solvent selection ... 79
2.3.2 Products of CO2-loaded EEA with LiClO4 salt ... 82
2.3.3 Electrochemical activity of CO2-loaded EEA in DMSO electrolytes ... 91
2.3.4 Discharge product characterization ...101
2.3.5 Proposed discharge reaction...110
Chapter 3: Effect of Alkali Salts on Amine-Activated Electrochemical CO2 Conversion
in Non-aqueous Media ...116
Introduction ... 116
Experimental and Computational Methods ... 117
Results and Discussion ... 120
3.3.1 Equilibrium speciation of CO2-loaded EEA with varying salt compositions ....120
3.3.2 Effect of electrolyte salt on the electroactivity of CO2-loaded EEA ...134
3.3.3 Molecular dynamics simulations of the ion-pairing events under reaction conditions ...140
Conclusions ... 147
Chapter 4: Effects of Operating Temperature on Amine-Mediated CO2 Capture and Conversion in Li Cells ...149
Introduction ... 149
Experimental Methods ... 151
Results and Discussion ... 154
Conclusion ... 169
Chapter 5: Electrolyte Design for Amine-Facilitated Electrochemical CO2 Conversion in Non-aqueous Media ...172
Introduction ... 172
Experimental Methods ... 173
Results and Discussion ... 175
5.3.1 Effect of amine structure of electroactivity of chemisorbed CO2 ...175
5.3.2 Effect of solvent environment on electroactivity of chemisorbed CO2 ...185
Conclusions ... 191
Chapter 6: Electrolyte Selection Criteria for Electrochemical Conversion of CO2 in Aprotic, Li-CO2 Batteries ...193
Introduction ... 193
Experimental Methods ... 195
Results and Discussion ... 200
Chapter 7: Conclusions and Outlook ...225 References ...234
List of Figures
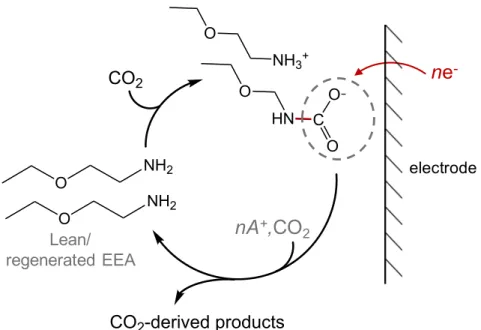
Figure 1-1: Electrochemical reduction scheme of the CO2 conversion pathway via selective
cleavage of the N-C bond (A+ = alkali cation). ... 38
Figure 1-2: Evolution of atmospheric CO2 concentration and global annual average
temperature with time. Figure by NOAA/NCDC. ... 42
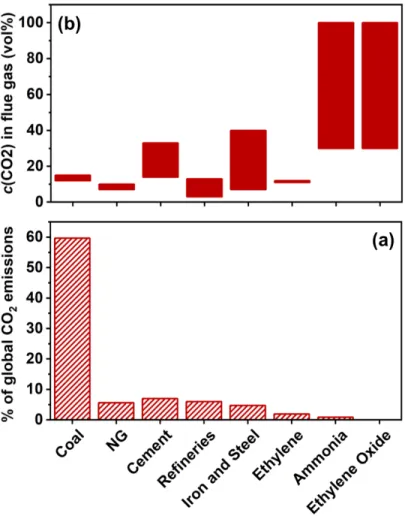
Figure 1-3: (a) Percentage contribution of various CO2-emitting processes to the global CO2
emissions. (b) Carbon dioxide concentrations (vol%) in flue gases emitted from various processes.32-33, 37 ... 45
Figure 1-4: The three resonance structures of the linear CO2 molecule. ... 46
Figure 1-5: Mechanism of carbamate formation from the chemical absorption of 1 mole of
CO2 by 2 moles of a primary amine, MEA via a zwitterion intermediate. ... 49
Figure 1-6: Formation of bicarbonate upon reaction of one mole of tertiary amine
dimethylaminoethanol (DMAE) with one mole of CO2 in water... 50
Figure 1-7: Schematic representation of a typical thermal amine scrubbing process. 52 ... 51
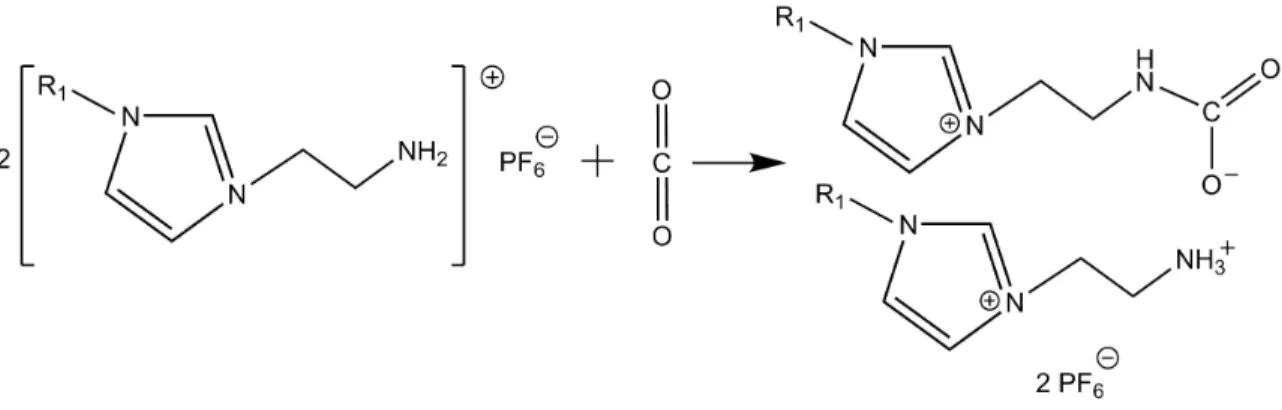
Figure 1-8: Reaction mechanism of chemical CO2 capture by an imidazolium-based
task-specific ionic liquid. ... 54
Figure 1-9: Reaction mechanism of chemical CO2 capture by an ionic liquid containing an
aprotic heterocyclic anion (here, pyrrolide is used as the AHA). Reproduced with permission from Ref. 70. ... 55
Figure 1-10: Possible avenues for utilizing electrochemical CO2 reduction products for the
industrial synthesis of fuels and chemicals. Reproduced with permission from Ref. 77. ... 57
Figure 1-11: Coulombic efficiency (%) for a wide range of CO2 reduction products on Cu as
a function of applied potential. Reproduced with permission from Ref. 14. ... 58
Figure 1-12: Schematic showing the difference between a conventional CO2 reduction
pathway and an ionic-liquid mediated CO2 conversion pathway. Reproduced with
permission from Ref. 84. ... 60
Figure 1-13: Schematic of a typical Li-CO2 battery employing a carbon cathode. ... 63
Figure 1-14: Schematic comparing (a) the classically employed CO2 conversion approach with
(b) the proposed approach in this work. ... 66
Figure 1-15: Integrated CO2 capture and electrochemical conversion using switchable polarity
solvents. Reproduced with permission from Ref 19. ... 67
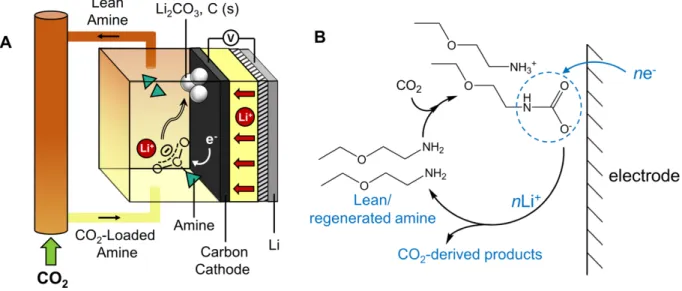
Figure 2-1: (a) Schematic of a combined capture-and-conversion Li-CO2 cell with amine
regeneration. (b) Discharge reaction scheme showing the target reduction pathway via selective cleavage of the N-C bond. ... 73
Figure 2-2: Schematic representation of a three-electrode electrolysis type cell. ... 77
Figure 2-3: 1H NMR of 0.1 M CO2-loaded EEA in 0.3 M LiClO4/DMSO-d6 before, and 24
hours after, exposure to PC-stabilized Li metal. ... 80
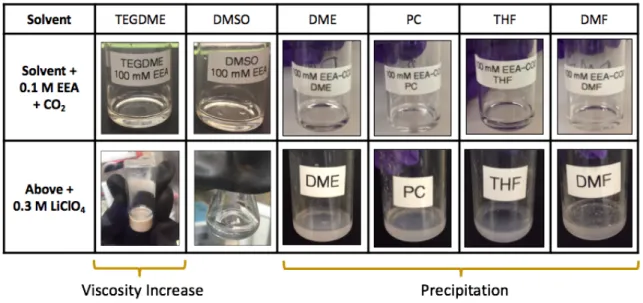
Figure 2-4: Photographs of (top row) solvent samples containing 0.1 M CO2-loaded EEA
species, and (bottom row) the same solutions upon introduction of 0.3 M LiClO4.
... 82
Figure 2-5: Reaction pathways showing the formation of (i) carbamic acid (requiring one
amine molecule / CO2) or (ii) ammonium carbamate (requiring two amine
molecules / CO2) upon CO2 uptake by a primary amine (here, EEA). ... 83
Figure 2-6: 1H NMR spectra of 50 mM EEA (bottom) and CO2-loaded EEA (top) in
Figure 2-7: Hydrogen-bonded interactions between the -COOH group of the carbamic acid
and S=O group of DMSO.9 ... 85
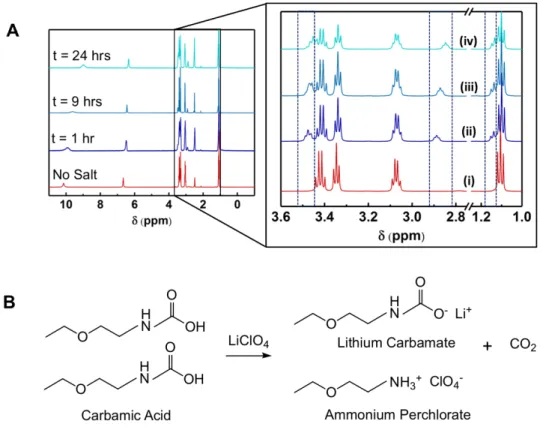
Figure 2-8: (a) Time-dependent 1H NMR spectra of a solution containing 50 mM CO
2-bound
EEA in DMSO-d6 before the addition of 0.3 M LiClO4 (i), and 1 hour (ii), 9 hours
(iii), and 24 hours (iv) after the addition of 0.3 M LiClO4. (b) Reaction scheme
showing conversion of carbamic acid to carbamate and a free CO2 upon Li+-salt
addition in DMSO... 86
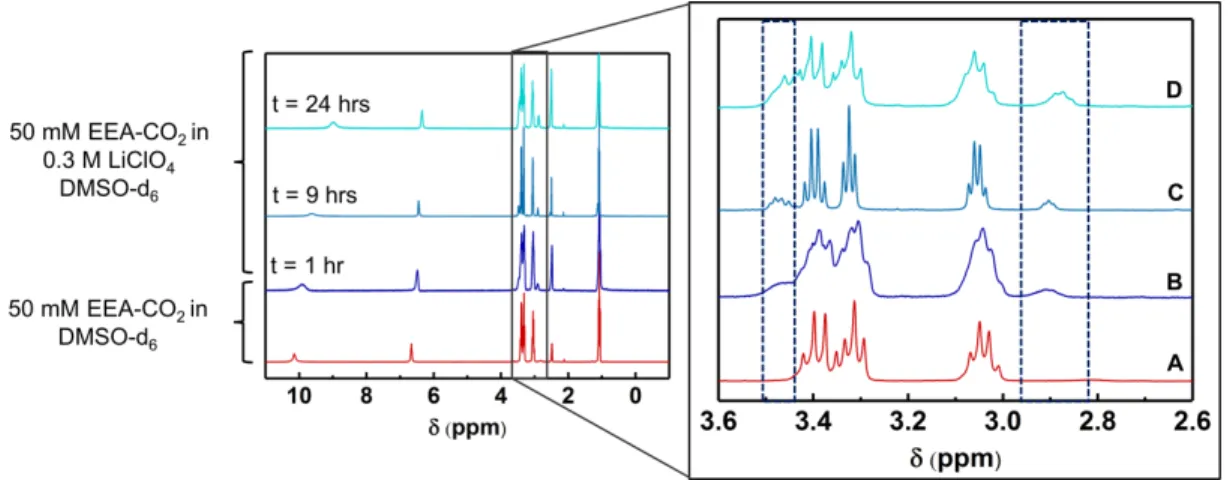
Figure 2-9: Time-dependent 1H NMR spectra of a solution containing (a) 50 mM CO
2-bound
EEA in DMSO, and (b)-(d) 0.3 M LiClO4/DMSO with added 50 mM EEA-CO2,
1, 9 and 24 hours, respectively, after addition... 87
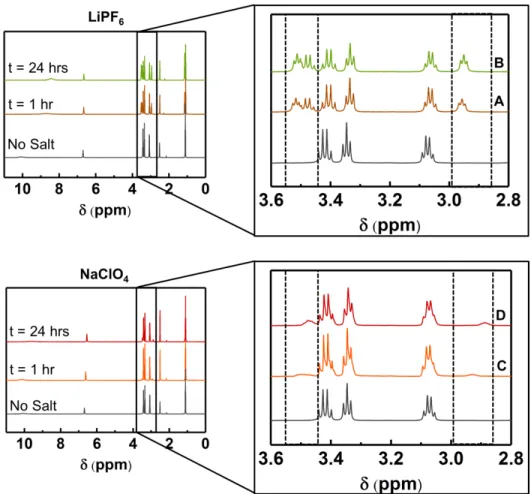
Figure 2-10: Time-dependent 1H NMR spectra of a solution containing 50 mM CO2-bound
EEA in DMSO-d6, (a) 1 hour and (b) 24 hours after the addition of 0.3 M LiPF6,
and (c) 1 hour and (d) 24 hours after the addition of 0.3 M NaClO4. The spectrum
of 50 mM EEA-CO2 in DMSO-d6 (no salt) is provided as a reference. ... 89
Figure 2-11: 1H NMR spectra of a solutions containing 50 mM CO
2-bound EEA in
DMSO-d6, 24 hours after the addition of 0.3 M LiPF6, 0.3 M NaClO4 or 0.3 M LiClO4. 90
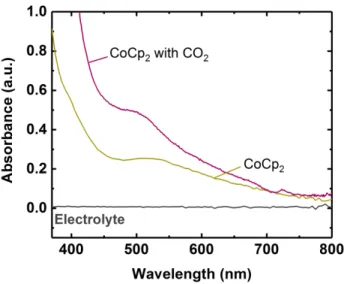
Figure 2-12: (a) UV-Visible spectra of 0.3 M LiClO4/DMSO containing CoCp2 and EEA in
the presence and absence of CO2. The spectra of CoCp2 and CoCp2+ are provided
as reference. (b) Photograph showing color changes upon addition of CoCp2 to the
electrolyte containing either lean EEA (right) or CO2-loaded EEA (center). A
solution containing CoCp2 and the electrolyte, not shown, yielded a color identical
to the one observed for CoCp2 with lean EEA. ... 91
Figure 2-13: UV-visible spectra of 0.3 M LiClO4/DMSO containing cobaltocene (CoCp2) and
physically dissolved CO2. ... 92
Figure 2-15: Typical open-circuit voltage (OCV) variation of a Li-CO2 cell during the resting
period prior to galvanostatic discharge. ... 94
Figure 2-16: (a) Discharge profiles of Li-CO2 cells at 10 mA/gc under Ar only, CO2 only
(physically dissolved, no EEA), lean (unloaded, no CO2) EEA in DMSO, and
loaded EEA-CO2 in DMSO. (b) Discharge profiles for cells containing 100 mM
EEA-CO2 at varying current densities. (c) and (d) Concentration effect of
EEA-CO2 on discharge potential and capacities for Li-CO2 cells discharged at 30 mA/gc.
... 95
Figure 2-17: Discharge profiles of Li-CO2 cells at 100 mA/gC and 200 mA/gC with loaded
EEA-CO2 in DMSO. ... 96
Figure 2-18: First reductive scans for 100 mM CO2-loaded EEA on a glassy carbon working
electrode from 3.0 V vs. Li/Li+. Scans were conducted at 0.2 mV/s at varying
rotation rates as indicated. ... 97
Figure 2-19: Typical discharge profile of Li-CO2 cell containing 100 mM CO2-bound EEA
under an Ar headspace at 10 mA/gc. ... 98
Figure 2-20: 13C NMR spectra of a solution containing 12CO2-loaded EEA upon the further
introduction of 13CO
2. ... 99 Figure 2-21: Cyclic voltammograms at 0.05 mV/s in Swagelok cells containing Ar-saturated
working electrolyte (‘Ar’, dashed trace), CO2-saturated working electrolyte (‘CO2
Only’), working electrolyte containing 100 mM EEA and CO2 (‘EEA-CO2’), and
working electrolyte containing 100 mM EEA only without CO2 (‘Lean EEA’). 99
Figure 2-22: (a) Electrochemical impedance spectroscopy of Li-CO2 cells with varying EEA
concentrations. The inset shows the solution resistances at the considered EEA concentrations (EIS: 10 mV perturbation from 1 MHz to 100 mHz at open circuit voltage). (b) Charge transfer resistance (RCT) and discharge potential at the
Figure 2-23: (a) X-ray diffraction of a GDL electrode discharged at 5.65 µA/cm2. The XRD
spectrum of crystalline Li2CO3, acquired from the International Center for
Diffraction Data (ICDD) database (Ref. code: 00-001-0996) is provided as a reference. (b) SEM images of a discharged Vulcan carbon cathode at 30 mA/gc.
The inset shows an SEM image of a pristine electrode. (c) ATR-IR (transmittance) spectra of a pristine electrode, and an electrode discharged at 30 mA/gc. (d) Ex-situ
mass spectrometer analysis measuring moles of CO2 evolved after discharged
electrode treatment with H3PO4 and Fenton’s reagent.151 The discharged Li-CO2
cell contained 13CO
2 and a 12C cathode. ... 102 Figure 2-24: XPS survey scan of a Ni electrode discharged at 5 µA/cm2. No nitrogen-derived
signal intensity (indicated by a dashed line) was observed... 103
Figure 2-25: Gas Chromatography measurements of (a) a calibration standard containing CO2,
H2, O2, and CO and (b) the headspace of a discharged Li-CO2 cell with LFP counter
electrode. The O2 detected in (b) is an artifact of manually injecting the gaseous
sample in the GC. ... 105
Figure 2-26: (a) 1H NMR of electrolyte before and after discharge. 1H NMR spectrum of lean
EEA is provided as a reference. (b) 1H NMR of electrolyte after discharge before
and after D2O addition. ... 106
Figure 2-27: (a) Galvanostatic discharge and charge profiles of a Li-CO2 cell cycled at a rate
of 30 mA/gc and to a limited capacity of 1000 mAh/gc. (b) FTIR spectra, and (c)
SEM images of the charged and discharged electrodes. ... 108
Figure 2-28: Galvanostatic discharge-charge cycles of Li-CO2 cells at 30 mA/gc to a limited
discharge capacity of (a) 500 mAh/gc and (b) 1000 mAh/gc. ... 109
Figure 2-29: Galvanostatic charging profiles at 30 mA/gc of a discharged electrode containing
Li2CO3 (Qdis =1699 mAh/gc, Idis = 30 mA/gc, ‘Discharged Electrode’), a pristine
carbon electrode charged directly in the working electrolyte containing EEA and CO2 (‘Electrolyte/EEA-CO2’), a pristine carbon electrode charged directly in
electrolyte containing lean EEA only (no CO2, ‘Electrolyte/Lean EEA’), and a
pristine carbon electrode in neat 0.3 M LiClO4/DMSO (‘Neat Electrolyte’). ... 110
Figure 2-30: (a) Galvanostatic discharge profile for Ni foam cathode discharged at 5µA/cm2.
(b) Raman spectra of unwashed, discharged Ni foam indicating an absence of carbon D and G bands at 1360 and 1580 cm-1. ... 111
Figure 3-1: Possible reaction pathways for CO2 capture by primary amines (here, EEA) in
organic solvents. ... 120
Figure 3-2: 1H NMR spectra of DMSO-d
6 containing 0.1 M EEA at one, five, 10, 20, 48 and
96 hours after CO2 uptake in the absence of an electrolyte co-salt. ... 121
Figure 3-3: 1H NMR spectra of DMSO-d
6 containing 0.1 M EEA-CO2 prior to, and one hour,
5 hours, 10 hours, and 20 hours after addition of 0.3 M LiTFSI. The highlighted features in the NMR spectra show the 1H resonances corresponding to the
ammonium cation that emerge post- alkali salt addition. ... 122
Figure 3-4: 1H NMR spectra of DMSO-d6 containing 0.1 M EEA-CO2, 48 hours and 96 hours
after addition of 0.3 M LiTFSI. Percent conversion of carbamic acid to Li carbamate, as determined from the above spectra, was calculated to be 49.9% and 50.0%, or within measurement error, after 48 hours and 96 hours, respectively. ... 123
Figure 3-5: (a) 1H NMR of DMSO-d6 electrolyte containing 0.1 M EEA-CO2, taken 20 hours
after the addition of 0.3 M LiY/DMSO (Y- = ClO4-, PF6-, or TFSI-) or 0.3 M AClO4
(A+ = Li+, Na+, K+). ... 124
Figure 3-6: Equilibrium proportion and concentration of alkali or TBA carbamate, as
determined by 1H NMR in Figures 2 and S2-5, as a function of time after salt
addition. The top three data sets correspond to the Li+ cation with either TFSI-,
PF6- or ClO4- anions, whereas all other cations (Na+, K+, TBA+) have ClO4- as the
Figure 3-7: 1H NMR spectra of DMSO-d
6 containing 0.1 M EEA-CO2 at one, five, 10, 20, 48
and 96 hours after addition of 0.3 M of (a) LiClO4 or (b) LiPF6. ... 126
Figure 3-8: 1H NMR spectra of DMSO-d
6 containing 0.1 M EEA-CO2 at one, five, 10, 20, 48
and 96 hours after addition of 0.3 M of (a) NaClO4, (b) KClO4, or (c) TBAClO4.
... 127
Figure 3-9: CO2 loading of solutions containing 0.1 M EEA-CO2 and either 0.3 M LiClO4 or
0.3 M KClO4, as measured via mass spectrometry 20 hours after salt addition.128
Figure 3-10: (a) Optimized structures of RNHCOOH and A+ (reactants) and RNHCOO-A+,
RNH3+, and CO2 (products) obtained via DFT post-geometry minimization (A+ =
Li+, Na+, or K+). (b) Free energy (DGr) and enthalpy (DHr) differences incurred
upon 2RNHCOOH + A+ → RNHCOO-A+ + RNH
3+ + CO2. All enthalpy and free
energy calculations were performed at T = 298 K and PCO2 = 1 atm. (c) N-C bond
lengths and O-C-O bond angles in carbamic acid (RNHCOOH) and alkali metal carbamates. ... 129
Figure 3-11: ATR-IR of DMSO-d6 electrolyte containing 1.5 M CO2–bound EEA and 2 M
AClO4 (A+ = Li+, Na+, or K+). ... 131
Figure 3-12: Electronic density distribution (LUMO) for (a) Li carbamate, (b) Na carbamate,
and (c) K carbamate. ... 133
Figure 3-13: (a) Geometry-minimized structure of Li carbamate, indicating the bonds most
significantly altered upon reduction. (b) Table showing a comparison of all C-C, C-O and N-C bond lengths in Li carbamate before and after the addition of an electron. ... 133
Figure 3-14: Galvanostatic discharge profiles at 20 mA/gc of Li-EEA-CO2 cells containing the
specified anion. ... 134
LiY/DMSO (Y- = ClO
4-, PF6-, or TFSI-) or (b) 0.3 M AClO4 (A+ = Li+, Na+, K+ or
TBA+). The top axis in Figure 3-15b displays the potential vs. Li/Li+ for the scan
corresponding to LiClO4 to facilitate comparison with galvanostatic results in Li
cells. The working electrode in all cases was a super P-coated glassy carbon electrode, and current densities were normalized to the glassy carbon geometric surface area (0.196 cm2). ... 135
Figure 3-16: Anion-dependent cyclic voltammograms. Uncorrected cyclic voltammograms at
1 mV/s in a 3-electrode cell containing 0.1 M EEA-CO2 and 0.3 M of either (a)
LiClO4, (b) LiPF6 or (c) LiTFSI. The background scans with Ar-saturated
electrolyte contained either lean EEA or CO2-only (no amine) electrolytes. Current
densities are normalized to the glassy carbon geometric surface area (0.196 cm2).
... 136
Figure 3-17: Cation-dependent cyclic voltammograms. Uncorrected cyclic voltammograms at
1 mV/s in a 3-electrode cell containing 0.1 M EEA-CO2 and 0.3 M of either (a)
LiClO4, (b) NaClO4, (c) KClO4, or (d) TBAClO4. The background scans with
Ar-saturated electrolyte containing either lean EEA (no CO2) or CO2 only-saturated
electrolytes (no EEA) are provided as a reference. The working electrode used in all cases was a super P-coated glassy carbon electrode. Current densities are normalized to the glassy carbon geometric surface area (0.196 cm2). ... 138
Figure 3-18: Current density-voltage (Tafel) profiles in CO2-saturated, DMSO-based
electrolytes containing 0.1 M EEA-CO2 and 0.3 M AClO4, where A+ = Li+, Na+,
K+. ... 139
Figure 3-19: First solvation shell structures for Li+ in (a) an unpaired configuration, with Li+
fully solvated by DMSO, and in (b) a paired configuration, with Li+
electrostatically coordinated to RNHCOO- following a simulation time of 80 ns.
(c) Coordination numbers of the alkali cation, A+, with DMSO (A+-O DMSO),
configurations. (d) Number of ion pairs (RNHCOO-A+) formed as a function of
computational time, out of a total of 20 possible pairs. ... 141
Figure 3-20: First solvation shell structures for Na+ and K+ in (a, c) the “unpaired”
configurations with the alkali cation fully solvated by DMSO; and (b, d) the “paired” configurations, with the alkali cation coordinated to EEACOO-. ... 142
Figure 3-21: A+-O
DMSO coordination number as a function of MD simulation time, with all
carbamates / alkali cations initialized in the “unpaired” configuration. ... 143
Figure 3-22: Potential of mean force (PMF) plots for the ion pairing (A+ - RHNCOO-) process
in DMSO. The x-axis position (r) denoted by represents the distance between the center of mass of A+ and -COO- at the transition state. The x-axis position (r)
denoted by represents the energy minimized distance between center of mass of A+ and mass center of -COO- upon the formation of the ion-paired alkali
carbamate. ... 145
Figure 4-1: Typical operating temperature ranges for a variety of CO2-emitting processes. 32, 190-191 ... 150
Figure 4-2: Discharge profiles of Li-CO2 cells containing 0.1 M EEA-CO2 in 0.3 M
LiClO4/DMSO at (a) 25 °C, (b) 4 0°C, (c) 50 °C, and (d) 60 °C over a range of
current densities (30 – 200 mA/gc). ... 154
Figure 4-3: Discharge profiles of Li-CO2 cells containing 0.3 M LiClO4/DMSO electrolyte
(no amine) at (a) 25°C, (b) 40°C, and (c) 50°C at 30 mA/gc. ... 155
Figure 4-4: Discharge capacity of Li-CO2 cells as a function of current density at varying
operating temperatures. ... 155
Figure 4-5: (a) Attenuated total reflectance infrared spectra of a pristine Vulcan Carbon
electrode, and electrodes discharged at 70 mA/gc at varying temperatures. SEM
Figure 4-6: (a) Ionic conductivity in neat electrolyte (0.3 M LiClO4/DMSO) and electrolyte
with 0.1 M EEA-CO2, and CO2 solubility in neat electrolyte as a function of
temperature. (b) Variable-temperature (VT) 1H NMR spectra of solutions
containing 50 mM CO2-loaded EEA in DMSO-d6 24 hours after the addition of
0.3 M LiClO4. (c) Equilibrium proportion of Li carbamate in the electrolyte, as
quantified from the 1H NMR spectra in (b), as a function of temperature. ... 158
Figure 4-7: (a) Room-temperature 1H NMR spectra of solutions containing 50 mM EEA-CO2
in 0.3 M LiClO4/DMSO-d6 after aging at the specified temperature for 24 hours.
(b) Zoomed-in room temperature 1H NMR spectra of the aforementioned solutions
after a 24-hour aging at 100°C and 130°C. ... 159
Figure 4-8: Room-temperature 1H NMR spectra of solutions containing 50 mM EEA-CO 2 in
DMSO-d6 (no Li+ salt) after aging at the specified temperature for 24 hours. .. 160
Figure 4-9: Room-temperature 1H NMR spectra of solutions containing 50 mM lean EEA (no
CO2) in 0.3 M LiClO4/DMSO-d6 after heating at the specified temperature for 24
hours. ... 160
Figure 4-10: Variable-temperature (VT) 1H NMR spectra of deuterated electrolyte containing
50 mM CO2-loaded EEA in DMSO-d6 that was first heated from 25°C (bottom) to
60°C (middle), and then was subsequently cooled back down to 25°C (top). ... 161
Figure 4-11: (a) Photographs of electrolyte containing 50 mM EEA-CO2 after 24-hour aging
at the specified temperatures in (i) the absence of, and (ii) the presence of PC-stabilized Li. (b) Room-temperature (RT) 1H NMR spectra of electrolytes from
Figure 4a(ii). Refer to Figure 4-6 for peak labels. (c) Room temperature discharge of Li-CO2 cells containing electrolyte with 0.1 M EEA-CO2 that had been
previously aged at the indicated temperature for 24 hours. ... 163
Figure 4-12: Photographs of electrolyte (0.3 M LiClO4/DMSO-d6) containing 50 mM
EEA-CO2 after 24-hour aging at (a) 80°C and (b) 100°C in the absence and presence of
Figure 4-13: ATR-IR spectra of a pristine Vulcan Carbon electrode, and electrodes discharged
at 50 mA/gc at room temperature using electrolytes that had been aged for 24 hours
at the indicated temperature. ... 165
Figure 4-14: Photographs showing solutions containing 0.1 M DIPA-CO2 in TEGDME before
(a), and after (b) the addition of 0.3 M LiClO4. ... 166
Figure 4-15: iR-corrected cyclic voltammograms at 1 mV/s in a 3-electrode cell containing
0.1 M DIPA-CO2 and 0.3 M LiClO4/TEGDME. The background scans with
Ar-saturated electrolyte containing either lean DIPA (no CO2) or CO2 only-saturated
electrolytes (no DIPA) are provided as a reference. The working electrode used in all cases was a super P-coated glassy carbon (GC) electrode. Current densities are normalized to the GC geometric surface area (0.196 cm2). ... 167
Figure 4-16: (a) Discharge profiles of Li-CO2 cells containing 0.1 M DIPA-CO2 in a
TEGDME-based electrolyte at 25°C and 70°C at 30 mA/gc. (b) Attenuated total
reflectance infrared (ATR-IR) spectra of a pristine Vulcan Carbon electrode, and electrodes discharged at 30 mA/gc at varying temperatures. ... 168
Figure 4-17: Discharge profiles of Li-CO2 cells containing 0.3 M LiClO4/TEGDME
electrolyte (no amine) at 25°C and 70°C at 30 mA/gc. ... 168
Figure 4-18: Photograph of Li metal anode post discharge with DIPA-CO2 in 0.3 M
LiClO4/TEGDME at 70°C. ... 169
Figure 5-1: (a) Schematic representation of a cell used for LFP charging. (b) Typical charging
profile of an initially fully-lithiated LFP cathode versus a Li metal anode in a carbonate electrolyte (1 M LiPF6 in EC/DMC). The LFP cathode area was 0.636
cm2. Adapted from Ref. 201. ... 175
Figure 5-3: Galvanostatic discharge profiles at 30 mA/gc of cells containing 0.1 M lean amine
(unloaded, no CO2). The supporting electrolyte was 0.3 M LiClO4/DMSO.
Adapted from Ref. 201... 179
Figure 5-4: 1H NMR spectra of (a) 0.1 M DIPA with and without CO
2 and (b) 0.1 M PP with
and without CO2 in DMSO-d6. ... 180
Figure 5-5: Reaction showing CO2 uptake by piperidine to form PP-CO2 adducts, which do
not contain an amide proton. ... 181
Figure 5-6: Ionic conductivities of CO2-loaded electrolytes as a function of amine
concentration for three different amine types (EEA, DIPA and PP). The supporting electrolyte used was 0.3 M LiClO4 in DMSO. Errors bars for these measurements
typically ranged from 0.005–0.020 mS/cm. Adapted from Ref. 201. ... 182
Figure 5-7: Comparison of capacitance- and iR-corrected linear sweep voltammograms at 1
mV/s in 3-electrode measurements with 0.1 M X-CO2 (X = EEA, DIPA, or PP) and
0.3 M LiClO4/DMSO. The working electrode in all cases was a super P-coated
glassy carbon electrode, and current densities were normalized to the glassy carbon geometric surface area (0.196 cm2). ... 185
Figure 5-8: Galvanostatic discharge profiles at 30 mA/gc of Li-CO2 cells containing 0.1 M
DIPA-CO2 and and 0.3 M LiClO4 in (a) DMSO, (b) TEGDME, and (c) PC.
Background discharge profiles under CO2 only (no amine) are provided in each
case... 189
Figure 5-9: Attenuated total reflectance infrared (ATR-IR) spectra of a pristine Vulcan Carbon
electrode, and electrodes discharged at 30 mA/gc with 0.1 M DIPA-CO2 in
DMSO-based and TEGDME-DMSO-based electrolytes. ... 190
Figure 5-10: SEM images of a Vulcan carbon cathode discharged with DIPA-CO2 at 30 mA/gc
in (a) DMSO and (b) TEGDME. The inset in (a) shows an SEM image of a pristine electrode. ... 190
Figure 6-1: Chemical structures of solvents investigated in this work. ... 201
Figure 6-2: (a) Galvanostatic discharge profiles at 30 mA/gc of Li-CO2 cells containing 1 M
LiCF3SO3 in the specified solvent. (b) Discharge capacity of Li-CO2 cells from
(a). (c) ATR-IR spectra of discharged electrodes. (d) Ionic conductivity and CO2
solubility in the varying solvents containing 1 M LiCF3SO3. ... 202
Figure 6-3: Background galvanostatic discharge measurements under argon at 30 mA/gc in
varying solvent environments. ... 203
Figure 6-4: SEM images of Vulcan carbon cathodes discharged at 30 mA/gc in (a) diglyme,
(b) triglyme and (c) TEGDME respectively. The inset in (a) shows an SEM image of a pristine electrode. ... 203
Figure 6-5: Photograph (a) and schematic (b) of the custom-built solubility apparatus used for
measuring the equilibrium concentrations of CO2 dissolved in electrolytes. .... 204
Figure 6-6: Background leak measurement and a typical pressure decay curve observed after
pressurizing the evacuated headspace of the reactor vessel containing 1 mL of electrolyte with CO2. ... 205
Figure 6-7: (a) Galvanostatic discharge at 45 mA/gc of Li-CO2 cells containing varying
concentrations of LiCF3SO3 in TEGDME. (b) Ionic conductivity and CO2
solubility as a function of LiCF3SO3 concentration. (d) Molar ratio of Li+ to
dissolved CO2 as a function of LiCF3SO3 concentration. (d)-(e) 13C NMR spectra
of 13CO
2 and (f) 13C chemical shifts of 13CO2 in TEGDME for varying
concentrations of LiCF3SO3 and TBACF3SO3. All peaks were referenced to the
internal solvent peaks. ... 206
Figure 6-8: Galvanostatic discharge at 45 mA/gc of Li-CO2 cells containing varying
concentrations of LiCF3SO3 in TEGDME. ... 207
Figure 6-9: (a) 13C NMR of CO
2-saturated electrolytes containing 1 M A+CF3SO3-/TEGDME
voltammograms at 1 mV/s from 3-electrode measurements. The top axis displays potential vs. Li/Li+ for the scan corresponding to LiCF
3SO3 to facilitate
comparison with prior galvanostatic results in Li cells. (c) Ionic conductivity and CO2 solubility in 1 M ACF3SO3/TEGDME. ... 209
Figure 6-10: Cyclic voltammograms at 1 mV/s in a 3-electrolde electrolysis type cell
containing Ar-saturated and CO2-saturated, TEGDME-based electrolyte with 1 M
LiCF3SO3. The working electrode used was a pristine glassy carbon. ... 210
Figure 6-11: Cyclic voltammograms at (a) 20 mV/s in a 3-electrolde electrolysis type cell and
(b) 0.5 mV/s in a two-electrode, Swagelok-type cell containing Ar-saturated and CO2-saturated, TEGDME-based electrolyte with 1 M LiCF3SO3. The working
electrodes used in (a) and (b) were a super P carbon-coated glassy carbon and a Vulcan carbon-coated Celgard, respectively. ... 211
Figure 6-12: Cyclic voltammograms at 1 mV/s in a 3-electrolde electrolysis type cell
containing CO2-saturated electrolytes composed of 1 M LiCF3SO3 in the specified
solvent. The working electrode used was a carbon Super P-coated glassy carbon. ... 212
Figure 6-13: Cyclic voltammograms at varying scan rates in a 3-electrolde electrolysis type
cell containing Ar-saturated and CO2-saturated, TEGDME-based electrolyte with
1 M LiCF3SO3. The working electrode used was a Super P carbon-coated glassy
carbon electrode. ... 213
Figure 6-14: Cyclic voltammograms at 1 mV/s in a 3-electrolde electrolysis type cell
containing Ar-saturated and CO2-saturated, TEGDME-based electrolyte with 1 M
(a) LiCF3SO3, (b) NaCF3SO3, (c) KCF3SO3 and (d) TBACF3SO3. The working
electrode used was a carbon super P-coated glassy carbon electrode. ... 214
Figure 6-15: (a) Galvanostatic discharge profiles at 45 mA/gc of Li-CO2 cells containing 1 M
LiY/TEGDME where Y = CF3SO3, PF6 ,or TFSI. (b) Ionic conductivity and CO2
Figure 6-16: Comparison of galvanostatic discharge profiles of Li-CO2 cells containing 1 M
LiPF6 and 1 M LiCF3SO3 in (a) DMSO, (b) PC, and (c) TEGDME. ... 217
Figure 6-17: Solvation structures of Li+ in (a) TEGDME, (b) DMSO, and (c) PC, and of (d)
Na+ and (e) K+ in TEGDME isolated from the MD simulations. (f) Desolvation
free energy of (i) Li+ as a function of solvent and (ii) varying alkali cations in
TEGDME. The shading roughly indicates the conditions in which CO2 is active.
(g) Average number of Li+ surrounding oxalate anions (C2O42-) as a function of
solvent. (h) MD snapshots showing contact-ion par formation in TEGDME with (i) PF6- and (ii) C2O42-. In (ii), three Li+ (purple spheres) were coordinated to a
typical C2O42-, showing local Li+ enrichment around the reduced CO2 intermediate.
... 219
Figure 6-18: Time-dependent variation in the number of Li+ ions in an ion-paired state
(constituting an interaction with either a PF6- or C2O42-) prior to (Configuration 1),
and post-addition of, a reduced CO2 intermediate (here, C2O42- ) (Configuration 2).
... 221
Figure 7-1: Li+-stabilized zwitterionic adduct formation upon CO
2 uptake by tertiary amine
functionalized ionic liquids. Reproduced with permission from Ref. 222. ... 227
Figure 7-2: System boundary of cradle-to-grave LCA analysis of metal-CO2 batteries. Figure
courtesy of Olivia Pfeiffer and Prof. Elsa Olivetti, Department of Materials Science and Engineering, MIT. ... 232
List of Tables
Table 1-1: Integrated chemical capture and electrochemical conversion of CO2 in a
DMSO-based electrolyte containing Li+-salt. ... 37
Table 1-2: Primary anthropogenic CO2 sources and their relative contributions to total CO2
emissions in the United States in 2018. ... 43
Table 1-3: Examples of primary, secondary and tertiary amines. ... 48
Table 1-4: Common cations and anions employed in ionic liquids used for CO2 capture.45 . 53
Table 1-5: Possible CO2 reduction reactions in aqueous media. The provided potentials have
all been measured on the copper electrode.80 The oxidation state of carbon is
denoted by O.S. in the above table. ... 57
Table 1-6: CO2 solubility in select organic solvents at 298 K and 1 atm. ... 61
Table 1-7: Possible CO2 conversion reactions in non-aqueous, lithium based systems. The
thermodynamic parameters associated with each reaction are provided. ... 62
Table 1-8: Mass densities of potential products that can be formed from the electrochemical
reduction of CO2 in either aqueous or non-aqueous media. The density for CO2 (l)
corresponds to T = 30℃ and P = 8 MPa.92... 62
Table 1-9: Li-CO2, Na-CO2 and Al-CO2 battery chemistries demonstrated in literature. *Note
that since thermochemical data for Al2(CO3)3 solid is not available, practical cell
voltages are used to calculate the “theoretical” energy density for the Al-CO2
Table 2-1: Comparison of absolute discharge capacity (Q), Q normalized by weight of active
carbon material (mAh/gC), and Q normalized by weight of EEA in the electrolyte
(mAh/gEEA) at select discharge rates. ... 97
Table 3-1: A comparison of the rate of ion-pair formation, 𝒓𝑰𝑷 (as estimated from Figure
3-19d) with the lifetime 𝜏IP, of A+-RNHCOO- ion pairs under dynamic conditions
and the timescale for a single electron transfer 𝜏𝐸𝑇, to an alkali carbamate. .... 143
Table 5-1: Summary of observations for solutions containing 0.1 M of the amine sorbent in
0.3 M LiClO4/DMSO post CO2 uptake. ... 178
Table 5-2: Photographs of CO2-loaded electrolytes containing varying concentrations of EEA,
DIPA and PP in 0.3 M LiClO4/DMSO. Photos marked with an asterisk (*) indicate
solutions where stable precipitates were observed upon CO2 uptake. Adapted from
Ref. 206. ... 183
Table 5-3: Physical properties of solvents investigated in this section. ... 186
Table 5-4: Photographs of electrolytes containing 0.1 M CO2-loaded amines (DIPA or PP) in
0.3 M LiClO4/X, where X = PC, TEGDME, or DME 24 hours after the addition
of CO2. Photo marked with asterisk (*) indicates solution where precipitation was
observed. ... 187
Table 6-1: Physical properties obtained from literature for solvents investigated in this work.
Chapter 1: Introduction
Executive Summary and Motivation
The negative environmental impact of rising CO2 emissions has underscored the need
for innovative approaches for CO2 management, which are crucial not only for developing
mitigation technologies to address sustainability challenges1-2 but also for enhancing our
scientific understanding of CO2 reactivity for the design of CO2-centric reactions. Past attempts
at developing CO2 mitigation approaches have been largely challenged by the significant
energy penalties required for CO2 activation and its subsequent conversion. Consequently,
considerable research efforts have been devoted to discovering novel methods to promote CO2
reactivity for realizing both chemical and electrochemical CO2 transformations, which include
chemical capture and/or electrochemical reduction to products. 3-6
Today’s state-of-the-art post-combustion carbon capture and sequestration (CCS) technologies employ amine-based chemical capture.7-8 In such systems, typical products
formed upon CO2 uptake by primary or secondary amines include ammonium carbamate (1:2
loading of CO2 per amine) and/or ammonium bicarbonate (1:1 loading of CO2 per amine), the
relative quantities of which at equilibrium can vary greatly with the solvent as well as conditions such as amine concentration, temperature and CO2 partial pressure.9-10 The most
extensively developed amine-based CCS systems typically utilize aqueous solutions containing 30 wt% of monoethanolamine (MEA) to spontaneously bind CO2.7 The overall
capture-release cycle is however extremely energy-intensive, consuming up to 30% of the power generating capacity of the plant in order to release CO2 and thermally regenerate the
compressed and stored long-term, which adds additional energetic penalties and poses potential safety risks.
An attractive alternative to geological CO2 sequestration downstream of capture is the
electrochemical conversion of CO2 to value-added fuels (reduced hydrocarbons such as CH4,
alcohols such as CH3OH, or syngas such as CO/H2) or chemicals in aqueous media.2 The
kinetic limitations of the process however are severe, such that the reactions must be driven at high overpotentials (> 1 V) to suppress the parasitic H2 evolution reaction (HER) and obtain
significant yields and selectivity towards highly reduced products.12-14 In search of alternative
end-uses for CO2, researchers in the battery community have recently begun investigating CO2
utilization as a reactant gas in non-aqueous energy storage devices such as Li-CO2 batteries.
In such a scheme, CO2 is electrochemically converted, upon discharge, to products such as
mineralized carbonates, carbon monoxide, and/or carbon when used with a lithium (Li) or sodium (Na)-based anode and organic electrolyte. At present, however, Li-CO2 batteries face
numerous technical challenges including high charging voltages, and poor chemical reversibility particularly on uncatalyzed, carbon cathodes. Furthermore, the large kinetic barriers associated with electron transfer to CO2 however,15 have presented significant hurdles
such that most standard battery electrolytes have reported little or no reduction activity for CO2. 16,32
In order to address the above challenges, this thesis explores new strategies to promote room-temperature CO2 reactivity in organic media with the ultimate goal of developing
integrated chemical CO2 capture and electrochemical conversion systems. Combined carbon
capture-conversion approaches, which employ chemisorbed CO2 as the reactant for subsequent
utilization of CO2 due to their ability to bypass the central bottleneck of conventional carbon
capture and sequestrations (CCS)– namely, the highly energy-intensive sorbent regeneration and CO2 separation between the capture and utilization steps.6, 17-20
Furthermore, the use of non-aqueous solvents as capture-conversion in this work also offer several advantages. Firstly, they afford the possibility of reacting CO2 with highly
reducing alkali/alkaline earth metals and extracting the energy released during the CO2
conversion process as electricity. Secondly, their wide voltage window enables access to a wide energetic landscape for accessing activity and the lack of protons limits the available reaction pathways (including suppression of parasitic hydrogen evolution reaction (HER)) which makes reaction characterization relatively simpler. Lastly, non-aqueous CO2 conversion
enables sequestration of the captured CO2 as a densely packed, environmentally benign solid.
This end-state is not only logistically more feasible because it requires less storage space, but also eliminates the costs and safety risks associated with long-term geological storage of compressed CO2.
Chapter 2 presents a proof of concept demonstration of such an integrated CO2 capture
and electrochemical conversion process within a non-aqueous, Li-CO2 electrochemical cell. In
this first model system, CO2 capture is accomplished in a nonaqueous, dimethyl sulfoxide
(DMSO)-based electrolyte containing an amine sorbent (2-ethyoxyethytlamine (EEA)) and an exogenous Li+-salt, and the conversion reactions occur at an inexpensive, catalyst-free carbon
electrode. Amines are typically used for CO2 capture in aqueous environments, and therefore
a significant aspect of this work explores translation of amine chemistry to nonaqueous (aprotic) electrolytes, specifically those containing electrolyte salts. In neat DMSO (no co-salt), CO2 uptake by EEA resulted in the preferential formation of carbamic acid (Reaction 1
in Table 1-1). Subsequent inclusion of the salt, however, induced conversion of all carbamic acid to lithium carbamate (Reaction 2). We found that the lithium carbamate, and not the carbamic acid, was intrinsically electroactive, exhibiting reduction activity at high potentials
CO2 capture in neat DMSO: 2RNH2 + 2CO2 → 2RNHCOOH (1)
Salt-induced re-speciation: 2RNHCOOH + Li+ → RNHCOO-Li++RNH
3+ + CO2 (2)
Net capture step: 2RNH2 + CO2 + Li+ → RNHCOO-Li+ + RNH3+ (3)
Electrochemical conversion
step:
RNHCOO-Li+ + RNH3+ + 2CO2 + 3Li+ + 4e- →
2Li2CO3 + C + 2RNH2
(4)
Net capture-conversion
reaction: 3CO2 + 4Li+ + 4e- → 2Li2CO3 + C (5)
Table 1-1: Integrated chemical capture and electrochemical conversion of CO2 in a
DMSO-based electrolyte containing Li+-salt.
of ~2.8 V vs. Li/Li+, compared to physically dissolved CO
2, which is inactive in the amine’s
absence.21 Importantly, the discharge reaction was found to proceed through selective -N-C-
bond cleavage, forming CO2-derived, solid-phase Li2CO3 as the primary discharge product and
yielding high discharge capacities (>1,000 mAh/gc). Meanwhile, the amine remained in solution, capable of further CO2 uptake. The overall electrochemical reaction occurred
according to Reaction 4, in which the amine-bound CO2, as RNHCOO-, played the central role
as the electroactive species (Figure 1-1). Our results suggested that the product lean amine (2RNH2) could undergo limited turnovers (<10) by re-binding CO2, yet ultimately became
Figure 1-1: Electrochemical reduction scheme of the CO2 conversion pathway via selective
cleavage of the N-C bond (A+ = alkali cation).
This system however, while promising, exhibits several challenges. First, the rate of the formation of the active species upon CO2 introduction is sluggish (several hours), and the
subsequent electrochemical steps also exhibit sluggish kinetics such that the discharge reaction at room-temperature only occurs at low rates (< 100 mA/gc). Moreover, much remained to be
understood about the mechanism of the formation of the “active” electrochemical state; the factors that govern its emergence and electrochemical properties; and how this might be manipulated for performance improvement for higher reaction rates. Therefore, in Chapter 3, we investigate the essential role of individual electrolyte salt constituents (across multiple cations and anions) in chemical and electrochemical reactions in amine-CO2 electrolytes.
While the anion appears to have minor effect, the cation is found to strongly modulate the thermochemistry of the amine-CO2 through electrostatic interactions: 1H NMR measurements
show that post-capture, pre-reduction equilibrium proportions of the formed cation-associated NH2 O NH2 O NH3+ O HN O CO2 CO2-derived products C O O electrode ne -nA+,CO 2 Lean/ regenerated EEA
→ Na+ → Li+). This trend is quantitatively supported by DFT calculations of the free energy of
formation of these alkali-associated adducts. Upon electrochemical reduction, however, the current densities follow an opposing trend, with enhanced reaction rates obtained with the lowest Lewis-acidity cation, K+. Meanwhile, molecular dynamics simulations indicate
significant increases in desolvation and pairing kinetics that occur with K+. These findings
suggest that, in addition to strongly affecting the speciation of amine-CO2 adducts, the cation’s
pairing with –COO- in the amine-CO
2 adduct can significantly hinder or enhance the rates of
electrochemical reactions at moderate overpotentials. Consequently, designing electrolytes to promote fast cation-transfer appears important for obtaining higher current densities in future systems.
In Chapter 4, we investigate the effect of operating temperature on the discharge of chemically-captured CO2 in Li-CO2 batteries to evaluate the potential of such technology to
integrate with practical CO2 capture needs in the industrial or power-generating sectors. Our
results indicate that compared to room-temperature operation, typical capture temperatures (40−60°C) can notably improve the discharge kinetics of chemisorbed CO2, leading to higher
discharge capacities and improved rate capability. Through experimental and spectroscopic methods, we find that in addition to improving the transport properties of the electrolyte, higher temperatures also favor increased formation rates of the active reactant species (Li carbamate). This not only results in a higher equilibrium population of electroactive Li carbamate, but also increased rates of carbamate formation under electrochemical conditions which is critical for high rate operation. Despite of these improvements, however, elevated temperatures were also found to promote parasitic side reactions between the anode and electrolyte, which can mask attainable gains in performance especially in the low rate regime. Collectively, these results
highlight the importance of developing improved combinations of amine-modified electrolytes and anode materials to realize optimum performance of combined capture-conversion in Li-CO2 batteries at practical capture temperatures.
Chapter 5 explores the effect of varying the amine sorbent and solvent environment
on the electroactivity of chemisorbed CO2. While the amine’s type (primary vs. secondary) and
structure (cyclic vs. aliphatic) appear to have a minor effect on the reduction of amine-CO2
adducts, the solvent plays a significant role in facilitating or suppressing discharge activity of chemisorbed CO2. Even though future experimental and computational investigations are
required to fully rationalize these amine- and solvent-dependent trends in electroactivity, these initial results serve to highlight that the amine-based CO2 capture-conversion process
developed herein is transferrable to other amine- and solvent- systems, opening a large design space for developing improved electrolytes.
In addition to developing an integrated CO2 capture and electrochemical conversion
process in amine-modified, non-aqueous electrolytes, this thesis also delves deeper into understanding CO2 reactivity and the discharge reaction mechanism in conventional Li-CO2
batteries, which operate based on the following full cell reaction: 4Li + 3CO2 → 2Li2CO3 + C.
While the vast majority of recent studies on Li-CO2 batteries have focused on identifying new
catalysts/electrode materials to improve the rechargeability of the battery, considerably little attention has thus far been devoted to developing fundamental understanding of the CO2
discharge reaction mechanisms. Intriguingly, we have observed from past literature has shown that nearly all reports of Li-CO2 batteries utilize tetraethylene glycol dimethyl ether
(TEGDME)-based electrolytes containing either 1 M lithium trifluoromethanesulfonate (LiCF3SO3)22-23 or 1 M lithium bis(trifluoromethanesulfonyl)imide (LiTFSI)24-25 salts, leading
to a hypothesis that they are uniquely active for CO2 discharge.Therefore, in Chapter 6, we
study the effect of electrolyte composition (solvent, along with concentration and identity of the salt cation) on the discharge activity of CO2 on catalyst-free, high surface area (60-100
m2/g) carbons to examine whether this is the case. The results indicate that TEGDME-based
electrolytes containing moderate concentrations of Li+ salts (roughly within 0.7–2 M
examined herein) are most conducive to CO2 activation, especially compared to DMSO and
propylene carbonate-based electrolytes. Through electrochemical, spectroscopic and computational methods, we determine that glymes have lower desolvation energies for Li+
compared to other solvent candidates, whereas high salt concentrations increase local density of Li+ surrounding CO2 and reduction intermediates. These attributes collectively increase
availability of Li+, crossing a threshold necessary to support its activation. Discharge voltage
and reaction rates are also sensitive to the alkali cation, further invoking its key role in enabling or suppressing reactivity.
Carbon Dioxide: Primary Sources and Emissions
Carbon dioxide (CO2) is one of the most potent greenhouse gases, accounting for close
to 81.3% of anthropogenic greenhouse gas (GHG) emissions in the United States in 2018.26
Atmospheric CO2 concentrations have increased by ~ 46%, from 280 parts per million by
volume (ppmv) in the pre-industrial times to 409 ppmv in 2018.27 Meanwhile, the average rate
of global temperature change has risen from 0.06℃ per decade in 1880 to 0.16℃ per decade in 1970, a nearly three-fold increase (Figure 1-1).28 This increase in average global
of the atmospheric carbon dioxide concentration,29 and is expected to have dire consequences
on humans, wildlife, and the environment.
Figure 1-2: Evolution of atmospheric CO2 concentration and global annual average
temperature with time. Figure by NOAA/NCDC.
In order to reduce the risk and impacts of climate change, both federal and international efforts are calling for increased mitigation of GHGs, and countries around the world are reaching consensus to regulate CO2 emissions. Internationally, 183 nations and the European
Union have ratified the Paris Agreement as of 2019 (established within the United Nations Framework Convention on Climate Change (UNFCC)), which aims to limit the global temperature rise to less than 2℃ above pre-industrial levels this century and to undertake more aggressive efforts to restrict the temperature rise even further to 1.5℃.30 In the U.S., the
Environmental Protection Agency (EPA) established the New Source Performance Standards (NSPS) under the Clean Air Act in 2016 to restrict CO2 emissions generated from coal- and
In light of such rigidly enforced emission standards worldwide, the need for the development of effective CO2 mitigation technologies that can curb emissions and meet stringent regulations
has become crucial.
Table 1-2: Primary anthropogenic CO2 sources and their relative contributions to total CO2
emissions in the United States in 2018.
Table 1-2 lists some key sources of anthropogenic CO2 emissions in the U.S. in 2018.
Fossil fuel combustion accounted for 93.7% of total CO2 emissions in the U.S., of which the
electricity generations and transportation sectors were key emitters. The electric power sector alone was responsible for emitting 1752.8 MMT of carbon dioxide.1 In addition to fossil fuel
combustion, cement and iron and steel production are some of the world’s largest industrial sources of carbon dioxide, accounting for ~7% and 4.7%, respectively, of all CO2 emissions
globally.32 In the United States alone, these industries combined released a of total of 83 MMT
of CO2 (42.7 MMT CO2 from iron and steel and 40.3 MMT CO2 from cement).1 Cement
production releases large quantities of carbon dioxide into the atmosphere as a result of both the high energy consumption of the cement making process and the chemical process itself.1
In the iron and steel industry, the vast majority of CO2 emissions originate from the production
Primary Sources of CO2 Emissions (%)
Fossil Fuel Combustion • Electricity Generation • Transportation
92.7 34.8
35.7
Iron, Steel and Coke Production 0.8
Natural Gas 0.6
Cement Production 0.7
of iron from iron ore (rich in iron oxides and other impurities) in a blast furnace.33 This process
typically involves the use of elemental carbon as a reductant, which releases CO2 as a
by-product.
Mitigation of CO2 emissions can be achieved primarily by (i) reducing the consumption
of fuels, (ii) improving the efficiency of power plants, industrial facilities, and motor vehicles that generate CO2 as a by-product, or (iii) capturing anthropogenic CO2 at point of use.34
Theoretically, (i) can be accomplished by reducing the energy demand and shifting to alternative energy sources like solar, wind, and nuclear. Practically however, the transition to aforementioned alternative energy sources is difficult because these sources are not as abundant and cheap as fossil fuels such as coal. Furthermore, energy storage solutions to combat the intermittency of renewables currently do not meet the cost, safety, and cycle and calendar life criteria required for grid-scale storage.35 Option (ii), if pursued for coal-fired
power plants, is estimated to cut CO2 emissions from coal but only by about a mere 10-20%.36
Capturing CO2 at point sources, as mentioned in (iii), remains the only feasible pathway which
allows simultaneous reduction of CO2 emissions and use of existing infrastructure to fulfill
energy-related demands.34
Since CO2 emission sources are vast in both number and nature, it is important to note
that feasible targets for technological mitigation approaches are primarily stationary point emitters where flue gases are emitted in concentrated streams and are thus easier to capture. The primary constituents of flue gas, following removal of toxic air pollutants (e.g.: NOx, SO2,
Figure 1-3: (a) Percentage contribution of various CO2-emitting processes to the global CO2
emissions. (b) Carbon dioxide concentrations (vol%) in flue gases emitted from various processes.32-33, 37
H2S etc.) are N2, CO2, O2 and water vapor.38 Carbon dioxide concentrations in flue gases vary
widely depending on the types of fuel and combustion conditions used (Figure 1-3). In the power generation sector, flue gases from coal and natural gas combustion are typically dilute, containing 12-15 vol% CO2 and 3-4 vol% CO2 respectively. In the industrial sectors, flue gas
composition is largely process-dependent. Cement production emits waste gas streams with 14-33 vol% CO2 whereas iron and steel production generates flue gases with 20-44 vol%
CO2.39 Specialty industrial processes — such as hydrogen and ammonia production, natural
gas processing, synthetic fuel (coal-to-liquid (CtL)) production, and ethylene oxide synthesis — on the other hand release highly concentrated CO2 waste gas streams containing up to 100
vol% CO2.37 It is worth noting that even though high purity CO2 off-gas producing industrial
processes account for only 6% of total CO2 emissions by all industrial sources combined, high
concentration CO2 streams are particularly appealing targets for carbon-capture based
demonstration projects.40
CO
2Electronic Structure as a Predictor of Reactivity
CO2 is a linear, non-polar molecule containing carbon in its highest oxidation state, and
is therefore extremely thermodynamically stable (∆𝐻23 = −393.52 kJ/mol). Despite its chemical inertness however, CO2 possesses an electronic structure that presents several targets
for reactivity. Possible reaction sites on the CO2 molecule include (1) the electrophilic carbon
atom, (2) the 𝜋-electron density of the double bonds, or (3) the lone pair of electrons on the oxygen atoms (Figure 1-4).41
Figure 1-4: The three resonance structures of the linear CO2 molecule.
To determine which of these three characteristic properties of the CO2 molecule is most
likely to enhance its reactivity, the electronic structure of the CO2 molecule can be compared