HAL Id: hal-01849808
https://hal.archives-ouvertes.fr/hal-01849808
Submitted on 26 Jul 2018
HAL is a multi-disciplinary open access
archive for the deposit and dissemination of
sci-entific research documents, whether they are
pub-lished or not. The documents may come from
teaching and research institutions in France or
abroad, or from public or private research centers.
L’archive ouverte pluridisciplinaire HAL, est
destinée au dépôt et à la diffusion de documents
scientifiques de niveau recherche, publiés ou non,
émanant des établissements d’enseignement et de
recherche français ou étrangers, des laboratoires
publics ou privés.
A new diagram for amino acids: User study comparing
rainbow boxes to Venn/Euler diagram
Jean-Baptiste Lamy
To cite this version:
Jean-Baptiste Lamy. A new diagram for amino acids: User study comparing rainbow boxes to
Venn/Euler diagram. Information Visualization, Jul 2018, Salerno, Italy. �hal-01849808�
A new diagram for amino acids:
User study comparing rainbow boxes to Venn/Euler diagram
Jean-Baptiste Lamy
LIMICS, Université Paris 13, Sorbonne Université, Inserm, 93017 Bobigny, France Email: [email protected]
Figure 1. Rainbow boxes diagram displaying 8 properties of the 20 amino acids.
Abstract—Euler diagrams are commonly used for visualizing small datasets, especially in biology. A well-known example is the diagram of amino acid properties. However, Euler diagrams are not always easy to read for students, and they are complex to produce when the number of sets is above 6. Other approaches exist for set visualization, such as rainbow boxes, but they have not been evaluated properly yet. In this paper, we propose a new diagram for amino acids, using rainbow boxes. We present a crossover user study that compares the new diagram with the usual Euler diagram (often miscalled “Venn diagram”). 78 students in biology were recruited; they responded to questions using the diagrams. We show that rainbow boxes lead to half the error rate (p value = 0.013) and also performed significantly better in terms of response time and user preference. We also explore the possibility of enriching the amino acid diagram with additional information, beyond the 8 properties commonly presented. We discuss the limitations of each technique.
Keywords-Set visualization, User study, Euler diagram, Rain-bow boxes, Amino acids, Bioinformatics, Education.
I. INTRODUCTION
Set visualization [1] considers several elements and sev-eral sets containing all or part of these elements. The sets are overlapping, i.e. an element can belong to more than one set. The visualization aims at showing clearly the element-set membership relations but also at providing answers to more complex questions, such as finding the intersection of two sets, and to elicit new insights, such as discovering similarities between elements or sets.
Euler and Venn diagrams are commonly used to visualize sets when the dataset is small, especially in biology. A widely known example is the Euler diagram of amino acid
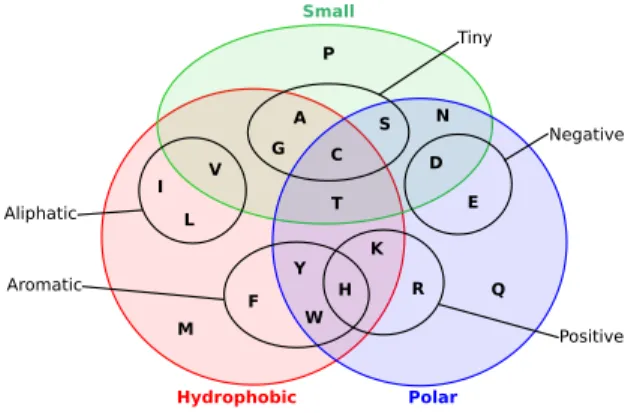
properties (known as “the Venn diagram of amino acid” despite the fact that it is actually an Euler diagram, Figure 2). In this example, each amino acid is an element and each property is a set (e.g. the set of small amino acids). There are 8 sets and 20 elements. This diagram is present in almost all textbooks and courses in molecular biology and bioinformatics (including the ones of the author), and a Google search yields more than 300,000 results (“Venn|Euler diagram amino acid”, on 13/3/2018). However, Euler and Venn diagrams are not always easy to read. In our teaching experience, students often have difficulties to understand and use Figure 2. Other authors mentioned that, in general, Venn diagrams are “not effective for presentation of more than four categorical groups” [2].
Recently, we introduced a new technique for visualizing overlapping sets, rainbow boxes [3], [4], which was initially applied to the visual comparison of drug properties [5]. In rainbow boxes, the elements are shown in columns, and the sets are represented by rectangular boxes placed below col-umn headers (see example in Figure 1). Each box covers the columns corresponding to the elements belonging to a set. The column order is computed using a heuristic optimization algorithm. This algorithm tries to order the columns so as the elements belonging to each set are contiguous. When it is not possible to have them contiguous for a given set, “holes” are present in the set’s box (in Figure 1, the polar box has 3 holes). Colors are added to columns and boxes, as follows: a specific color is associated with each column, ranging across the spectrum, and the color of a box is the mean of the colors (in Red-Green-Blue coordinates) of the
I L V M H W Y F K R D E Q T A C G S P N Small Hydrophobic Polar Aliphatic Negative Positive Tiny Aromatic
Figure 2. Euler diagram displaying 8 properties of the 20 amino acids (known as “the Venn diagram of amino acid”).
columns it covers. Finally, boxes are stacked vertically, with the largest boxes at the bottom. Two boxes can be next to each other, as long as they do not occupy the same columns. However, the evaluation data of rainbow boxes are rather sparse.
The work presented here has two objectives: (1) to propose an improved diagram for the presentation of the properties of amino acids, based on rainbow boxes, and (2) to evaluate this diagram and to compare it to Euler diagram. This user study involved 78 students in biology and followed a crossover protocol. We measured error rate, response time and user preference. We also discuss the limitations of the two types of diagrams, such as the ability to enrich the existing diagram with additional properties.
The rest of the paper is organized as follows. Section II presents related works. Section III explains how were pro-duced the diagrams for the user study. Section IV describes the experimental design of the user study. Section V gives the results of the study. Section VI explores the possibilities to enrich the amino acid diagram with additional properties. Section VII discusses the results, proposes perspectives.
II. RELATED WORKS
A. Set visualization
Alsakallah et al. [1] reviewed the techniques for over-lapping set visualization. Euler and Venn diagrams are one of the oldest approaches to set visualization [6]. In Euler diagrams, each set is represented by a closed-area. The areas overlap in various regions that represent the intersections of the sets. Venn diagrams are a kind of Euler diagrams showing all the 2n− 1 possible combinations of overlaps (where n is the number of sets). A proportional Euler or Venn diagram is a diagram in which the size of the various areas and overlaps is proportional to the number of elements in each regions. The automatic drawing of Euler and Venn diagrams is still a challenge when the number of sets is above 6 [7].
Linear diagram is another diagram for set visualization [8]. In a linear diagram, the elements are displayed in
columns and the set in rows. A piece of horizontal line is drawn in each cell at the intersection of an element that belongs to a set. Thus, a set is represented by one or more horizontal lines. Colors are usually added to identify the lines that correspond to a given set. Although not initially inspired by linear diagrams, rainbow boxes can be seen as an evolution of linear diagrams. The main difference between the two diagrams is that, in rainbow boxes, a set is represented by a box, which is a single visual object. In case of holes, the pieces of the box are connected by a small line. On the contrary, in linear diagram, a set is represented by several, independent, visual objects: a label and one or more lines. This has two important consequences. First, in rainbow boxes, several boxes can be placed next to each other, leading to a more compact diagram. Second, in rainbow boxes, there are three “free” visual variables that can be used to represent additional information: height, color and texture. In a previous work, we explored the use of the box height as a visual variable [9]. Rainbow boxes have a default color scheme that facilitates the discovery of similarities between sets, however, the color can also be set manually. The use of texture (hatches) will be demonstrated in section VI. On the contrary, the choice of visual variables in linear diagrams is more limited: texture and height can hardly be applied to a line, and color is already used to identify the sets.
B. Amino acid properties
Amino acids [10] are the building blocks for peptides and proteins. There are 20 major amino acids, each of them shares a common part, containing an amine and a carboxyl functional groups, and involved in the peptide bond. The various amino acids differ in their side chain, which is specific to each amino acid. Each side chain exhibits different physical and chemical properties, such as size, electric charge or hydrophobicity. The properties of amino acids are usually represented using a Euler diagram (Figure 2), which is the results of the Taylor classification [11]. The diagram was generated using Multi-Dimensional Scaling (MDS).
Few alternatives to Euler diagram have been proposed for comparing amino acids, and they are often not as informative or as easy to read. Nagano et al. [12] proposed a dendrogram, showing the similarity and the distance existing between each pairs of amino acids. It was computed from the amino acid substitution scores. The dendrogram displays the proximity between amino acids, but it does not show explicitly the properties of each amino acid. Kosiol et al. [13] also proposed to classify amino acids according to replacement rate, using a Markov process.
III. THE TWO DIAGRAMS
In the Euler diagram (Figure 2), we used the usual position for each amino acid. We added colors on the diagram,
# Category # Question Right answer
Set
A
(Warm-up) 1 Click on the small and aliphatic amino acid Valine (V) 1 Membership 2 Is Valin (V) polar? No 2 Count 5 How many tiny amino acids are there? 4
3 Intersection 6 Click on the aromatic and positive amino acid Histidine (H) 4 Disjoint 3 Click on the tiny and positive amino acid None 5 Inclusion 4 Are all small amino acids polar ? No
Set
B
(Warm-up) 1 Is Cysteine (C) small? Yes 1 Membership 2 Is Tyrosine (Y) hydrophobic? Yes 2 Count 5 How many positive amino acids are there? 3
3 Intersection 3 Click on the small and negative amino acid Aspartate (D) 4 Disjoint 4 Click on the aromatic and aliphatic amino acid None 5 Inclusion 6 Are all aromatic amino acids hydrophobic ? Yes
Table I
THE12QUESTIONS WITH THE CORRECT ANSWERS. QUESTION#S INDICATE THE ORDER OF THE QUESTIONS IN THE SET.
in order to make it more appealing and to have a fair comparison with (colored) rainbow boxes.
We previously proposed a rainbow boxes diagram for amino acids [4]. The diagram we present here (Figure 1) has been improved on four points. First, we replaced the 3-letter codes for amino acids by the more common 1-letter codes. Second, the 8 properties commonly presented in the Euler diagram were considered. Third, colors and contrasts were improved. Fourth, we also improved the order of the amino acids. In order to produce a diagram with the lowest possible number of holes in the boxes, the optimal column order must be found. This is a combinatorial optimization problem. The complexity of the problem is O(n!), where n is the number of columns. For amino acids, there are 20 columns, thus there are 20! ' 2.43 × 10¹⁸ possible orders. All possible orders cannot be tested, even on a fast computer. The previously published rainbow boxes diagram was produced using the heuristic algorithm we proposed [4]. It had three holes, one in the “small” box and two in the “polar” box.
For improving the column order, we first used a brute-force algorithm on subsets of the amino acid dataset to verify that no order exists that leads to fewer than 3 holes. The 3 holes are caused by the interaction between the following sets of boxes : { small, tiny, polar, hydrophobic }, { small, polar, hydrophobic } and { positive, aromatic, polar, hydrophobic }. Second, we searched for a column order that would place the three holes in the same box. The presence of holes in a box makes this box more difficult to perceive, consequently, it is better to have all holes in the same box. Moreover, some set visualization tasks involve several boxes, for example for searching for the intersection of two sets. By having all holes in a single box, we avoid the most complex situation for this task, i.e. the situation where the two considered boxes have holes.
We used the Artificial Feeding Birds (AFB) metaheuristics [14] for optimizing the column order, and we minimized the triplet (b, h, l) where b is the number of boxes with at
least one hole, h is the number of holes and l is the total length of holes. We considered a lexicographic order when comparing two triplets (b, h, l) and (b0, h0, l0), e.g. (2, 5, 11) was considered as lower (i.e. better) than (2, 7, 9). We found a column order with three holes in a single box, the “polar” one (Figure 1, corresponding to b = 1, h = 3 and l = 8).
IV. EXPERIMENT DESIGN
A. Recruitment
78 biology students were recruited at University Paris 13, at two levels: third year of bachelor degree (B3, 56 students) and first year of master (M1, 22 students). Most of them were female; this is usual in biology courses in France. The study was performed during the course of bioinformatics. Students were not aware that the study will take place at this moment, and all present students were included in the study. Students passed the study during 5 sessions (3 for B3 + 2 for M1 students). Students were told that the objective of the study was to compare two diagrams, but not that the Euler diagram is a well-established diagram and that rainbow boxes are a new “challenger” diagram. B3 students were “naive” subjects, i.e. they were not exposed to Euler diagram yet. On the contrary, M1 students have more diverse origins, and some of them might have already seen the Euler diagram in previous years. All students were new to rainbow boxes.
B. Protocol
The study was anonymous and no personal information was recorded (such as age or sex). We used a crossover protocol in which each student tested both diagrams, and thus can be his own control. For each diagram, the student had to reply to several questions related to amino acids, using the diagram. We recorded the error rate and the response time.
Two sets of similar questions, A and B, were defined. Five categories of tasks were considered, corresponding to typical tasks in overlapping set visualization: membership (does
#1 Eu RB #2 Eu RB #3 Eu RB #4 Eu RB #5 Eu RB 0.00 0.05 0.10 0.15 0.20 B3−Eu B3−RB M1−Eu M1−RB 0.00 0.02 0.04 0.06 0.08 0.10 0.12
Figure 3. Bar charts showing the error rates with each diagram (Eu : Euler diagram, RB : rainbow boxes) for each category of question (#1-5, left) and user (B3 or M1, right). ● ● ● ● ● ● ● ● ● ● ● ● ● ● ● ● ● ● ● ● ● ● ● ● ● ● ● ● ● ● ● ● ● ● ● ● ● ● #1 Eu RB #2 Eu RB #3 Eu RB #4 Eu RB #5 Eu RB 0 20 40 60 80 ● ● ● ● ● ● ● ● ● ● ● ● ● ● ● ● ● ● ● ● ● ● ● ● ● ● ● ● ● ● ● ● ● ● ● ● B3−Eu B3−RB M1−Eu M1−RB 0 20 40 60 80
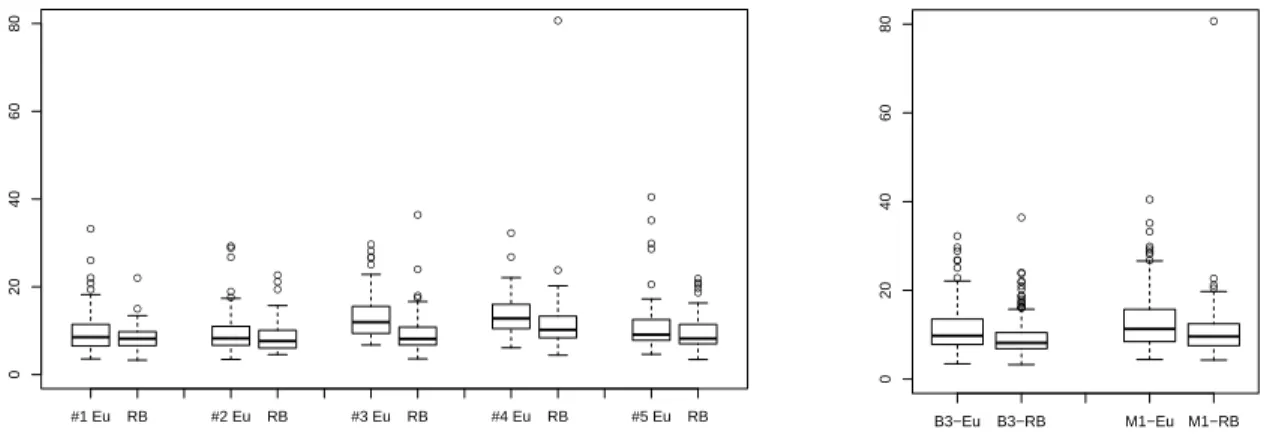
Figure 4. Box plots showing the response time for each diagram (Eu : Euler diagram, RB : rainbow boxes) and each category of question (#1-5, left) and user (B3 or M1, right).
element X belong to set Y?), count (how many elements are there in set Y?), intersection (what are the elements in both set Y and set Z?), disjoint (are set Y and set Z disjoint?) and inclusion (is set Y included in set Z?). For each category, we defined two questions, one in each set A and B. In addition, a “warm-up” question was added at the beginning of each set; the results of these questions were not taken into account during analysis. In each set, questions were ordered so as consecutive questions do not refer to the same properties. Table I shows the 12 questions and their order.
Students were randomly divided in two groups, with 39 students in each group (28 B3 + 11 M1). The first group had the Euler diagram for the questions in set A and the rainbow boxes for questions in set B, and the second group had the rainbow boxes for questions in set A and the Euler diagram for the questions in set B. Thus, both groups had the same questions in the same order, but not with the same diagram. Finally, there was a last question, asking the student about his preferred diagram, with three possible choices: Euler diagram, rainbow boxes, or no opinion.
C. Software
A dynamic website was developed for the study, imple-mented in Python 3. The website was responsible for the
randomization in the two groups. The first page of the website presented briefly the objective of the study. The second page presented the first diagram (depending on the group in which the user was randomized). The 6 following pages corresponded to the 6 questions of set A, with the associated diagram. Then the second diagram was presented, followed by the 6 questions of set B. When the response to a question was an amino acid, students had to click on the right amino acid in the diagram, and a “none” button was also available. When the response was a number of a Boolean, student had to choose the response from a set of predefined values (with 2 possible values for Boolean and 7 for numbers). Finally, the last page asked the question related to user preference. The website was in charge of collecting error rates and response times.
D. Statistical analysis
Statistical analysis was performed using R software ver-sion 3.3.2 [15]. The significance threshold was set at α = 0.05. Error rates were compared with Fisher’s exact test and Global Linear Model (GLM), considering the following factors: diagram (Euler or rainbow boxes), question category (1-5, see table I) and user category (B3 or M1). Response times were log-transformed to normalize the distribution.
They were analyzed with Welch Two Sample T test and ANalysis Of VAriance (ANOVA), using the same three factors. User preference was analyzed Chi-squared test.
The raw data and the statistical analysis in R can be downloaded at the following address:
http://www.lesfleursdunormal.fr/static/_downloads/amino_acid_user_study.zip
V. EXPERIMENT RESULTS
All students performed the entire study and responded to all questions. We collected 390 responses with each diagram. 38 errors were recorded with the Euler diagram (error rate 9.7%, 95% confidence interval: 6.8 - 12.7) and 19 with rainbow boxes (error rate 4.9%, 2.8 - 7.0). This difference is significant (p value = 0.013, Fisher exact test). The analysis with Global Linear Model (GLM) showed that there were significant relationships between error rate and two factors: the diagram used and the question category. On the contrary, no significant relationship was found with the user category factor (B3 or M1), i.e. B3 and M1 students did not make a significantly different number of errors.
The analysis of error rates per category of question and per diagram (figure 3, left) shows that rainbow boxes led to fewer errors for all categories but # 5 (inclusion). Category #5 was the most error-prone category of question, with both diagrams, and the number of errors in this category was the same for both diagrams. The analysis of error rates per category of user and per diagram (figure 3, right) shows that B3 and M1 students had a similar global error rate. Both categories of user made fewer errors with rainbow boxes, but the difference was more accentuated for M1 students.
The mean response time was 11.57 seconds (95% confi-dence interval: 11.02 - 12.12) with Euler diagram vs 9.63 seconds (9.10 - 10.16) with rainbow boxes. This difference is significant (p value < 10−6, Welch two sample T test performed on log(time)). The analysis of the variance of response times (ANOVA) showed that the three factors were highly significant (diagram, category of question, category of user), and that there was no interaction between them. The analysis of response time per category of question and per diagram (figure 4, left) shows that rainbow boxes led to faster response times for all categories of question. The analysis of response time per category of user and per diagram (figure 4, right) shows that both B3 and M1 students responded faster with rainbow boxes.
19 students preferred the Euler diagram, while 51 pre-ferred rainbow boxes (the 8 others indicated no opinion). We noted several comments that the students spontaneously made orally after the evaluation session. Many students commented on their preference for rainbow boxes or (more rarely) for Euler diagram. One student stated that the Euler diagram was more complex at the beginning, but then “we deal with it”. Another student mentioned the fact that rainbow boxes were easy to read because the boxes were
rectangular while the closed areas in the Euler diagram were rounded.
VI. ENRICHING THE DIAGRAM
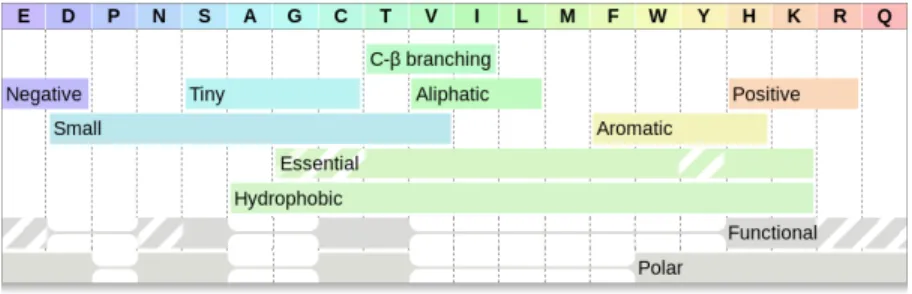
In this section, we investigate the possibility to enrich the rainbow boxes diagram with additional amino acid proper-ties. Figure 5 shows an enriched rainbow boxes diagram, with 3 additional properties: C-β branching, essential and functional. C-β branched amino acids contain two non-hydrogen substituents attached to their C-β carbon. This property was proposed by Betts et al. [16], but not visualized in a diagram.
Essential amino acids [17] cannot be synthesized by Human cells. This is an important property in the nutrition field. Semi-essential amino acids (G, C and Y) can be synthesized, but not in sufficient quantity; they are displayed with hatches in the diagram. On figure 5, the similarity between the “hydrophobic” and the “essential” boxes is striking. The relation between amino acids hydrophobicity and essentialness has already been described [18]. But rainbow boxes made it clear that almost all hydrophobic amino acids are essential, excepted one, alanine (A). Notice how the box colors enhance this similarity: the two boxes have almost the same, light green, color.
Functional amino acids are those frequently involved in interaction with non-protein compound. The data presented here are based on the values computed by Holm et al. [19]. The authors computed a score for each amino acid, expressed as a real number. The score is positive if the amino acid tends to participate in non-protein interaction more than average, and negative otherwise. In the rainbow boxes, we used a plain box for amino acid whose score is superior or equal to 0.1, and a hatched box for amino acid whose score is superior or equal to 0.05 (but inferior to 0.1). Rainbow boxes clearly shows that all functional amino acids are polar. This is sounding, because many non-protein interactions involve ions or other polarized molecules.
VII. DISCUSSION AND CONCLUSION
In this paper, we presented an improved diagram for amino acid properties based on rainbow boxes, and we compared the ability of biology students to answer questions using the proposed diagram versus the traditionally used Euler diagram. The evaluation results show that the students made significantly fewer errors with the new diagram, they responded significantly faster, and they preferred it. Results were similar between bachelor and master students. We also proposed an enriched diagram with three additional properties. Consequently, the new rainbow boxes diagram of amino acid properties could be used in textbooks and courses, in complement (or instead) of the usual Euler diagram. High-definition images of the new amino acid diagram can be downloaded at the following address, in
Figure 5. Enriched rainbow boxes diagram displaying 11 properties of the 20 amino acids.
various languages (English, French, German, Spanish) under the CC-BY license:
http://www.lesfleursdunormal.fr/static/_downloads/amino_acids.zip
A. User study
The user study showed that inclusion was the most error prone type of question, for both diagrams. This is quite surprising, because Euler diagrams are known to be efficient for visualizing inclusions. However, rainbow boxes performed equally well in terms of the number of errors (figure 3, left). The rectangular aspect of rainbow boxes was mentioned by a student as a reason that makes them easier to read than the Euler diagram. This argument is confirmed by a recent study that shows that horizontal and vertical lines are better perceived than diagonal ones [20].
We used colors in rainbow boxes. Nevertheless, colors are not essential for the reading of the diagram, and therefore a colorless rainbow boxes diagram is still possible whenever colors are not available (e.g. for black-and-white printing or for color-blind persons).
B. Euler diagramsvs rainbow boxes
Compared to Euler diagrams, rainbow boxes are easier to generate automatically. In previous works, we proposed methods for producing diagrams up to 20-25 elements (using the heuristic algorithm) or 50-100 elements (using the AFB metaheuristic); the number of sets have little impact on the optimization problem and is rather limited by the height of the screen. On the contrary, the automatic drawing of Euler diagrams is a challenge above 6 sets; Simonetto et al. proposed a method that can produce an Euler diagram with 60 sets [21] but the resulting diagram is complex. Rainbow boxes also seem to be able to present larger dataset (as we seen in section VI when enriching the amino acid diagram). C. Perspectives
Students were enthusiasts and they considered the eval-uation like an exercise. They asked for consulting their personal results, and especially to be able to see in which questions they made errors. However, our evaluation website was not providing this feature. Students found interesting to learn about amino acids properties, but also to learn how to use Euler diagrams and rainbow boxes. A perspective of this
work is to transform our evaluation software into a training software.
Venn diagrams are quite frequent in the biomedical field. In bioinformatics, Venn diagrams are used for comparing several gene lists. Two typical examples are the comparison of the genes common between several species, and the comparison of the genes found as differently expressed using several methods (e.g. microarrays vs next-generation sequencing (NGS), or microarray data analyzed with various software). Proportional Venn diagrams have also been used in medicine, for presenting proportional classifications of phenotypic subgroups for a given disease. For instance, several such diagrams have been proposed for obstructive lung diseases and Chronic Obstructive Pulmonary Disease (COPD) [22] and Behçet’s disease-related manifestations [23]. All these applications are potential perspectives for rainbow boxes.
REFERENCES
[1] B. Alsallakh, L. Micallef, W. Aigner, H. Hauser, S. Miksch, and P. Rodgers, “Visualizing sets and set-typed data: State-of-the-art and future challenges,” in Eurographics conference on visualization (EuroVis), 2014, pp. 1–21.
[2] A. Shade and J. Handelsman, “Beyond the Venn diagram: the hunt for a core microbiome,” Environ Microbiol, vol. 14, no. 1, pp. 4–12, 2012.
[3] J. B. Lamy, H. Berthelot, and M. Favre, “Rainbow boxes: a technique for visualizing overlapping sets and an application to the comparison of drugs properties,” in International Conference Information Visualisation (iV), Lisboa, Portugal, 2016, pp. 253–260.
[4] J. B. Lamy, H. Berthelot, C. Capron, and M. Favre, “Rainbow boxes: a new technique for overlapping set visualization and two applications in the biomedical domain,” Journal of Visual Language and Computing, vol. 43, pp. 71–82, 2017. [5] J. B. Lamy, H. Berthelot, M. Favre, A. Ugon, C. Duclos, and
A. Venot, “Using visual analytics for presenting comparative information on new drugs,” J Biomed Inform, vol. 71, pp. 58–69, 2017.
[6] Baron ME, “A note on the historical development of logic di-agrams: Leibniz, Euler and Venn,” The Mathematical Gazette, vol. 53, no. 384, pp. 113–125, 1969.
[7] Rodgers P, “A survey of Euler diagrams,” Journal of Visual Languages and Computing, vol. 25, no. 3, pp. 134–155, 2014. [8] Gottfried B, “Set space diagrams,” Journal of visual
lan-guages & computing, vol. 25, no. 4, pp. 518–532, 2014. [9] J. B. Lamy and R. Tsopra, “Translating visually the reasoning
of a perceptron: the weighted rainbow boxes technique and an application in antibiotherapy,” in International Conference Information Visualisation (iV), London, United Kingdom, 2017, pp. 256–261.
[10] Wu G, “Amino acids: metabolism, functions, and nutrition,” Amino Acids, vol. 37, no. 1, pp. 1–17, 2009.
[11] WM Taylor, “The classification of amino acid conservation,” J Theor Biol, vol. 119, no. 2, pp. 205–218, 1986.
[12] N. Nagano, M. Ota, and K. Nishikawa, “Strong hydrophobic nature of cysteine residues in proteins,” FEBS Lett, vol. 458, no. 1, pp. 69–71, 1999.
[13] C. Kosiol, N. Goldman, and N. H. Buttimore, “A new criterion and method for amino acid classification,” J Theor Biol, vol. 228, no. 1, pp. 97–106, 2004.
[14] Lamy JB, Advances in nature-inspired computing and ap-plications. Springer, 2018, vol. under press, ch. Artificial Feeding Birds (AFB): a new metaheuristic inspired by the behavior of pigeons.
[15] R team development core, R: A language and environment for statistical computing, Vienna, Austria, 2008.
[16] M. J. Betts and R. B. Russell, Bioinformatics for geneticists, 2003, ch. Amino acid properties and consequences of subsi-tutions, pp. 289–316.
[17] M. C. Aristoy and F. Toldra, Handbook of analysis of active compounds in functional foods, 2012, ch. Essential amino acids, pp. 3–24.
[18] Widyarani, Y. W. Sari, E. Ratnaningsih, J. P. M. Sanders, and M. E. Bruins, “Production of hydrophobic amino acids from biobased resources: wheat gluten and rubber seed proteins,” Appl Microbiol Biotechnol, vol. 100, no. 18, pp. 7909–20, 2016.
[19] L. Holm and C. Sander, “Decision support system for the evolutionary classification of protein structures,” Proceedings. International Conference on Intelligent Systems for Molecular Biology, vol. 5, pp. 140–6, 1997.
[20] Burch M, “A user study on judging the target node in partial link drawings,” in International Conference Information Visu-alisation (iV), London, United Kingdom, 2017, pp. 199–204. [21] P. Simonetto, D. Auber, and D. Archambault, “Fully auto-matic visualisation of overlapping sets,” Computer Graphics Forum, vol. 28, no. 3, pp. 967–974, 2009.
[22] E. Marsh S, J. Travers, M. Weatherall, V. Williams M, S. Aldington, M. Shirtcliffe P, L. Hansell A, R. Nowitz M, A. McNaughton A, B. Soriano J, and W. Beasley R, “Propor-tional classifications of COPD phenotypes,” Thorax, vol. 63, no. 9, pp. 761–7, 2008.
[23] A. Dinc, A. Bayir, I. Simsek, H. Erdem, S. Pay, and M. Turan, “The proportional Venn diagram of Behçet’s disease-related manifestations among young adult men in Turkey,” Clin Exp Rheumatol, vol. 23, no. 4 Suppl 38, pp. S86–90, 2005.