Publisher’s version / Version de l'éditeur:
Canadian Journal of Civil Engineering, 11, 1, pp. 74-81, 1984-03
READ THESE TERMS AND CONDITIONS CAREFULLY BEFORE USING THIS WEBSITE. https://nrc-publications.canada.ca/eng/copyright
Vous avez des questions? Nous pouvons vous aider. Pour communiquer directement avec un auteur, consultez la première page de la revue dans laquelle son article a été publié afin de trouver ses coordonnées. Si vous n’arrivez pas à les repérer, communiquez avec nous à PublicationsArchive-ArchivesPublications@nrc-cnrc.gc.ca.
Questions? Contact the NRC Publications Archive team at
PublicationsArchive-ArchivesPublications@nrc-cnrc.gc.ca. If you wish to email the authors directly, please see the first page of the publication for their contact information.
NRC Publications Archive
Archives des publications du CNRC
This publication could be one of several versions: author’s original, accepted manuscript or the publisher’s version. / La version de cette publication peut être l’une des suivantes : la version prépublication de l’auteur, la version acceptée du manuscrit ou la version de l’éditeur.
Access and use of this website and the material on it are subject to the Terms and Conditions set forth at
Estimation of the mass of large snow avalanches
Schaerer, P. A.; Fitzharris, B. B.
https://publications-cnrc.canada.ca/fra/droits
L’accès à ce site Web et l’utilisation de son contenu sont assujettis aux conditions présentées dans le site LISEZ CES CONDITIONS ATTENTIVEMENT AVANT D’UTILISER CE SITE WEB.
NRC Publications Record / Notice d'Archives des publications de CNRC:
https://nrc-publications.canada.ca/eng/view/object/?id=8b8f8c1d-5dac-45db-9199-0d2e810fa86c https://publications-cnrc.canada.ca/fra/voir/objet/?id=8b8f8c1d-5dac-45db-9199-0d2e810fa86cSer
'
N21d
no.
1159
1
National Research
Conseil national
C. 2
Council Canada
de recherches Canada
BLDG
I
1
ESTIMATION OF THE MASS OF LARGE SNOW AVALANCHES
by
Peter A. Schaerer and B. Blair Fitzharris
-
ANALYZED
Reprinted from
Canadian Journal of Civil Engineering
Vol. 11, 1984,
p.7 4 - 8 1
DBR Paper No.
1159
Division of Building Research
T h i s paper, w h i l e b e i n g d i s t r i b u t e d i n r e p r i n t form by t h e D i v i s i o n of B u i l d i n g Research, remains t h e c o p y r i g h t of t h e o r i g i n a l p u b l i s h e r . It s h o u l d n o t be reproduced i n whole o r i n p a r t w i t h o u t t h e p e r m i s s i o n of t h e p u b l i s h e r . A
l i s t
of a l l p u b l i c a t i o n s a v a i l a b l e from t h e D i v i s i o n may be o b t a i n q d by w r i t i n g t o t h e P u b l i c a t i o n s S e c t i o n , D i v i s i o n of B u i l d i n g R e s e a r c h , N a t i o n a l R e s e a r c h C o u n c i l ofC a p ' - -
----
L ---A---
K I A
0R6.- -- - -
74
Estimation of the mass of large snow avalanches'
PETER A. SCHAERER
Division of Building Research, National Research Council Canada, 3904 West 4th Avenue, Vancouver, B . C . , Canada V6R IP5
AND
B. BLAIR FITZHARRIS
Department of Geography, University of Otago, Box 56, Dunedin, New Zealand
Received May 3 1 , 1983
Revised manuscript accepted October 3, 1983
The mass of avalanches was investigated using two series of observations made at Rogers Pass in Western Canada. Large avalanches occur once in 3-25 years at each avalanche path, and their mass greatly exceeds that of annual maximum avalanches. Standard extreme-value frequency distributions cannot be applied. An empirical predictive equation for the mass of large avalanches is presented that takes into account the 30-year maximum water equivalent of the snow in the avalanche path, surface area of the catchment, and incline of the starting zone. Observed avalanches with an apparent return interval of
100 years or greater had masses close to the predicted values.
Keywords: snow avalanches, mass, frequency, design.
La masse des avalanches a CtC CtudiCe ii I'aide de deux sequences d'observation a Rogers Pass dans I'Ouest canadien. Les grandes avalanches se produisent avec une frkquence de 3-25 ans dans chaque chemin d'avalanche; leur masse est de beaucoup sup6rieure ii celle de l'avalanche maximale annuelle. Les fonctions de rkpartition classiques des valeurs extremes ne peuvent &tre utiliskes. Une Cquation empirique de prevision de la masse des grandes avalanches est prksentke; elle prend en compte I'kquivalent maximal en eau d'une frkquence trentenaire de la neige sise dans le chemin d'avalanche, I'aire du bassin et l'inclinaison de la zone gknkratrice. Les avalanches observkes dont la Nriode de recurrence apparente est de 100 ans ou plus ont une masse voisine de celle prkdite.
Mots-cle's: avalanche de neige, masse, frkquence d'apparition, design.
[Traduit par la revue]
Can. 1. Civ. Eng. 11, 74-81 (1984)
Introduction distances (Korner 1980; Perla et al. 1980; Bakkehoi
When roads, railways, ski lifts, buildings, power- e t al. 1981).
lines, or bridges are planned in areas exposed to snow Other advantages of using mass in the analysis of avalanches, questions arise about maximums to be ex- avalanche flow are that the amount of snow available on pected and how frequently they will occur. Estimating a given slope can be determined from Precipitation the size and return period of a design avalanche is records and that it is independent of changes in snow somewhat similar to predicting the magnitude and fie- density and free-water content during descent. The quency of floods. ~~~l~ of motion latter is significant because large avalanches often con- treated them as fluids, with flow height and discharge tain snow when start but Or wet
rate the major characteristics of motion. ~h~ impli- in the lower part of the slope owing to frictional heating cations of snow strength were not taken into con- Or higher ambient
sideration. Because of its strength, however, snow can A few terms referring terrain need to be accumulate, be released suddenly, and move in a large defined. An avalanche path is the specific area in which concentrated mass that passes through a given cross avalanches move regularly. It is subdivided into starting
section of its path in 10-20 s. F~~ this reason mass zone where snow breaks away and accelerates, run-out
rather than flow characteristics seems to be an appropri- or deposition zone where snow decelerates and comes ate measure of avalanches. Recent studies have recog- to rest, and track, the transition zone between the two. nized this fact by introducing mass as an independent The combined areas of starting zone and track are re- variable in calculations of avalanche speeds and run-out ferred as the catchment area.
'The material of the paper was presented at the Inter- Formation of large avalanches
national Snow Science Workshop on October 21 -23, 1982 at Avalanches begin when a layer of snow, known as a Bozeman, Montana. snow slab, is dislodged from its surroundings by failure
I
SCHAERER AND FITZHARRlS 75
Methods of estimating mass-frequency relations
a.
- . ,..
T R I G G E R, . . . / l e . a . . B L O W I N G S N O W 1
H I G H S T R E N G T H S N O W '
\
DEEP U N S T A B L E S N O W
/
'
I N THE T R A C K
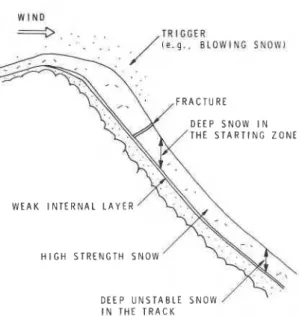
FIG. 1. Profile of avalanche slope with factors contributing to large avalanches.
in shear and tension. As the snow slab moves downhill it may gain mass by setting in motion additional snow in the lower reaches. Thus, large avalanches require a combination of conditions (Fig. 1): (1) an internal thin snow layer of low strength (most common are layers of buried surface hoar or a weak interface between old and new snow), (2) deep snow overlying the low-strength layer (this layer is the snow slab that, owing to its weight, produces stresses in the weak part of the snow pack), (3) stresses that trigger shear failure of the low- strength layer (common causes are additional snowfall, deposition of windblown snow, explosions, weight of people, loss of snow strength from high temperature), (4) a medium-to-high strength of the snow of the slab, allowing failure to propagate over a wide area, and (5) deep unstable snow in the avalanche track, adding mass when the initial slab is in motion.
A series of weather and terrain factors determines these conditions. Precipitation, temperature, wind, and their interaction influence the weight and strength of the snow slab, the presence and strength of weak internal layers, and the strength and amount of snow available in the track. The amount deposited in the catchment area is essentially responsible for avalanche mass, and the sequence of temperature and wind influences the frequency of avalanche release. Weather conditions and atmospheric circulation leading to large avalanche winters at Rogers Pass were discussed by Fitzharris (1981). Surface area of the catchment, slope angle, exposure to wind, and roughness of the ground surface are the significant terrain factors. Their correlation with avalanche frequency was investigated earlier (Schaerer
1977').
For certain applications it may be satisfactory to know only the frequency of events. For example, how often does an avalanche reach a road or a building site? It is only possible to estimate frequency when the dates of previous avalanches are known or their history can be deduced from the age of trees in the run-out zone. Fohn (1978) and Armstrong (1981) have described such cases and have estimated the average frequency of discrete avalanche events by fitting a Poisson distribution to observed occurrences.
The design of engineering works in the path of ava- lanches, however, requires more complete information regarding speed, flow depth, volume of snow, and dis- tance reached by avalanches of a given frequency of occurrence. All these quantities are a function of ava- lanche mass. Methods of estimating mass-frequency relations of avalanches may be grouped as follows.
Statistical methods fit a frequency distribution to ob- served avalanche data. In practice, however, there is a lack of long-term observations that would allow, even in the best cases, reliable predictions to be made. Ex- cept for the highway at Rogers Pass, B.C., road main- tenance establishments and ski areas in Western Canada have only maintained avalanche occurrence records during the past 10 years.
Conceptual methods attempt to predict the mass of average and maximum avalanches with the aid of models that describe the snow conditions necessarv to produce avalanches on a given slope. This method is used to predict landslides where observations of the geometry of the terrain and the properties of the soil, together with calculations of the conditions that could produce failure, lead to estimates of the mass of the unstable ground.
Simple conceptual models have been applied in land- use planning to predict the size of expected maximum avalanches (Mears 1976; Buser and Frutiger 1980). Models that estimate the discharge rate of avalanching snow by taking into account only a few parameters have, however, proved to be unsatisfactory. As recent destructive avalanches in Western Europe have illus- trated, the mass of possible maximum avalanches has been badly underestimated. The task of developing more realistic conceptual models is difficult; the phys- ical processes of avalanche formation are complex (some terrain factors, for example exposure to wind, cannot be quantified), and there is usually a lack of information about the climate for the avalanche paths under consideration.
Empirical methods combine statistical and concep- tual methods by filling the gaps of knowledge in the conceptual models with statistically inferred relations. The methods are commonly applied in predicting runoff from rainfall, the Rational Formula being the best
76 CAN. 1. CIV. ENG, VOL, I I . 1984
known. A similar relation has been developed for the mass of snow avalanches and is discussed in this paper. Owing to a dearth of information that would allow calibration of the models, none of the three approaches yields reliable answers. For quantitative prediction, avalanche science is only now at the stage achieved in hydrology at the beginning of the 20th century. This slow progress is a result of the low demand for infor- mation because avalanches cause damage less fre- quently than flood waters, and to poor understanding of the complex nature of snow and the formation of avalanches.
Data base for study
Because of the difficulties inherent in statistical and conceptual methods, the authors have attempted to es- tablish empirical relations between the mass of large avalanches and terrain and climate factors. The series of observations at Rogers Pass in the Selkirk Mountains of Western Canada was investigated. In 1957 the National Research Council Canada began avalanche studies there. The results were used initially in de- signing avalanche control structures on the Trans- Canada Highway, but following its completion the ob- servations were continued as part of a research program on avalanche characteristics. One of the projects, on which work was intensified in 1966, was the measuring or estimating of the length, width, depth, and density of snow deposited by each avalanche at selected sites, and the calculating of the mass of the avalanches from this information.
The main line of the Canadian Pacific Railway was built through Rogers Pass in 1885 and the railway com- pany has available observations of avalanches on the track since 1909. These records, containing the lo- cation, length of track covered, and depth of avalanche snow, permit estimates to be made of the mass of individual avalanches (Fitzharris and Schaerer 1980; Fitzharris 1981).
Heavy snowfall and relatively moderate winter tem- peratures are outstanding characteristics of the climate of the Selkirk Mountains. At Rogers Pass, elevation 1320 m, the average annual precipitation is 1440 mm, of which 930 mm is in the form of snow. At the Fidelity Mountain Observatory, elevation 1875 m, precipitation in the form of snow is 1695 mm per year. Such heavy snowfall in association with steep terrain produces fre- quent, large avalanches. Some of the avalanche paths under observation produce, on average, one to three avalanches a year, others as many as 30.
Frequency distribution
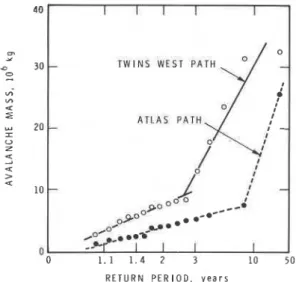
The masses of the largest avalanches observed in the present study over periods of 16-25 years have been plotted against frequency for each path; two examples
30
-
20 - A T L A S P A T H 10-
0 0 1.1 1.4 2 3 10 50 R E T U R N P E R I O D , y e a r sFIG. 2. Annual exceedance series plotted against a Gumbel frequency distribution.
are given in Fig. 2. The number of avalanche events selected is equal to the number of years of observation, the data representing annual exceedance series. These are preferred to annual maximum series because max- imum conditions can be repeated in one winter. For example, a large avalanche might run in January and subsequent snowfalls might produce another major oc- currence later in the same winter. In another year, the snowpack might be so stable that no avalanche, or only small ones, would result.
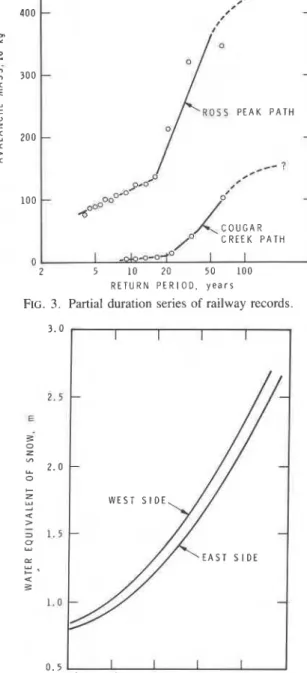
The data collected by the Canadian Pacific Railway form longer series than do the NRC observations, but they are partial duration series containing only ava- lanches that exceeded a base value of mass great enough to reach the railway line. Figure 3 is an-example of these data plotted against frequency.
The frequency distributions of both series are similar. They allow a straight line to be fitted to the lower values of the data, plotted on an extreme-value scale, but there is a sharp upswing of the distribution line for high values. Fitzharris (1981) found that the Gumbel distri- bution fits the low values best. The break in the fre- quency curve occurs at the return period between 3 and 25 years, on the average at 12 years. Shapes of fre- quency distribution with a break and no standard curve fit have been found for series of other phenomena that combine data from distinct processes. Examples in- clude the run-off from several catchment basins with different characteristics and peak river flows generated either by snowmelt or heavy rainfall (Waylen and Woo 1982).
Similarly, the two parts of the frequency line for avalanche mass (Figs. 2 and 3) represent avalanches with two origins. The first, high-frequency part con-
SCHAERER AND HTZHARRIS 77
tains avalanches in which nothing more than a snow slab releases in a well-defined starting zone. The events falling into the second, steeper part are generated when the avalanche sets in motion additional snow that com- bines with the initial snow slab. Additional avalanche snow is produced when a fracture propagates into an adjacent slope and avalanches from two or more starting zones run simultaneously into the same track, when the failure propagates into a deep, weak layer and the avalanche contains snow deposited over a period of several weeks, or when deep unstable snow is set in motion in the track. In this paper the infrequent ava- lanches of the second part of the frequency distribution will be referred to as major avalanches. The mass of major avalanches greatly exceeds that of the annually observed maximum avalanches. Major avalanches are notable for the amount of snow they transport and the distances they run.
The frequency curve may sometimes flatten at the top, resulting in an S-shaped curve, indicated by a dashed line in Fig. 3. Such flattening indicates an upper bound of the mass of avalanches because the storage capacity for snow in the avalanche path is finite. The weight of snow that can accumulate on a slope is limited by the strength of the snow, and the surface area that can slide is bounded by terrain features. For each avalanche path there may be a maximum possible avalanche, assuming coincidence of maximums of all factors that produce avalanches.
Development of empirical relations A relation between the mass of avalanches and the most significant factors determining it can be expressed as
[ l ]
M,
= C(S - R)Anwhere
M,
is the mass of a maximum avalanche for the return period m; S is an index of the amount of snowfall in the avalanche path; R is a factor describing roughness of the ground; A is the surface area of the catchment; and C is an avalanche mass coefficient that is a function of the return period, m, as well as of the incline and wind exposure of the starting zone. Equation [ l ] is similar to the rational formula commonly applied in predicting peak runoff from small watersheds.In order to develop values for the avalanche mass coefficient, C , and the exponent, n, in [I], observations at Rogers Pass were analysed for 37 avalanche paths. The criteria applied in selecting the paths for study were: (1) artillery fire must not be used for avalanche control, (2) the starting zone must be a clearly defined area with uniform surface features, (3) avalanches.must deposit their mass in the run-out zone and leave an insignificant amount in the track, and (4) observations of avalanche mass must be available since 1966 or earlier.
R E T U R N P E R I O D , y e a r s
FIG. 3. Partial duration series of railway records
0 . 5
1200 1400 1600 1800 2000 2200
E L E V A T I O N A B O V E S E A L E V E L , m
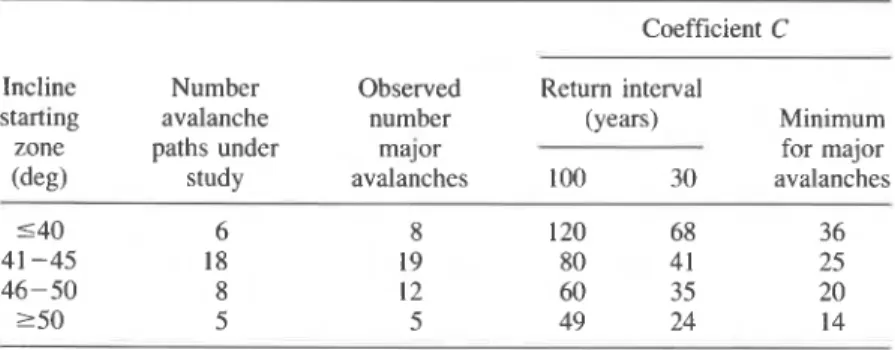
FIG. 4. Thirty-year maximum water equivalent of snow on ground at Rogers Pass.
Snowfall index
This was assumed to be S = S3,,, where S30 is the 30-year annual maximum water-equivalent of the snowpack in the centre of the catchment. Values of S30 were inferred from annual observations carried out at various elevations, separately, for the east and west sides of Rogers Pass (Fig. 4). The parameter S30 is a
CAN. J CIV. ENG. VOL. 11, 1984
TABLE 1. Avalanche mass coefficient C determined in analysis (C in lo3 kg m-') Coefficient C Incline Number Observed Return interval
starting avalanche number (years) Minimum
zone paths under major for major
(deg) study avalanches 100 30 avalanches
constant for each avalanche path, although an expres- sion in the form of a probability function would be preferable. It would be logical, for example, for the mass of a 100-year maximum avalanche to be calcu- lated for a 100-year maximum snowfall rather than for a 30-year one. At present, however, the 30-year max- imum is the best long-term estimate possible with the short observation series available.
Roughness
The ground surface roughness factor, R , was defined as the water equivalent of snow on the ground when the first avalanche of the winter reached the run-out zone. This means that values for R are dependent on condi- tions in the starting zone as well as conditions in the track. Although the dates and snow depths for the first avalanches vary, typical minimum values for R can be defined from 16 years of observations:
Conditions R (m)
Mostly bare rock 0.13-0.2
Starting zone of mixed rock and soft ground, widely scattered trees and shrubs; tracks
wide, rock gullies 0.2-0.3
Starting zone containing benches, patches of forest, or dense brush; trees or dense brush
in the track 0.3-0.4
Effective catchment area
The effective catchment area, A , was defined as the total land surface area from which unstable snow may fall into the run-out zone, that is, the starting zone and track (excluding areas of dense forest where avalanches are not expected to start) and ridges and open slopes from which wind could blow snow into the starting zone. Area A was measured for each avalanche path on contour maps (scale 1 : 5000 and 1 : 2400) after the boundaries had been determined from both ground ob- servations and air photos.
The mass data for the annual exceedance series of each avalanche path were plotted against an extreme-
value frequency distribution, and the mass, M a , of the major events falling into the rising part of the distribu- tion curve (Fig. 2) was retained for further analysis. The avalanche paths were grouped according to incline of the starting zone and exposure to wind. The value of C for each avalanche was normalized using the following equation.
Frequency distribution curves were then fitted to the values of C within each group. Acceptable distributions were found in this way, with the log-normal function giving the best fit. C was calculated for n = 0.4, 0.5, 0.6,0.7, 0.8 and the value of R determined for the path and for R = 0. The results were rated according to how well all data and high values fitted, and to the uni- formity of representation of data from all avalanche paths within the group. The results of the analysis fol- : low. (1) The incline of the starting zone had a strong
i
influence on coefficient C , the reason being that on steep slopes avalanches run frequently and therefore have a small mass. (2) Exposure to wind was secondary in significance but could not be quantified. (3) The values n = 0.5 and n = 0.6 produced the best per- formance (about equal) of the frequency distributions, but n = 0.5 is easier to apply. (4) A better fit was obtained when ground roughness R was neglected (assumed equal to 0). This confirms earlier studies for Rogers Pass (Schaerer 1977).The best prediction equation from these results for a maximum avalanche is:
[3] M , = c - S ~ ~ - A ~ ~
where
M,
is the mass of an avalanche (tonne); S,, is the 30-year maximum water equivalent of snow in the cen- tre of the catchment (m); A is the catchment area (m2); and C is the avalanche mass coefficient (t m-'). The values for C determined in the study are given in Table 1.The mass of a 100-year maximum avalanche pre- dicted with [3] and Table 1 was compared with the mass
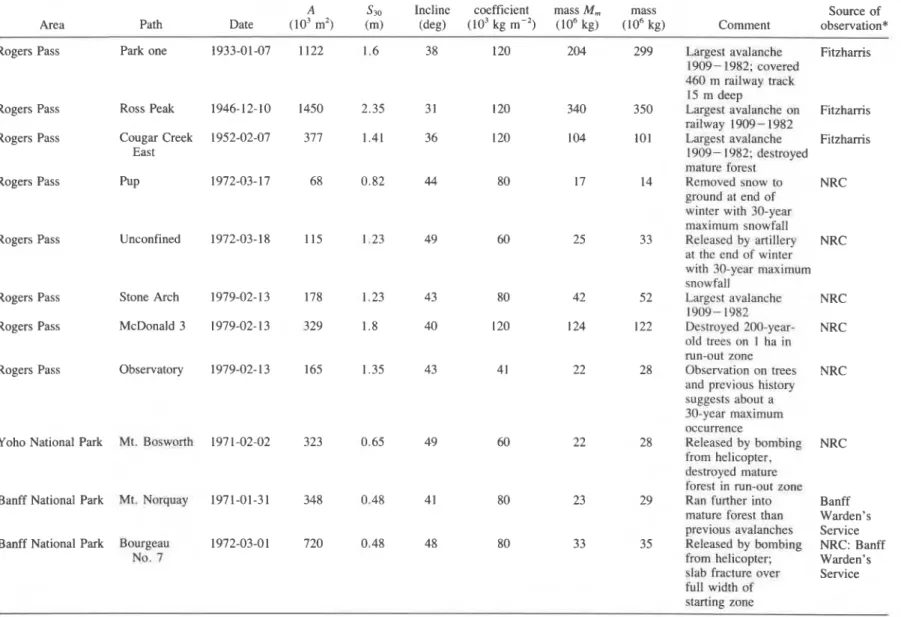
TABLE 2. Observed very large avalanches
Area Snowfall Mass Predicted Observed
A S30 Incline coefficient mass M, mass Source of Area Path Date (lo3 m2) (m) (deg) (lo3 kg m-2) (lo6 kg) (lo6 kg) Comment observation* Rogers Pass Park one 1933-01-07 1122 1.6 38 120 204 299 Largest avalanche Fitzharris
1909- 1982; covered
460 m railway track 15 m deep
Rogers Pass Ross Peak 1946-12-10 1450 2.35 31 120 340 350 Largest avalanche on Fitzharris railway 1909-1982
Rogers Pass Cougar Creek 1952-02-07 377 1.41 36 120 104 101 Largest avalanche Fitzharris
East 1909- 1 Y82: destroyed
mature forest
Rogers Pass PUP 1972-03-17 68 0.82 44 80 17 14 Removed snow to NRC ground at end of
winter with 311-year maximum snowfall
Rogers Pass Unconfined 1972-03-18 115 1.23 49 60 25 33 Released by artillery NRC g I
at the end of winter >
rn
with 30-year maximum P rn
snowfall P
Rogers Pass Stone Arch 1979-02-13 178 1.23 43 80 42 52 Largest avalanche NRC
1909-1982 13
Rogers Pass McDonald 3 1979-02-13 ,329 1.8 40 120 124 122 Destroyed 2DO-year- NRC 3
a
old trees nn I ha in x >mn-out zone P
Rogers Pass Observatory 1979-02- 13 165 1.35 43 41 22 28 Observation on trees NRC ?? tA and prcvious history
suggcsts about a 30-ycar maximum occurrence
Yoho National Park Mt. BosworIh 1971-02-02 323 0.65 49 60 22 28 Released by bnrnbing NRC from helicopter,
destroyed mature
forest in run-our zone Banff National Park Mt. Norquay 1971-01-31 348 0.48 4 1 80 23 29 Ran further into Banff
mature forest than Warden's previous avalanches Service Banff National Park Bourgeau 1972-03-01 720 0.48 48 80 33 35 Released by bombing NRC: Banff
No. 7 from helicopter; Warden's
slab fracture over Service full width of
starting zone
*Source Fitzharris refers to the avalanches recorded by Canadian Pacific Railway and analysed by Fitzharris (1981). Source NRC are observations carried out by staff of the National Research Council Canada. The Wardens of Banff National Park assisted with measurements of avalanches. \O
80 CAN. 1. CIV. ENG, VOL. 1 1 . 1984
for the largest avalanche observed in the past 70 or more years. The data in Table 2 demonstrate that the ob- served avalanche mass was either close to or exceeded the predicted mass. This could mean that the values for the coefficient C in Table 1 are low, probably owing to the small sample size used in the analysis or because the observed avalanches had a return period greater than
100 years.
One should keep in mind that measurements of ava- lanche mass vary within k 15% of true mass.' Further- more, some avalanches were triggered by artillery fire or explosive charges dropped from a helicopter. Such triggers impose high stresses on the snow and may release avalanches of a size that would not have oc- curred under natural circumstances. The three ava- lanches observed in Banff and Yoho National Parks indicate also that the equations developed for Rogers Pass can be applied to very large avalanches in the drier and colder Rocky Mountain climate.
Recommendations for design avalanches
In designing engineering works and planning land use, estimates must be made of the size of avalanche for a given permissible risk. The predicted maximum should be the most severe that could reasonably be expected at a given path once in about 300 years, but would not have the mass of the maximum possible avalanche, given the worst theoretical combination of factors. The predicted maximum probable avalanche is applicable for design purposes where high-use areas must be protected and avalanches would result in loss of life or catastrophic destruction of property. Design ava- lanches of smaller size may be used where risk can be tolerated. Suggested return periods for design ava- lanches are:
Return period Design purpose (years) Hazard line in land-use planning 300 Structures in avalanche paths 100 Earth works for avalanche control, snow
sheds on important roads, structures
with permissible moderate damage 30 Control works on secondary roads 10
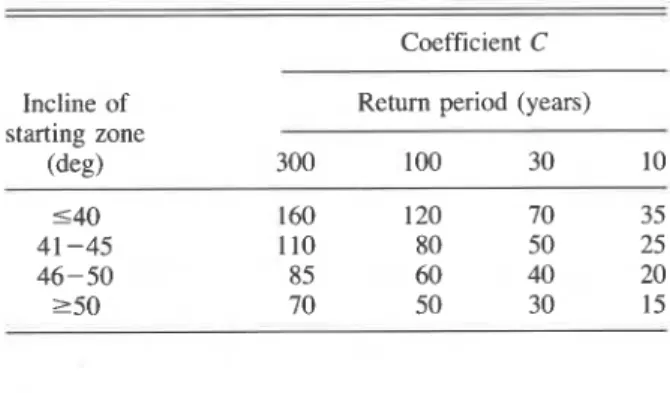
Equation [3] is applicable for estimating the mass of design avalanches. Recommended values of the mass coefficient for given return periods are presented in Table 3. They were obtained by fitting those in Table 1
to a frequency distribution and rounding off. The vari- ables were developed for avalanches at Rogers Pass and should be applied with caution to other regions.
'Schaerer, P. A. To be published.
TABLE 3. Recommended avalanche mass coefficients for de- sign avalanches
Coefficient C Incline of Return period (years) starting zone (deg) 300 100 30 10 5 4 0 160 120 70 35 41 -45 110 80 50 25 46 - 50 85 60 40 20 2 5 0 70 50 30 15 Conclusions
Major avalanches, which occur at Rogers Pass once in 3 - 30 years, are caused by a combination of factors in the catchment area and are much larger than annually observed maximum avalanches. They should be treated as a separate population in a statistical analysis. Fre- quency distributions fitted to short annual maximum or annual exceedance series would severely underestimate the mass of major avalanches. Inasmuch as major ava- lanches occur infrequently, collecting data for useful statistical analysis is a long-term task.
Conceptual models that attempt to estimate the mass of major avalanches by describing the conditions re- sponsible for them are impeded by lack of appreciation of the complex nature of avalanche formation and of the effects of weather. An empirical relation has therefore been developed between the mass of maximum ava- lanches and the terrain and weather factors that circum- vented the difficulties of collecting data for a statistical analysis and the problems of application of conceptual models.
The parameters of empirical relations such as the one presented in this paper are influenced by the data series used for their development. Differences could be ex- !
petted between regions and with data that cover longer
;
time periods. The authors suspect regional variations to I
be weak because experience indicates that maximum
I
events usually have similar causes, although the annu- ally observed smaller avalanches vary strongly withi
climate and terrain. For this reason eq. [3] and Table 3 may be tested and applied with caution in areas other than Rogers Pass. It is recommended that avalanche observers build up a data base for future calibration of predictive equations by recording the dimensions and masses of all major avalanches.Climate is the weakest element in the avalanche mass prediction equation. The 30-year maximum water equivalent of snow was chosen as a measure of it be- cause this is the best information available at the present time. It can be estimated from either precipitation records or snow surveys. The prediction equation must
SCHAERER AND FITZHARRIS 8 1
be improved in the future by introducing as a proba- bility factor a measure of the maximum weight of a potential snow slab.
In making predictions about maximum avalanches from past observations, one must assume that no changes have occurred in the climate and the terrain and that they will not occur in the future. Changes that influence the mass and frequency of avalanches signifi- cantly are loss or regrowth of forest and the revised use of land.
Acknowledgements
The contribution of the field crew of the National Research Council Canada under P. Anhom and K.
Everts is acknowledged. The latter assisted in the diffi- cult initial phase of the study. The work at Rogers Pass could not have been carried out without the continuing support of Parks Canada and grateful thanks are ex- pressed to Superintendents and staff at Mount Revel- stoke and Glacier National Parks for their cooperation. This paper is a contribution from the Division of Building Research, National Research Council Canada, and is published with the approval of the Director of the Division.
ARMSTRONG, B. R. 1981. A quantitative analysis of ava- lanche hazard on U.S. Highway 550, Southwestern Colorado. Proceedings, Western Snow Conference 1981, St. George, Utah, pp. 95-104:
BAKKEHOI, S., CHENG, T., DOMAAS, U., LIED, K., PERLA,
R., and SCHIELDROP, B. 1981. On the computation of pa- rameters that model snow avalanche motion. Canadian Geotechnical Journal, 18(1), pp. 121 - 130.
BUSER, O . , and FRUTIGER, H. 1980. Observed maximum run-out distance of snow avalanches and the determination of the friction coefficients. Journal of Glaciology, 26(94), pp. 121-130.
FITZHARRIS, B. B. 1981. Frequency and climatology of major avalanches at Rogers Pass 1909 - 1977. National Research Council Canada, Division of Building Research, NRCC 19020, 42 p.
FITZHARRIS, B. B., and SCHAERER, P. A. 1980. Frequency of major avalanche winters. Journal of Glaciology, 26(94), pp. 43-52.
FOHN, P. 1978. Avalanche frequency and risk estimation in forest sites. In Mountain forests and avalanches, Inter- national Union of Forestry Research Organizations, Pro- ceedings of Davos Seminar, pp. 241 -254.
KORNER, H. J. 1980. Modelle zur Berechnung der Bergsturz und Lawinenbewegung. Proceedings, International Sym- posium Interpraevent at Klagenfurt, Austria, Vol. 2, pp. 15-55.
MEARS, A. I. 1976. Guidelines and methods for detailed snow avalanche hazard investigations in Colorado. Colora- do Geological Survey, Bulletin 38, 125 p.
PERLA, R., CHENG, T. T., and MCCLUNG, D. M. 1980. A two-parameter model of snow-avalanche motion. Journal of Glaciology, 26(94), pp. 197 -207.
SCHAERER, P. 1977. Analysis of snow avalanche terrain. Canadian Geotechnical Journal. 14(3), pp. 281 -287. WAYLEN, P., and WOO, M. 1982. Prediction of annual floods
generated by mixed processes. Water Resources Research, 18(4), pp. 1283- 1286.