The MIT Faculty has made this article openly available.
Please share
how this access benefits you. Your story matters.
Citation
Landt, S. G. et al. “ChIP-seq Guidelines and Practices of the
ENCODE and modENCODE Consortia.” Genome Research 22.9
(2012): 1813–1831.
As Published
http://dx.doi.org/10.1101/gr.136184.111
Publisher
Cold Spring Harbor Laboratory Press
Version
Final published version
Citable link
http://hdl.handle.net/1721.1/77597
Terms of Use
Creative Commons Attribution Non-Commercial
10.1101/gr.136184.111
Access the most recent version at doi:
2012 22: 1813-1831
Genome Res.
Stephen G. Landt, Georgi K. Marinov, Anshul Kundaje, et al.
modENCODE consortia
ChIP-seq guidelines and practices of the ENCODE and
Material
Supplemental
http://genome.cshlp.org/content/suppl/2012/08/22/22.9.1813.DC1.html
References
http://genome.cshlp.org/content/22/9/1813.full.html#ref-list-1
This article cites 51 articles, 15 of which can be accessed free at:
Open Access
Genome Research
Open Access option.
Freely available online through the
License
Commons
Creative
). After six months, it is available under
http://genome.cshlp.org/site/misc/terms.xhtml
for the first six months after the full-issue publication date (see
This article is distributed exclusively by Cold Spring Harbor Laboratory Press
service
Email alerting
click here
top right corner of the article or
Receive free email alerts when new articles cite this article - sign up in the box at the
http://genome.cshlp.org/subscriptions
go to:
Genome Research
To subscribe to
Related Content
Alan P. Boyle, Eurie L. Hong, Manoj Hariharan, et al.
Annotation of functional variation in personal genomes using RegulomeDB
Genome Res. September , 2012 22: 1775-1789
Thomas Derrien, Rory Johnson, Giovanni Bussotti, et al.
gene structure, evolution, and expression
The GENCODE v7 catalog of human long noncoding RNAs: Analysis of their
Genome Res. September , 2012 22: 1760-1774
Jennifer Harrow, Adam Frankish, Jose M. Gonzalez, et al.
GENCODE: The reference human genome annotation for The ENCODE Project
Genome Res. September , 2012 22: 1735-1747
Anshul Kundaje, Sofia Kyriazopoulou-Panagiotopoulou, Max Libbrecht, et al.
regulatory elements
Ubiquitous heterogeneity and asymmetry of the chromatin environment at
Genome Res. September , 2012 22: 1723-1734
Aaron Arvey, Phaedra Agius, William Stafford Noble, et al.
factor binding
specific transcription
−
Sequence and chromatin determinants of cell-type
Genome Res. September , 2012 22: 1711-1722
Anirudh Natarajan, Galip Gürkan Yardimci, Nathan C. Sheffield, et al.
specific gene expression from regions of open chromatin
−
Predicting cell-type
Genome Res. September , 2012 22: 1680-1688
Hao Wang, Matthew T. Maurano, Hongzhu Qu, et al.
Widespread plasticity in CTCF occupancy linked to DNA methylation
Genome Res. September , 2012 22: 1668-1679
Alexandra E. Charos, Brian D. Reed, Debasish Raha, et al.
network in HepG2 cells
A highly integrated and complex PPARGC1A transcription factor binding
Genome Res. September , 2012 22: 1658-1667
Chao Cheng, Roger Alexander, Renqiang Min, et al.
transcription factor binding data
Understanding transcriptional regulation by integrative analysis of
Genome Res. September , 2012 22: 1798-1812
Jie Wang, Jiali Zhuang, Sowmya Iyer, et al.
bound by 119 human transcription factors
Sequence features and chromatin structure around the genomic regions
Genome Res. September , 2012 22: 1612-1615
Stephen Chanock
Toward mapping the biology of the genome
Genome Res. September , 2012 22: 1602-1611
John A. Stamatoyannopoulos
What does our genome encode?
Genome Res. September , 2012 22: 1599-1601
Kelly A. Frazer
Decoding the human genome
http://genome.cshlp.org/subscriptions
go to:
Genome Research
To subscribe to
Resource
ChIP-seq guidelines and practices of the ENCODE
and modENCODE consortia
Stephen G. Landt,
1,26Georgi K. Marinov,
2,26Anshul Kundaje,
3,26Pouya Kheradpour,
4Florencia Pauli,
5Serafim Batzoglou,
3Bradley E. Bernstein,
6Peter Bickel,
7James B. Brown,
7Philip Cayting,
1Yiwen Chen,
8Gilberto DeSalvo,
2Charles Epstein,
6Katherine I. Fisher-Aylor,
2Ghia Euskirchen,
1Mark Gerstein,
9Jason Gertz,
5Alexander J. Hartemink,
10Michael M. Hoffman,
11Vishwanath R. Iyer,
12Youngsook L. Jung,
13,14Subhradip Karmakar,
15Manolis Kellis,
4Peter V. Kharchenko,
12Qunhua Li,
16Tao Liu,
8X. Shirley Liu,
8Lijia Ma,
15Aleksandar Milosavljevic,
17Richard M. Myers,
5Peter J. Park,
13,14Michael J. Pazin,
18Marc D. Perry,
19Debasish Raha,
20Timothy E. Reddy,
5,27Joel Rozowsky,
9Noam Shoresh,
6Arend Sidow,
1,21Matthew Slattery,
15John A. Stamatoyannopoulos,
11,22Michael Y. Tolstorukov,
13,14Kevin P. White,
15Simon Xi,
23Peggy J. Farnham,
24,28Jason D. Lieb,
25,28Barbara J. Wold,
2,28and Michael Snyder
1,281–25
[Author affiliations appear at the end of the paper.]
Chromatin immunoprecipitation (ChIP) followed by high-throughput DNA sequencing (ChIP-seq) has become a valuable
and widely used approach for mapping the genomic location of transcription-factor binding and histone modifications
in living cells. Despite its widespread use, there are considerable differences in how these experiments are conducted, how
the results are scored and evaluated for quality, and how the data and metadata are archived for public use. These
practices affect the quality and utility of any global ChIP experiment. Through our experience in performing ChIP-seq
experiments, the ENCODE and modENCODE consortia have developed a set of working standards and guidelines for ChIP
experiments that are updated routinely. The current guidelines address antibody validation, experimental replication,
sequencing depth, data and metadata reporting, and data quality assessment. We discuss how ChIP quality, assessed in
these ways, affects different uses of ChIP-seq data. All data sets used in the analysis have been deposited for public viewing
and downloading at the ENCODE (http://encodeproject.org/ENCODE/) and modENCODE (http://www.modencode.
org/) portals.
[Supplemental material is available for this article.]
Methods for mapping transcription-factor occupancy across the genome by chromatin immunoprecipitation (ChIP) were devel-oped more than a decade ago (Ren et al. 2000; Iyer et al. 2001; Lieb et al. 2001; Horak and Snyder 2002; Weinmann et al. 2002). In ChIP assays, a transcription factor, cofactor, or other chromatin protein of interest is enriched by immunoprecipitation from cross-linked cells, along with its associated DNA. Genomic DNA sites enriched in this manner were initially identified by DNA hybrid-ization to a microarray (ChIP-chip) (Ren et al. 2000; Iyer et al. 2001; Lieb et al. 2001; Horak and Snyder 2002; Weinmann et al. 2002),
and more recently by DNA sequencing (ChIP-seq) (Barski et al. 2007; Johnson et al. 2007; Robertson et al. 2007). ChIP-seq has now been widely used for many transcription factors, histone modifications, chromatin modifying complexes, and other chro-matin-associated proteins in a wide variety of organisms. There is, however, much diversity in the way ChIP-seq experiments are designed, executed, scored, and reported. The resulting variability and data quality issues affect not only primary measurements, but also the ability to compare data from multiple studies or to perform integrative analyses across multiple data-types.
The ENCODE and modENCODE consortia have performed more than a thousand individual ChIP-seq experiments for more than 140 different factors and histone modifications in more than 100 cell types in four different organisms (D. melanogaster, C. elegans, mouse, and human), using multiple independent data production and processing pipelines (The ENCODE Project Consortium 2004, 2011; Celniker et al. 2009). During this work, we developed guidelines, practices, and quality metrics that are ap-plied to all ChIP-seq work done by the Consortium (Park 2009). Here we describe these, together with supporting data and
illus-26These authors contributed equally to this work.
27Present address: Institute for Genome Sciences and Policy, Duke University, Durham, NC 27708, USA.
28Corresponding authors E-mail [email protected] E-mail [email protected] E-mail [email protected] E-mail [email protected]
Article and supplemental material are at http://www.genome.org/cgi/doi/ 10.1101/gr.136184.111. Freely available online through the Genome Research Open Access option.
trative examples. We emphasize issues common to all ChIP-seq studies: immunoprecipitation specificity and quality, impact of DNA sequencing depth, scoring and evaluation of data sets, ap-propriate control experiments, biological replication, and data reporting.
ChIP overview
The goals of a genome-wide ChIP experiment are to map the bind-ing sites of a target protein with maximal signal-to-noise ratio and completeness across the genome. The basic ChIP-seq procedure is outlined in Figure 1A, and detailed protocols (and data) from our two consortia can be obtained from the ENCODE and modENCODE production groups listed at the UCSC Genome Browser: http://
encodeproject.org/ENCODE/ and http://www.modencode.org/, respectively. Cells or tissues are treated with a chemical agent, usually formaldehyde, to cross-link proteins covalently to DNA. This is followed by cell disruption and sonication, or in some cases, enzymatic digestion, to shear the chromatin to a target size of 100–300 bp (Ren et al. 2000; Iyer et al. 2001). The protein of interest (transcription factor, modified histone, RNA polymerase, etc.) with its bound DNA is then enriched relative to the starting chromatin by purification with an antibody specific for the factor. Alterna-tively, cell lines expressing an epitope-tagged factor can be gener-ated and the fusion protein immunoprecipitgener-ated via the epitope tag. After immuno-enrichment, cross-links are reversed, and the enriched DNA is purified and prepared for analysis. In ChIP-chip, the DNA is fluorescently labeled and hybridized to a DNA microarray, along with differentially la-beled reference DNA (Ren et al. 2000; Iyer et al. 2001). In ChIP-seq, the DNA is analyzed by high-throughput DNA se-quencing. The ENCODE Consortium chose ChIP-seq for human and mouse experiments because it permits compre-hensive coverage of large genomes and increases site resolution ( Johnson et al. 2007; Robertson et al. 2007). For organisms with small genomes, the modENCODE Consortium has used both ChIP-chip and ChIP-seq, as modern arrays can pro-vide high-resolution coverage of small genomes (Gerstein et al. 2010; Roy et al. 2010). In all formats, we identified pu-tatively enriched genomic regions by comparing ChIP signals in the experi-mental sample with a similarly processed reference sample prepared from appro-priate control chromatin or a control immunoprecipitation.
Different protein classes have dis-tinct modes of interaction with the ge-nome that necessitate different analytical approaches (Pepke et al. 2009):
1. Point-source factors and certain chro-matin modifications are localized at specific positions that generate highly localized ChIP-seq signals. This class includes most sequence-specific tran-scription factors, their cofactors, and, with some caveats, transcription start site or enhancer-associated his-tone marks. These comprise the ma-jority of ENCODE and modENCODE determinations and are therefore the primary focus of this work.
2. Broad-source factors are associated with large genomic domains. Exam-ples include certain chromatin marks (H3K9me3, H3K36me3, etc.) and chro-matin proteins associated with tran-scriptional elongation or repression (e.g., ZNF217) (Krig et al. 2007). 3. Mixed-source factors can bind in
point-source fashion to some locations of Figure 1. Overview of ChIP-seq workflow and antibody characterization procedures. (A) Steps for
which specific ENCODE guidelines are presented in this document are indicated in red. For other steps, standard ENCODE protocols exist that should be validated and optimized for each new cell line/tissue type or sonicator. (*) A commonly used but optional step. (B) Flowchart for characterization of new antibodies or antibody lots. (C ) Flowchart for use of antibody characterization assays.
the genome, but form broader domains of binding in others. RNA polymerase II, as well as some chromatin modifying pro-teins (e.g., SUZ12) behave in this way (Squazzo et al. 2006). Below, we report our experience with ChIP-seq experimental design, execution, and quality assessment. We offer specific rec-ommendations, based on current experience, as summaries in boxes.
ChIP-seq experimental design considerations
Antibody and immunoprecipitation specificity
The quality of a ChIP experiment is governed by the specificity of the antibody and the degree of enrichment achieved in the af-finity precipitation step. The majority of ENCODE/modENCODE ChIP experiments in human cells and in Drosophila embryos were performed with antibodies directed against individual factors and histone modifications. A total of 145 polyclonal and 43 mono-clonal antibodies had been used to successfully generate ChIP-seq data as of October 2011.
Antibody deficiencies are of two main types: poor reactivity against the intended target and/or cross-reactivity with other DNA-associated proteins. For these reasons, we have developed a set of working standards and reporting guidelines designed to provide measures of confidence that the reagent recognizes the antigen of interest with minimal cross-reactivity toward other chromosomal proteins. Widely accessible methods for measuring antibody specificity and sensitivity range from semiquantitative to qualitative, and each can have noise and interpretation issues. We therefore emphasize reporting of antibody characterization data so that users of the ChIP data, or the reagent itself, can make informed judgments. We also recognize that a successful experiment can be performed with reagents that fail to strictly comply with these guidelines. For example, cross-reacting pro-teins detected in an immunoblot assay might not interfere in ChIP, because the protein is not attached to chromatin. Sec-ondary tests of diverse types can help to provide confidence concerning the acceptability of an antibody that fails an initial assessment.
Two tests, a primary and a secondary test, are used to char-acterize each monoclonal antibody or different lots of the same polyclonal antibody. The ordering of the primary and secondary tests are influenced by the effort required to execute each, with the primary assay being easier to perform on large numbers of anti-bodies. The tests differ for antibodies against transcription factors vs. those against histone modifications. A detailed description of the tests is provided in Box 1, and a typical workflow is presented in Figure 2, B and C. For transcription-factor antigens, we adopted the immunoblot as our primary assay, with immunostaining as the alternative. The former can give more information about cross-reacting material or multiple isoforms; the latter is typically less sensitive, but provides information about nuclear location. Ex-amples of antibodies that pass and fail these tests are shown in Figure 2A.
Our consortia also include one of five criteria as a secondary characterization: (1) factor ‘‘knockdown’’ by mutation or RNAi, (2) independent ChIP experiments using antibodies against more than one epitope on a protein or against different members of the same complex, (3) immunoprecipitation using epitope-tagged constructs, (4) affinity enrichment followed by mass spectrometry, or (5) binding-site motif analysis. Motif enrichment is the easiest assay to perform, but requires pre-existing information about the
sequences to which a protein binds and assumes that the motif is uniquely recognized in a given cell source by the factor of interest. ChIP with a second antibody or against an epitope-tagged con-struct and siRNA experiments coupled with ChIP provide in-dependent evidence that the target sites are bound by the factor of interest. We found that mass spectrometry is particularly useful for cases where multiple or unexpected bands are observed on an immunoblot and the presence of spliced isoforms, post-trans-lational modification, or degradation is suspected. Additionally, it can precisely identify potential alternate sources of ChIP signal, often with novel biological implications, which can be tested by additional ChIP experiments. Due to the significant effort and expense required to perform these assays, our standard for the consortia requires only one secondary assay. We found that ;20% (44 of 227) of the tested commercially available antibodies against transcription factors meet these characterization guidelines and also function in ChIP-seq assays.
To date, 55% of consortia antibodies have been submitted with mass spectrometry data, 28% with ChIP data using a second antibody, epitope tag, or alternate member of a known complex, 10% with data from motif analysis (this standard has only been used by ENCODE for 1 yr), and 7% with siRNA knockdown data. A summary of motif detection for all data sets is in preparation (P Kheradpour and M Kellis, in prep.).
Validating histone modification antibodies involves multiple issues (Egelhofer et al. 2011): (1) specificity with respect to other nuclear/chromatin proteins, (2) specificity with respect to un-modified histones and off-target un-modified histone residues (e.g., H3K9me vs. H3K27me), (3) specificity with respect to mono-, di-, and trimethylation at the same residue (e.g., H3K9me1, H3K9me2, and H3K9me3), and (4) lot-to-lot variation. For all consortia his-tone measurements, we set the standard that immunoblot analysis and one of the following secondary criteria are applied: Peptide-binding tests (dot blots), mass spectrometry, immunoreactivity analysis in cell lines containing knockdowns of a relevant histone modification enzyme or mutants histones, or genome annotation enrichment. The details of these standards are in Box 1.
Immunoprecipitation using epitope tagged constructs
Given the challenges in obtaining antibodies for suitable ChIP, an attractive alternative is to tag the factor with an exogenous epitope and immunoprecipitate with a well-characterized mono-clonal reagent specific for the tag. Epitope-tagging addresses the problems of antibody variation and cross-reaction with different members of multigene families by using a highly specific reagent that can be used for many different factors. However, this in-troduces concerns about expression levels and whether tagging alters the activity of the factor. The level of expression is typically addressed by using large clones (usually fosmids and BACs) car-rying as much regulatory information as possible to make the level of expression nearly physiological (Poser et al. 2008; Hua et al. 2009). Higher expression is known to result in occupancy of sites not necessarily occupied at physiological levels (DeKoter and Singh 2000; Fernandez et al. 2003). In ENCODE/modENCODE, tagged factors have been used most extensively thus far for C. elegans studies, where factors have been tagged with GFP and shown to complement null mutants; six of six tested to date have been found to complement (Zhong et al. 2010; V Reinke, unpubl.). In some cases, information regarding expression is not available and expression from an exogenous promoter has been used (P Farnham, unpubl.)
Box 1: ENCODE guidelines for antibody and immunoprecipitation characterization Characterization of antibodies directed against transcription factors
Antibodies directed against transcription factors must be characterized using both a primary and secondary characterization; characterizations must be repeated for each new antibody or antibody lot number that is used for ChIP-seq (Fig. 1B,C).
Primary mode of characterization
Antibodies are characterized by one of two primary methods, immunoblot analysis, or immunofluorescence.
Immunoblot analyses
Immunoblot analyses are performed on protein lysates from either whole-cell extracts, nuclear extracts, chromatin preparations, or immunoprecipitated material (before proceeding to ChIP assays, it is helpful to demonstrate that the protein of interest can be efficiently immunoprecipitated from a nuclear extract, see Fig. 2B). We use the guideline that the primary reactive band should contain at least 50% of the signal observed on the blot. Ideally, this band should correspond to the size expected for the protein of interest (Fig. 2A). However, the electrophoretic mobility of many factors can deviate significantly from the expected size due to modifications, isoform differences, or intrinsic properties of the factor. Therefore, antibodies for which the main band differs from the expected size by >20% or for which multiple bands are seen (such that no band represents >50% of the signal) can be used under certain circumstances. In these cases, further criteria must be met, such as (1) the unexpected mobility must have been properly documented in published studies using the same antibody lot, (2) the signal in the band(s) is reduced by siRNA knockdown or mutation, or (3) the factor can be identified in all band(s) by mass spectrometry.
Immunofluorescence
Some antibodies that work well for ChIP do not work well in immunoblots. If immunoblot analysis is not successful, immunofluorescence can be used as an alternative method. Staining should be of the expected pattern (e.g., nuclear and only in cell types or under specific growth conditions that express the factor) (Fig. 2C). Because immunofluorescence does not provide evidence that the antibody detects only one protein, this validation method should be combined with a method that reduces the level of the protein, such as siRNA- or shRNA-mediated knockdown, or used with a knockout cell line or organism (see below).
Secondary mode of characterization
In addition to the primary mode of characterization, the consortia performs at least one of the following five assays as an additional secondary test:
Knockdown or knockout of the target protein
Immunoblots or immunoprecipitations are performed in duplicate using extracts from siRNA or shRNA knockdowns or from knockout mutant cell lines or organisms. We use the guideline that the primary immunoblot (or immunofluorescence) signal, along with additional immunoreactive bands, should be reduced to no more than 30% of the original signal and any signal remaining after genetic mutation, RNAi, or siRNA is noted. As an alternative, knockdown can also be measured with ChIP experiments. ENCODE data can be submitted if reduction of ChIP-chip or ChIP-seq signals by >50% relative to control is observed. A suitable control knockdown (e.g. using ‘‘scrambled’’ siRNA sequences) should also be performed and the data should be submitted; reduction of signal should not be observed in the control knockdown data set. The methodology used for binding-region signal normalization (for instance, normalization against total read counts or using values from reference peaks quantified by qPCR under all experimental conditions) should also be reported.
Immunoprecipitation followed by mass spectrometry
All immunoreactive bands identified by immunoblot analysis are analyzed (Fig. 2D). ENCODE passes such analyses if the protein of interest is identified in such bands; if additional chromosomal proteins are identified in an immunoreactive band, the Consortium accepts the experiment as long as they are present at lower prevalence than the desired protein (as measured by peptide counts or other methods) or can be demonstrated to arise from nonspecific immunoprecipitation (e.g., also present in a control immunoprecipitation). All proteins identified by mass spectrometry and the number of peptide counts for each are reported.
Immunoprecipitation with multiple antibodies against different parts of the target protein or members of the same complex
Different antibodies against different parts of the same protein or other members of a known protein complex can be used in analyzing the specificity of antibodies. In the ENCODE Consortium, results of the different ChIP experiments are compared and significant overlap of enriched loci is expected (ChIP-seq experiments are compared using the IDR-based standards in Box 3). Note that for different proteins that are members of a complex, there may be some functions that are independent of one another. Thus, the targets lists for two different proteins may not entirely overlap. In this case, specific evidence about limited overlap of binding specificity in the literature is presented to justify the significance of the overlap observed between data sets for the factors in question.
Immunoprecipitation with an epitope-tagged version of the protein
An epitope-tagged version of the target protein may be used, preferably expressed from the endogenous gene promoter. ENCODE conducts and analyzes such experiments as described above for the use of multiple antibodies.
Motif enrichment
For transcription factors, if a factor has a well-characterized motif derived from in vitro binding studies or another justifiable method, and if either no paralogs are expressed in the cell lines being analyzed or if the antibody is raised to a unique region of the factor, motif enrichment can be used for validation. Motif analysis can be performed using a defined set of high-quality peaks (a 0.01 IDR threshold is used), and for ENCODE data to be submitted, motifs should be enriched at least fourfold compared with all accessible regions (e.g., DNase hypersensitive regions) and present in >10% of analyzed peaks. Analysis of data sets deposited as of January 2011 identified data sets that meet these standards for 49 of 85 factors (Fig. 2E). We note that due to differences in transcription-factor recruitment mechanisms, failure of a data set to meet the motif enrichment threshold does not necessarily indicate poor quality data.
Other considerations
1. For antibodies directed against members of a multigene family, the best practice is to prepare or obtain antibodies that recognize protein regions unique to individual family members. For an ENCODE validated antibody, any potential cross-reaction is noted when reporting data collected using that antibody.
2. For antibodies that have been previously characterized for one cell type, ENCODE has used only one validation method (such as immunoblot analysis) when the antibody is used to perform ChIP in a new cell type or organism. If an antibody has been validated in at least three different cell types, we do not require further validation for ChIP-seq experiments with additional cell types for ENCODE submission. Similarly, for whole organisms, if the antibody has been characterized in three growth stages, no further characterization is required.
3. If antibodies derived from the same lot are used by different groups in ENCODE, they only need to be characterized once. However, antibodies from different lots of the same catalog number are characterized as if they were new antibodies.
Epitope-tagged proteins
Epitope-tagged factors are introduced into cells by transfection of an expression construct. To help ensure that ChIP-seq results obtained using the tagged factor are comparable to those expected for the endogenous factor, ENCODE uses the criteria that tagged factors are expressed at a comparable amount to the endogenous factor. This is usually achieved by cloning into a low-copy number vector and using the natural promoter to drive expression. If the tagged protein is expressed from a heterologous promoter, data comparing expression levels of the tagged and endogenous proteins (i.e., immunoblots to measure protein levels or qPCR to measure RNA levels) are needed. There are special cases in which ChIP cannot be obtained at endogenous protein levels, and here, elevated expression can provide useful information. ENCODE’s recommended control for epitope-tagged measurements is an immunoprecipitation using the same antibody against the epitope tag in otherwise identical cells that do not express the tagged factor.
Histone modifications
For ENCODE data to be submitted, all commercial histone antibodies are validated by at least two independent methods, as described below, and new lots of antibody are analyzed independently. These validations are performed by the ENCODE laboratory performing the ChIP-seq or by the antibody supplier, but only if the supplier provides data for the specific lot of antibody. The tests need only be performed once for each antibody lot.
Primary test
All antibodies used in ENCODE ChIP experiments are checked for reactivity with nonhistone proteins and with unmodified histones by performing immunoblot analysis on total nuclear extract and recombinant histones. To enable visual quantification of reactivity, a concentration series of both extract and recombinant histones are analyzed using recombinant histone levels that are comparable to those of the target histone in nuclear extract. Since cross-reactivity may vary between species, this test is performed using nuclear extracts from each species to be studied by ChIP. To pass the criteria for submission in ENCODE, the specific histone band should constitute at least 50% of the signal in western blots of nuclear extract, show at least 10-fold enrichment relative to any other single band, and show at least 10-fold enriched signal relative to unmodified histone.
Secondary test
In addition to the primary test, antibody specificity is verified by at least one additional test. The pros and cons of each test are described. The first two are the most commonly used.
Peptide binding tests
Peptide binding and peptide competition assays provide a fast method to initially evaluate the specificity and relative binding strength of antibodies to histone tails with different modifications (e.g., H3K9 or H3K27 and me1, me2, and me3 levels of methylation). A potential drawback is that antibodies may differ in their binding specificity toward histone tail peptides in vitro versus toward full-length histones in the context of chromatin in IP experiments. Nevertheless, observing at least a 10-fold enriched binding signal for the modification of interest relative to other modifications provides confidence in the antibody specificity. For these assays, histone tail peptides with particular modifications can be purchased commercially. Alternatively, peptide binding and/or competition assays using the same lot of antibody can be performed by the company from which the antibody is purchased.
Mass spectrometry
For antibodies generated against related and historically problematic modifications, the ability of the antibody to effectively distinguish between similar histone marks (e.g., H3K9me and H3K27me) and between different levels of methylation (e.g., H3K9me1, H3K9me2, and H3K9me3) can be tested by mass spectrometry analysis of material immunoprecipitated from histone preparations. For ENCODE data, the target modification constitutes at least 80% of the immunoprecipitated histone signal. This test may often not be successful because IP for one modification can simultaneously isolate coassociated histones with other modifications. Thus, only a positive result (i.e., a specific modification) is interpretable.
Mutants defective in modifying histones
Strains or cell lines harboring knockouts or catalytically inactive mutants of enzymes responsible for particular histone modifications offer the opportunity to test antibody specificity. Such mutants exist for S. cerevisiae, S. pombe, Drosophila, C. elegans and can, in cases where the modifying enzymes are nonredundant, be created for mammalian cells. For submitted ENCODE/modENCODE data, antibody signal is reduced to below 10% of wild-type signal in mutant samples, compared with wild type. RNAi or siRNA depletion of histone modifying activity may be substituted for mutants. Mutant or RNAi or siRNA reduction of signal can be assayed by immunoblot analysis or by immunofluorescence staining. Mutant/RNAi/ siRNA tests usually do not allow testing antibodies for the ability to discriminate between mono-, di-, and trimethylation. In cases where more than one enzyme modifies the same residue (e.g., H3K9 methylation in Drosophila), double mutants or RNAi may be required. Replicates of this test are encouraged but not required for ENCODE/modENCODE data to be submitted. However, positive controls showing that the antibody works on Box 1: Continued
(continued)
Replication, sequencing depth, library complexity,
and site discovery
Biological replicate experiments from independent cell cultures, embryo pools, or tissue samples are used to assess reproducibility. Initial RNA polymerase II ChIP-seq experiments showed that more than two replicates did not significantly improve site discovery (Rozowsky et al. 2009). Thus, the ENCODE Consortium set as our standard that all ChIP measurements would be performed on two independent biological replicates. The irreproducible discovery rate (IDR) analysis methodology (Li et al. 2011) is now used to assess replicate agreement and set thresholds (discussed further below). For experiments with poor values for quality metrics de-scribed in Section III, additional replicate(s) have been generated. For a typical point-source DNA-binding factor, the number of ChIP-seq positive sites identified typically increases with the number of sequenced reads (Myers et al. 2011). This result is expected, as studies of numerous factors by ENCODE and by other groups have repeatedly found a continuum of ChIP signal strength, rather than a sharply bounded and discrete set of positive sites (Rozowsky et al. 2009; Myers et al. 2011). Weaker sites can be detected with greater confidence in larger data sets because of the increased statistical power afforded by more reads. Figure 3 shows an analysis of peak calls for 11 human ENCODE ChIP-seq data sets for which deep-sequence data (30–100 million mapped reads) were obtained. Clear saturation of peak counts was observed for one factor with few binding sites, but counts continued to increase at varying rates for all other factors, including a case in which >150,000 peaks were called using 100 million mapped reads. Ex-amination of peak signals reveals that the signal enrichments consistently plateau at greater sequencing depths. At 20 million mapped reads, which we currently use as a minimum for all ENCODE ChIP experiments for point-source transcription factors (Box 2), five- to 13-fold median enrichments are the norm; new peaks identified after 20 million reads give enrichments that are ;20% of the enrichment of the strongest peaks (Fig. 3C). In-terestingly, many additional peaks, with enrichment values of three- to sevenfold, can still be found by sequencing to much greater depths. It is likely that many of these regions correspond
to low-affinity sites and/or regions of open chromatin that bind TFs less specifically.
The relationship of ChIP signal strength to biological regula-tory activity is a current area of active investigation. The biological activity of known enhancers, defined in the literature independently of ChIP data, is distributed quite broadly relative to ChIP-seq signal strength (Ozdemir et al. 2011; G DeSalvo, G Marinov, K Fisher, A Kirilusha, A Mortazavi, B Williams, and B Wold, in prep.). Some highly active transcriptional enhancers reproducibly display modest ChIP signals (Fig. 4B). This means that one cannot a priori set a specific target threshold for ChIP peak number or ChIP signal strength that will assure inclusion of all functional sites (see Dis-cussion). Therefore, a practical goal is to maximize site discovery by optimizing immunoprecipitation and sequencing deeply, within reasonable expense constraints. For point-source factors in mam-malian cells, a minimum of 10 million uniquely mapped reads are used by ENCODE for each biological replicate (providing a mini-mum of 20 million uniquely mapped reads per factor); for worms and flies a minimum of 2 million uniquely mapped reads per rep-licate is used. For broad areas of enrichment, the appropriate num-ber of uniquely mapped reads is currently under investigation, but at least 20 million uniquely mapped reads per replicate for mammalian cells and 5 million uniquely mapped reads per replicate for worms and flies is currently being produced for most experiments.
Site discovery and reproducibility are also affected by the complexity of a ChIP-seq sequencing library (Fig. 4A). We define library complexity operationally as the fraction of DNA fragments that are nonredundant. With increased depth of sequencing of a library, a point is eventually reached where the complexity will be exhausted and the same PCR-amplified DNA fragments will be sequenced repeatedly. Low library complexity can occur when very low amounts of DNA are isolated during the IP or due to problems with library construction.
A useful complexity metric is the fraction of nonredundant mapped reads in a data set (nonredundant fraction or NRF), which we define as the ratio between the number of positions in the ge-nome that uniquely mappable reads map to and the total number of uniquely mappable reads; it is similar to a recently published redundancy metric (Heinz et al. 2010). NRF decreases with se-wild-type samples processed in parallel, and positive controls showing that the mutant extract is amenable to the assay employed are included for data to be submitted.
Mutant histones
Mutant histones (e.g., histone H3 with Lys4 mutated to Arg or Ala) expressed in yeast provide another avenue to test specificity by immunoblot analysis or even by ChIP. When analyzing a strain containing a mutated histone that cannot be modified, we expect at least a 10-fold reduction in immunoblot or IP signal relative to wild-type histone preparations. Mutant histone tests cannot distinguish whether antibodies discriminate between mono, di, and trimethylation.
Annotation enrichment
Enrichment at annotated features (e.g., transcription start sites) can be used as a validation criterion for certain chromatin-associated modifications and proteins. If a well-characterized modification (e.g. H3K4me3) is analyzed, the observed localization to annotations are expected to be similar to that of known overlap standards derived from the literature or existing ChIP-seq data sets (for point source peaks, overlap with known annotations can be assessed using the IDR guidelines in Box 3).
Use of two different antibodies
Even if antibodies pass the specificity tests described above, observing similar ChIP results with two independent antibodies provides added confidence. We therefore aspire to obtain ChIP-seq data from two independent antibodies whenever possible, providing statistical comparisons of the results and presenting the intersection of the peak sets obtained with the two antibodies. The reasons for a significant discordance can be either biological or technical, and merit further dissection.
Figure 2. Representative results from antibody characterization assays. (A) Immunoblot analyses of antibodies against SIN3B that (left) pass quality control (Santa Cruz sc13145) and (right) fail quality control (Santa Cruz sc996). Lanes contain nuclear extract from GM12878 cells (G) and K562 cells (K). Arrows indicate band of expected size of 133 kDa. Molecular weights (MW) are in kilodaltons. (B) Immunoblot analysis of an antibody against TBLR1 (Abcam ab24550) that passes quality control and can be used for immunoprecipitation. Immunoprecipitations (IPs) were performed from nuclear lysates of K562 cells. Arrow indicates band of expected size (56 kDa) that is detected in the input lysate (lane 1) and is efficiently (cf. lanes 3 and 2) and specifically (absent in lane 4) immunoprecipitated. (*) IgG light and heavy chains. (C ) Immunofluorescence analyses of antibodies that pass (left) and fail (right) quality control. (D) Immunoprecipitation/mass spectrometry analysis of an antibody against SP1 (Santa Cruz sc-17824). Whole-cell lysates (WCL) of K562, GM12878, and HepG2 were immunoprecipitated, and a band of expected size (;106 kDa) was detected on a Western blot with SP1 primary antibody. The immunoprecipitation was repeated in K562 WCL, separated on a gel, stained with Coomassie Blue, and the band previously detected on the Western blot was excised and analyzed by mass spectrometry. Peptides were identified using MASCOT (Matrix Science) with probability-based matching at P < 0.05. Subsequent analysis was performed in Scaffold (Proteome Software, Inc.) at 0.0% protein FDR and 0.0% peptide FDR. SP1 protein was detected (along with common contaminants that are often obtained in control experiments) (data not shown) and is highlighted in bold and light blue. (E) Histogram depicting motif fold-enrichment (blue) for all transcription factors for which ENCODE ChIP-seq data is available (85 factors). Enrichments are relative to all DNase-accessible sites and were corrected for sequence bias using shuffle motifs. Motif searches were conducted with a matching stringency of 4–6. Where multiple data sets are available for a factor, the data set with the highest enrichment was counted. Data sets that meet the ENCODE standard of fourfold enrichment (indicated by blue line) were found for 60% of factors. Motif representation, as a percentage of all analyzed peaks, is shown in red for all factors for which a data set exists that exceeds the enrichment standard. A total of 96% of these data sets meet the ENCODE standard of >10% motif representation (red line). All calculations were carried out on peaks identified by IDR analysis (0.01 cut-off ).
quencing depth, and for point source TFs, our current target is NRF $0.8 for 10 million (M) uniquely mapped reads (Box 2). We expect that, as sequencing tech-nology improves and read numbers in the hundreds of millions per lane become fea-sible, even complex libraries from point-source factor libraries may be sequenced at depths greater than necessary. To maxi-mize information that can be obtained for each DNA-sequencing run and to prevent oversequencing, barcoding and pooling strategies can be used (Lefebvre et al. 2010).
Control sample
An appropriate control data set is critical for analysis of any ChIP-seq experiment because DNA breakage during sonication is not uniform. In particular, some re-gions of open chromatin are preferen-tially represented in the sonicated sam-ple (Auerbach et al. 2009). There are also platform-specific sequencing efficiency biases that contribute to nonuniformity (Dohm et al. 2008). There are two basic methods to produce control DNA sam-ples, each of which mitigates the effects of these issues on binding-site identifica-tion: (1) DNA is isolated from cells that have been cross-linked and fragmented under the same conditions as the immu-noprecipitated DNA (‘‘Input’’ DNA); and (2) a ‘‘mock’’ ChIP reaction is performed using a control antibody that reacts with an irrelevant, non-nuclear antigen (‘‘IgG’’ control). For both types of con-trols, ENCODE groups sequence to a depth at least equal to, and preferably larger than, that of the ChIP sample. While the IgG control mimics a ChIP experiment more closely than does an ‘‘input’’ control, it is important that IgG control immunoprecipitations recover enough DNA to build a library of suffi-ciently high complexity to that of the ex-perimental samples; otherwise, binding-site identifications made using this control can be significantly biased.
Regardless of the type of control used, ENCODE and modENCODE groups perform a separate control experiment for each cell line, developmental stage, and different culture condition/treatment because of known and unknown differ-ences in ploidy, genotype, and epigenetic features that affect chromatin prepara-tion. To serve as a valid control, we use identical protocols to build ChIP and control sequencing libraries (i.e., the same as the number of PCR amplification cycles, Figure 3. Peak counts depend on sequencing depth. (A) Number of peaks called with Peak-seq
(0.01% FDR cut-off) for 11 ENCODE ChIP-seq data sets. (B) Called peak numbers for 11 ChIP-seq data sets as a function of the number of uniquely mapped reads used for peak calling. (Inset) Called peak data for the MAFK data set from HepG2 cells, currently the most deeply sequenced ENCODE ChIP-seq data set (displayed separately due to the significantly larger number of reads relative to the other data sets). Data sets are indicated by cell line and transcription factor (e.g., cell line HepG2, tran-scription factor MAFK). (C ) Fold-enrichment for newly called peaks as a function of sequencing depth. For each incremental addition of 2.5 million uniquely mapped reads, the median fold-en-richment for newly called peaks as compared with an IgG control data set sequenced to identical depth is plotted.
fragment size, etc.). Although rare in our experience, control li-braries with particularly strong sonication biases have been ob-served and they can adversely affect peak calling (Supplemental Fig. S1). As much as possible, ENCODE/modENCODE groups also generate a separate control for each batch of sonicated samples to control for possible sonication variation.
Peak calling
After mapping reads to the genome, peak calling software is used to identify regions of ChIP enrichment. We have used several peak calling algorithms and corresponding software packages, in-cluding SPP, PeakSeq, and MACs (Ji et al. 2008; Valouev et al. 2008; Zhang et al. 2008; Rozowsky et al. 2009). The resulting output of these algorithms generally ranks called regions by absolute signal (read number) or by computed significance of enrichment (e.g., P-values and false discovery rates). Because ChIP signal strength is a continuum with many more weak sites than strong ones (Fig. 4B), the composition of the final peak list depends heavily on the specific parameter settings and the algorithm used as well as the quality of the experiment itself. Thresholds that are too relaxed lead to a high proportion of false positives for each replicate, but as discussed below, subsequent analysis can strip false positives from a final joint peak determination. Different peak-calling algorithms rely on different statistical models to calculate P-values and false discovery rates (FDR), meaning that significance values from dif-ferent software packages are not directly comparable. When using standard peak-calling thresholds, successful experiments generally identify thousands to tens of thousands of peaks for most TFs in mammalian genomes, although some exceptions are known (Frietze et al. 2010; Raha et al. 2010). In all cases, it is important to use an appropriate control experiment in peak calling.
Calling discrete regions of enrichment for Broad-source factors or Mixed-source factors is more challenging and is at an earlier stage of development. Methods to identify such regions are emerging (e.g., ZINBA [Rashid et al. 2011] [installation package at http:// code.google.com/p/zinba/], Scripture [Guttman et al. 2010], and MACS2, an updated version of MACS that is specifically designed to process mixed signal types [https://github.com/taoliu/MACS]). Standards for the identification of broad enrichment regions are currently in development.
Evaluating ChIP-seq data
The quality of individual ChIP-seq experiments varies considerably and can be especially difficult to evaluate when new antibodies are being tested or when little is known about the factor and its binding motif. The ENCODE Consortium has developed and uses metrics for several aspects of ChIP-seq quality, together with traditional site-inspection-based evaluation. When applied and interpreted as a group, these metrics and approaches provide a valuable overall assessment of experimental success and data quality.
Browser inspection and previously known sites
A first impression about ChIP-seq quality can be obtained by local inspection of mapped sequence reads using a genome browser. Although not quantitative, this approach is very useful, especially when a known binding location can be examined; read distribu-tion shape and signal strength relative to a control sample can provide a sense of ChIP quality. A true signal is expected to show a clear asymmetrical distribution of reads mapping to the forward and reverse strands around the midpoint (peak) of accumulated reads. This signal should be large compared with the signal of the same region from the control library. Of course it is not feasible to inspect the whole genome in this manner, and evaluating a limited number of the strongest sites may overestimate the quality of the entire data set (Supplemental Fig. S2). The genome-wide metrics discussed below provide more objective and global assessments.
Measuring global ChIP enrichment (FRiP)
For point-source data sets, we calculate the fraction of all mapped reads that fall into peak regions identified by a peak-calling algo-rithm (Ji et al. 2008). Typically, a minority of reads in ChIP-seq experiments occur in significantly enriched genomic regions (i.e., peaks); the remainder of the read represents background. The fraction of reads falling within peak regions is therefore a useful and simple first-cut metric for the success of the immunoprecipi-tation, and is called FRiP (fraction of reads in peaks). In general, FRiP values correlate positively and linearly with the number of called regions, although there are exceptions, such as REST (also known as NRSF) and GABP, which yield a more limited number of Box 2: ChIP experimental design guidelines
Sequencing and library complexity
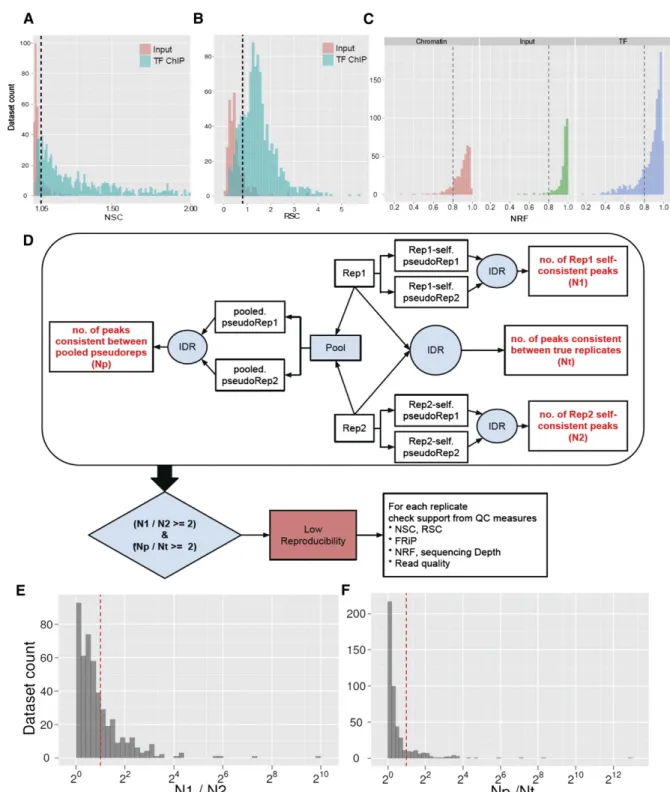
For each ChIP-seq point-source library, ENCODE’s goal is to obtain $10 million uniquely mapping reads per replicate experiment for mammalian genomes, with a target NRF (nonredundancy fraction) $0.8 for 10 million reads. The corresponding objective for modENCODE point-source factors is to obtain $2 M uniquely mapped reads per replicate, $0.8 NRF. The modENCODE target for broad-source ChIP-seq in Drosophila is $5 million reads, and the ENCODE provisional target for mammalian broad-source histone marks is $20 million uniquely mapping reads at NRF $0.8. The distribution of NRF values for all ENCODE data sets is shown in Figure 7.
Control libraries
ENCODE generates and sequences a control ChIP library for each cell type, tissue, or embryo collection and sequences the library to the appropriate depth (i.e., at least equal to, and preferably greater than, the most deeply sequenced experimental library). If cost constraints allow, a control library should be prepared from every chromatin preparation and sonication batch, although some circumstances can justify fewer control libraries. Importantly, a new control is always performed if the culture conditions, treatments, chromatin shearing protocol, or instrumentation is significantly modified.
Reproducibility
Experiments are performed at least twice to ensure reproducibility. For ENCODE data to pass criteria for submission, concordance is determined from analysis using the IDR methodology (current ENCODE criteria are in Box 3), and a third replicate is performed if the standard is not reached. Cut-offs for identifying highly reproducible peaks for use in subsequent analyses can be determined by IDR (typically using a 1% threshold).
called regions but display very high enrichment (Fig. 4C). Most (787 of 1052) ENCODE data sets have a FRiP enrichment of 1% or more when peaks are called using MACS with default parameters. The ENCODE Consortium scrutinizes experiments in which the FRiP falls below 1%.
The 1% FRiP guideline works well when there are thousands to tens of thousands of called occupancy sites in a large mammalian genome. However, passing this threshold does not automatically mean that an experiment is successful and a FRiP below the threshold does not automatically mean failure. For example, ZNF274 and hu-man RNA polymerase III have very few true binding sites (Frietze et al. 2010; Raha et al. 2010), and a FRiP of <1% is obtained. At the other extreme, ChIP experiments using antibody/factor pairs capable of generating very high enrichment (such as REST and GABP men-tioned above) and/or binding-site numbers (CTCF, RAD21, and others) can result in FRiP scores that exceed those obtained for most factors (Fig. 5C), even for experiments that are suboptimal. Thus, FRiP is very useful for comparing results obtained with the same antibody across cell lines or with different antibodies against the same factor. FRiP is sensitive to the specifics of peak calling, in-cluding the way the algorithm delineates regions of enrichment and the parameters and thresholds used. Thus, all FRiP values that are compared should be derived from peaks uniformly called by a single algorithm and parameter set.
Cross-correlation analysis
A very useful ChIP-seq quality metric that is independent of peak calling is strand cross-correlation. It is based on the fact that a high-quality ChIP-seq experiment produces significant clustering of enriched DNA sequence tags at locations bound by the protein of interest, and that the sequence tag density accumulates on forward and reverse strands centered around the binding site. As illustrated in Figure 5D, these ‘‘true signal’’ sequence tags are positioned at a distance from the binding site center that depends on the fragment size distribution (Kharchenko et al. 2008). A control experiment, such as sequenced input DNA, lacks this pattern of shifted stranded tag densities (Supplemental Fig. S1). This has made it possible to develop a metric that quantifies fragment clustering (IP enrich-ment) based on the correlation between genome-wide stranded tag densities (A Kundaje, Y Jung, P Kharchenko, B Wold, A Sidow, S Batzoglou, and P Park, in prep.). It is computed as the Pearson linear correlation between the Crick strand and the Watson strand, after shifting Watson by k base pairs (Fig. 5E). This typically pro-duces two peaks when cross-correlation is plotted against the shift value: a peak of enrichment corresponding to the predominant fragment length and a peak corresponding to the read length (‘‘phantom’’ peak) (Fig. 4E; Heinz et al. 2010; A Kundaje, Y Jung, P Kharchenko, B Wold, A Sidow, S Batzoglou, and P Park, in prep.).
The normalized ratio between the fragment-length cross-correlation peak and the background cross-cross-correlation (normalized strand coefficient, NSC) and the ratio between the fragment-length peak and the read-fragment-length peak (relative strand correlation, RSC) (Fig. 4G), are strong metrics for assessing signal-to-noise ra-tios in a ChIP-seq experiment. High-quality ChIP-seq data sets tend to have a larger fragment-length peak compared with the read-length peak, whereas failed ones and inputs have little or no such peak (Figs. 4G, 5A,B; Fig. 7, below). In general, we observe a continuum between the two extremes, and broad-source data sets are expected to have flatter cross-correlation profiles than point-sources, even when they are of very high quality. As expected, the NSC/RSC and FRiP metrics are strongly and positively correlated for the majority of experiments (Fig. 4F). As with the other quality metrics, even high-quality data sets generated for factors with few genuine binding sites tend to produce relatively low NSCs.
These measures form the basis for one of the current quality standards for ENCODE data sets. We repeat replicates with NSC values <1.05 and RSC values <0.8 and, if additional replicates produce low values, we include a note with the reported data set (Box 3). We illustrate the application of our ChIP-seq quality metrics to a failed pair of replicates in Figure 5, A–E. Initially, two EGR1 ChIP-seq replicates were generated in the K562 cell line. Based on the cross-correlation profiles, FRiP score, and number of called regions, these replicates were flagged as marginal in quality. The experiments were repeated, with all quality control metrics improving considerably. On this basis, the superior measurements replaced the initial ones in the ENCODE database.
Consistency of replicates: Analysis using IDR
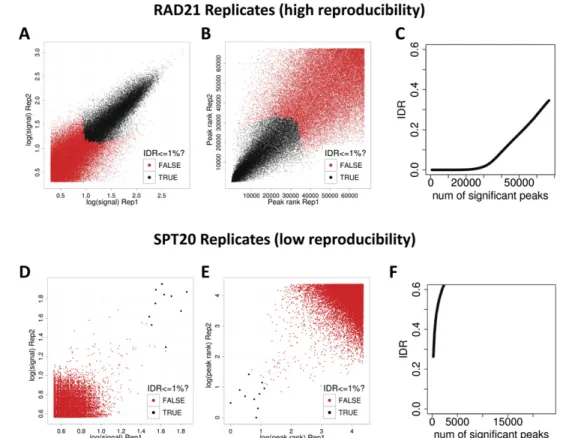
As noted above, the modENCODE and ENCODE consortia gener-ate two independent biological replicgener-ates, with each experiment passing the basic quality control filters. As another measure of experiment quality, we take advantage of the reproducibility in-formation provided by the duplicates using the IDR (irreproducible discovery rate) statistic that has been developed for ChIP-seq (Li et al. 2011; discussed in detail in A Kundaje, Q Li, B Brown, J Rozowsky, A Harmanci, S Wilder, S Batzoglou, I Dunham, M Gerstein, E Birney, et al., in prep.).
Given a set of peak calls for a pair of replicate data sets, the peaks can be ranked based on a criterion of significance, such as the P-value, the q-value, the ChIP-to-input enrichment, or the read coverage for each peak (Fig. 6A–E). If two replicates measure the same underlying biology, the most significant peaks, which are likely to be genuine signals, are expected to have high consistency between replicates, whereas peaks with low significance, which are more likely to be noise, are expected to have low consistency. If the consistency between a pair of rank lists that contains both
signif-Figure 4. Criteria for assessing the quality of a ChIP-seq experiment. (A) Library complexity. Individual reads mapping to the plus (red) or minus strand (blue) are represented. (B) Distribution of functional regulatory elements with respect to the strength of the ChIP-seq signal. ChIP-seq was performed against myogenin, a major regulator of muscle differentiation, in differentiated mouse myocytes. While many extensively characterized muscle regulatory elements exhibit strong myogenin binding, a large number of known functional sites are at the low end of the binding strength continuum. (C ) Number of called peaks vs. ChIP enrichment. Except in special cases, successful experiments identify thousands to tens of thousands of peaks for most TFs and, depending on the peak finder used, numbers in the hundreds or low thousands indicate a failure. Peaks were called using MACS with default thresholds. (D) Generation of a cross-correlation plot. Reads are shifted in the direction of the strand they map to by an increasing number of base pairs and the Pearson correlation between the per-position read count vectors for each strand is calculated. Read coverage as wigglegram is represented, not to the same scale in the top and bottom panels.) (E ) Two cross-correlation peaks are usually observed in a ChIP experiment, one corresponding to the read length (‘‘phantom’’ peak) and one to the average fragment length of the library. (F ) Correlation between the fraction of reads within called regions and the relative cross-correlation coefficient for 1052 human ChIP-seq experiments. (G ) The absolute and relative height of the two peaks are useful determinants of the success of a ChIP-seq experiment. A high-quality IP is characterized by a ChIP peak that is much higher than the ‘‘phantom’’ peak, while often very small or no such peak is seen in failed experiments.
Figure 5. Quality control of ChIP-seq data sets in practice. EGR1 ChIP-seq was performed in K562 cells in two replicates. ChIP enriched regions were identified using MACS. However, the cross-correlation plot profiles (A) indicated that both IPs were suboptimal, with one being unacceptable. In agreement with this judgment, ChIP enrichment (C ) and peak number (D) also indicated failure. The ChIP-seq assays were repeated (B), with all quality control metrics improving significantly (B,D), and many additional EGR1 peaks were identified as a result. (E ) Representative browser snapshot of the four EGR1 ChIP-seq experiments, showing the much stronger peaks obtained with the second set of replicates. (F ) Distribution of EGR1 motifs relative to the
icant and insignificant findings is plotted, a transition in consis-tency is expected (Fig. 6C,F). This consisconsis-tency transition provides an internal indicator of the change from signal to noise and suggests how many peaks have been reliably detected.
The IDR statistic quantifies the above expectations of con-sistent and inconcon-sistent groups by modeling all pairs of peaks present in both replicates as belonging to one of two groups: a re-producible group, and an irrere-producible group (Li et al. 2011). In general, the signals in the reproducible group are more consistent (i.e., have a larger correlation coefficient) and are ranked higher than the irreproducible group. The proportion of identifications that belong to the ‘‘noise’’ component and the correlation of the significant component are estimated adaptively from the data. The IDR provides a score for each peak, which reflects the posterior probability that the peak belongs to the irreproducible group.
A major advantage of IDR is that it can be used to establish a stable threshold for called peaks that is more consistent across laboratories, antibodies, and analysis protocols (e.g., peak callers) than are FDR measures (A Kundaje, Q Li, B Brown, J Rozowsky, A Harmanci, S Wilder, S Batzoglou, I Dunham, M Gerstein, E Birney, et al., in prep.). Increased consistency comes from the fact that IDR uses information from replicates, whereas the FDR is computed on each replicate independently. The application of IDR to real-life data is shown in Figure 6. A pair of high-quality RAD21 ChIP-seq repli-cates display good consistency between IDR ranks for a large number (;28,000) of highly reproducible peaks (Figs. 6A,B), with a clear in-flection between the signal and noise populations near the 1% IDR value (Fig. 6C). In contrast, a pair of SPT20 replicates, which had already been flagged as low-quality based on the individual FRiP and NSC/RSC metrics, display very low IDR reproducibility, with very few significant peaks, and no visible inflection in the IDR curve (Fig. 6F).
It is important that the peak-calling threshold used prior to IDR analysis not be so stringent that the noise component is entirely unrepresented in the data, because the algorithm requires sampling of both signal and noise distributions to separate the peaks into two groups; thus relaxing the default stringency settings when running a given peak caller is advised if IDR analysis will follow.
A caution in applying IDR is that it is dominated by the weakest replicate (A Kundaje, Q Li, B Brown, J Rozowsky, A Harmanci, S Wilder, S Batzoglou, I Dunham, M Gerstein, E Birney, et al., in prep.). That is, if one replicate is quite poor, many ‘‘good’’ peaks from the higher quality replicate will be rejected by IDR analysis, because they are not reproducible in the weak replicate. To ensure similar weighting of individual replicates, the number of significant binding regions identified using IDR on each individual replicate (obtained by partitioning reads into two equal groups to allow the IDR analysis) is recommended to be within a factor of 2 for data sets to be submitted to UCSC by ENCODE (Box 3).
ENCODE has begun applying IDR analysis to all ChIP ex-periments. For all submitted ENCODE ChIP-seq data sets, the number of bound regions identified in an IDR comparison be-tween replicates is at least 50% of the number of regions identified in an IDR comparison between two ‘‘pseudoreplicates’’ generated by randomly partitioning available reads from all replicates (Box 3).
Guidelines for reporting ChIP-seq data
To facilitate data sharing among laboratories, both within and outside the Consortium, and to ensure that results can be repro-duced, ENCODE has established guidelines for data sharing in public repositories. Raw data can be submitted to the Short Read Archive (SRA) and ChIP results are submitted to GEO. Through Box 3: ChIP-seq quality assessment guidelines
Within ENCODE, a set of data quality thresholds has been established for submission of ChIP-seq data sets. These have been constructed based on the historical experiences of ENCODE ChIP-seq data production groups with the purpose of balancing data quality with practical attainability and are routinely revised. The current standards are below and the performance of ENCODE data sets against these thresholds is shown in Figure 7. Cross-correlation analysis
The current ENCODE practice is to calculate and report NSC and RSC for each experiment. For experiments with NSC values below 1.05 and RSC values below 0.8, we currently recommend that an additional replicate be attempted or the experiment explained in the data submission as adequate based on additional considerations.
Irreproducible discovery rate (IDR)
The following guidelines have been established for mammalian cells (optimal parameter may differ for other organisms). Biological replicates are performed for each ChIP-seq data set and subjected to peak calling. IDR analysis is then performed with a 1% threshold. For submission to ENCODE, we currently require that the number of bound regions identified in an IDR comparison between replicates to be at least 50% of the number of regions identified in an IDR comparison between two ‘‘pseudoreplicates’’ generated by pooling and then randomly partitioning all available reads from all replicates (Np/Nt < 2) (Fig. 7). To ensure similar weighting of individual replicates for identifying binding regions, we further recommend that the number of significant peaks identified using IDR on each individual replicate (obtained by partitioning reads into two equal groups for the IDR analysis) be within a factor of 2 of one another (N1/N2 < 2) (Fig. 7). Data sets which fail to meet these criteria may still be deposited by ENCODE experimenters, provided that at least three experimental replicates have been attempted and a note accompanies these data sets explaining which parameters fail to meet the standards and providing any technical information that may explain this failure. This guideline is for point source features; metrics are still being determined for broad peak analyses.
Updated information about the performance of ENCODE data sets against these quality metrics and tools for determining these metrics will be forthcoming through the ENCODE portal (http://encodeproject.org/ENCODE/).
Historical note
A simpler heuristic for establishing reproducibility was previously used as a standard for depositing ENCODE data and was in effect when much of the currently available data was submitted. According to this standard, either 80% of the top 40% of the targets identified from one replicate using an acceptable scoring method should overlap the list of targets from the other replicate, or target lists scored using all available reads from each replicate should share more than 75% of targets in common. As with the current standards, this was developed based on experience with accumulated ENCODE ChIP-seq data, albeit with a much smaller sample size.
April 2012, 478 ChIP-seq data sets had been submitted to GEO at accession ID PRJNA63441, with submission of all current ENCODE data to be completed by June 2012. UCSC houses the ENCODE data (Rosenbloom et al. 2011) and modMine houses the modENCODE data (Contrino et al. 2011).
Box 4 provides a detailed description of the data and experi-mental and analytical details to be shared so that others can re-produce both experiments and analyses. Shared information includes the experimental procedures for performing the ChIP, antibody in-formation and validation data, as well as relevant DNA sequencing, peak calling, and analysis details. For ENCODE experiments that do not meet the guidelines described above, data and results may be reported, with a note indicating that the criteria have not been met and explaining why the data are nevertheless released.
Discussion
The ENCODE and ModENCODE standards and practices presented here will be further revised as the protocols, technologies, and our understanding of the assays change. Updated versions will be re-leased and made available at http://encodeproject.org/ENCODE/ experiment_guidelines.html. We have begun to address the central but vexing issue of immune reagent specificity and performance by establishing a menu of primary and secondary methods for antibody characterization, including performance-reporting prac-tices. We also developed and applied global metrics to assess the
quality of several aspects of an individual ChIP-seq experiment: Library complexity can be measured by the nonredundant fraction (NRF); immunoenrichment can be measured by the fraction of reads in called peaks (FRiP) and by cross-correlation analysis (NSC/RSC); and replicate significance can be measured by IDR. We related these global quality measures to more traditional inspection of ChIP-seq browser tracks (Fig. 5) and discuss below how different aspects of data quality interact with specific uses of ChIP-seq data.
How good can a ChIP-seq experiment be?
Thus far, the most successful point-source factor experiments for ENCODE have FRiP values of 0.2–0.5 (factors such as REST, GABP, and CTCF) (Fig. 4C) and NSC/RSC values of 5–12. Al-though these quality scores and characteristics were routinely obtained for the best-performing factor/antibody combinations, they are not the rule; for most transcription factors, the ChIP quality metrics were substantially lower and more variable (Fig. 7). We believe that multiple issues contribute to the variability; the quality of antibody (affinity and specificity) is surely important, but epitope availability within fixed chromatin, sensitivity of the anti-body to post-translational modifications of the antigen, how long and how often the protein is bound to DNA, and other physical charac-teristics of the protein–DNA interaction likely also contribute. Further work with epitope-tagged factors, for which the antibody is not a variable, should begin to sort among the possibilities.
Figure 6. The irreproducible discovery rate (IDR) framework for assessing reproducibility of ChIP-seq data sets. (A–C ) Reproducibility analysis for a pair of high-quality RAD21 ChIP-seq replicates. (D,E ) The same analysis for a pair of low quality SPT20 ChIP-seq replicates. (A,D) Scatter plots of signal scores of peaks that overlap in each pair of replicates. (B,E ) Scatter plots of ranks of peaks that overlap in each pair of replicates. Note that low ranks correspond to high signal and vice versa. (C,F ) The estimated IDR as a function of different rank thresholds. (A,B,D,E ) Black data points represent pairs of peaks that pass an IDR threshold of 1%, whereas the red data points represent pairs of peaks that do not pass the IDR threshold of 1%. The RAD21 replicates show high reproducibility with ;30,000 peaks passing an IDR threshold of 1%, whereas the SPT20 replicates show poor reproducibility with only six peaks passing the 1% IDR threshold.


![[PDF] Tutoriel Programmation en langage C pdf](data:image/gif;base64,R0lGODlhAQABAIAAAP///wAAACH5BAEAAAAALAAAAAABAAEAAAICRAEAOw==)