HAL Id: hal-02649419
https://hal.inrae.fr/hal-02649419
Submitted on 29 May 2020HAL is a multi-disciplinary open access archive for the deposit and dissemination of sci-entific research documents, whether they are pub-lished or not. The documents may come from teaching and research institutions in France or abroad, or from public or private research centers.
L’archive ouverte pluridisciplinaire HAL, est destinée au dépôt et à la diffusion de documents scientifiques de niveau recherche, publiés ou non, émanant des établissements d’enseignement et de recherche français ou étrangers, des laboratoires publics ou privés.
Antioxidant properties and composition of deodorized
extracts of Tussilago farfara L.
Diana Dobravalskyte, Petras Rimantas Venskutonis, Thierry Talou, Bachar
Zebib, Othmane Merah, Ona Ragazinskiene
To cite this version:
Diana Dobravalskyte, Petras Rimantas Venskutonis, Thierry Talou, Bachar Zebib, Othmane Merah, et al.. Antioxidant properties and composition of deodorized extracts of Tussilago farfara L.. Records of Natural Products, ACG Publications, 2013, 7 (3), pp.201-209. �hal-02649419�
The article was published by Academy of Chemistry of Globe Publications www.acgpubs.org/RNP © Published 5/28/2013 EISSN:1307-6167
Rec. Nat. Prod. 7:3 201-209
Antioxidant Properties and Composition of Deodorized Extracts
of Tussilago farfara L.
Diana Dobravalskytė
1,2, Petras Rimantas Venskutonis
1*, Thierry Talou
2,3,
Bachar Zebib
2,3, Othmane Merah
2and Ona Ragažinskienė
41
Department of Food Technology, Kaunas University of Technology, Radvilėnų pl. 19, Kaunas LT-50254, Lithuania
2
Université de Toulouse, INP-ENSIACET, LCA (Laboratoire de Chimie Agro industrielle), F 31030 Toulouse, France
3
INRA, UMR 1010 CAI, F 31030 Toulouse, France
4
Vytautas Magnus University, Kaunas Botanical Garden,Žilibero 6, LT-46324 Kaunas, Lithuania
(Received January 31, 2013; Revised March 8, 2013; Accepted March 9, 2013)
Abstract: Residues obtained after isolating essential oil very often constitute more than 99% of the total raw material. Such residues are poorly exploited although they may represent a potential sustainable source for valuable natural products. This study investigated antioxidant properties and the composition of bioactive compounds (total phenolics, flavonoids, flavonols) present in the deodorized extracts of Tussilago farfara flowers and stems collected in Lithuania and South of France, which were isolated with acetone, methanol or ethanol. Online HPLC/UV/DPPH scavenging assay showed that among 8 identified by HPLC/MS compounds, dicaffeoylquinic acids and quercetin pentoside were the major radical scavengers in the T. farfara extracts. Keywords: Tussilago farfara L.; Deodorized extracts; Antioxidants; Radical-scavenging capacity.
1. Introduction
There is an increasing demand for natural bioactive compounds which may be used in foods, nutraceuticals, pharmaceuticals, cosmetics and other products; therefore comprehensive bio-prospecting, i.e. collection, investigation and utilisation of diverse biological resources remain an important scientific and practical task. Plant kingdom is a tremendous renewable resource of biologically active compounds, whereas biodiversity of plant chemical profiles offers a vast list of phytochemicals which has to be properly assessed. Therefore, the studies of plant chemical composition and discovery of new components are of great interest for scientists and society [1]. The processing of plant origin raw materials results in the production of by-products that may be rich sources of natural products, including antioxidatively active phenolic compounds [2]. The availability of phenolic compounds from agricultural and industrial residues, their extraction and antioxidant activity were reviewed more than 10 years ago [3]. Phenolic compounds with antioxidant activity were reported in various agricultural by-products, such as rice [4], buckwheat [5] and almond hulls [6].
*
Deodorized extracts of Tussilago farfara L. 202
The residues obtained during essential oil distillation may constitute up to 99.5% of the raw material and therefore represent a potential source for antioxidants and other valuable substances, however currently such residues are under exploited. The content of phenolic and other valuable compounds in plants depends on several factors, such as cultivation zone, climatic conditions, vegetation phase, genetic pecularities. Therefore, the composition and the quality of plant material grown in various sites and geographical zones may be remarkably different [7]. Tussilago farfara (Asteraceae), commonly called coltsfoot has been traditionally used as a medicinal herb to treat lung ailments, such as asthma as well as various coughs by way of smoking. T. farfara leaves and flowers possess expectorant activity and are used for chronic dry cough and various pulmonary diseases [8]. Volatile constituents of T. farfara were studied previously, while to the best of our knowledge the residues remaining after their distillation from the plant were not evaluated until now [9-10]. The extracts of T. farfara were shown to exhibit various activities, such as antioxidant and antimicrobial as well as inhibitory effects on NO synthesis in LPS-activated macrophage and diacylglycerol acyltransferase activity [11-12]. Some phenolics, mucopolysaccharides and water-soluble polysaccharides were isolated from the flower buds of T. farfara [13], however the presence of flavonoids has not been reported until now.
It should be noted that besides beneficial bioactive compounds present in the herb, it was found to contain toxic pyrrolizidine alkaloids (PAs), mainly senkirkine, which was recognised by The International Agency for Research on Cancer (IARC) as possessing "sufficient or limited evidence" for the carcinogenicity [14]. As a result, in order to minimize the amount of toxic PAs ingested, the German health authorities limited the daily intake of toxic PAs to 1 µg [15].Most recently Committee on Herbal Medicinal Products recommended to keep exposure to PAs as low as practically achievable, as recommended by IPCS 1988, EFSA 2007, BfR 589 2007 [16]. To achieve this requirement some free of the toxic compounds T. farfara clones were selected and introduced [17].
Deodorized plant residues may contain a number of bioactive compounds, which was shown by the studies of some other species [18]. So far as there is no information on the properties of T. farfara by-products, the main aim of this study was to evaluate the antioxidant potential of T. farfara deodorized residues obtained after hydrodistillation of flowers and stems collected from two different geographical origins.
2. Materials and Methods 2.1. Plant material
The flowers and stems of coltsfoot (Tussilago farfara L.) were collected in Midi-Pyrenées (south-west of France 43° 36′ 16.2″ N/ 1° 26′ 38.4″ E) and in Kaunas Botanical Garden of Vytautas Magnus University, Lithuania (54° 52′ 14″ N/ 23° 54′ 40″ E), during April, 2010 at flowering phase. Climatic conditions in both locations were favourable for the plant development; however the mean temperature and the amount of rainfalls were higher in Midi-Pyrenées (10.5°C and 971 mm) than in Kaunas (6.9°C and 340 mm). The plants were dried at ambient temperature in a ventilated room. 2.2. Preparation of extracts
The volatile compounds were removed by hydrodistillation and the remaining solid residue was dried at 30 °C and extracted with acetone, methanol or ethanol; the extracts obtained are further referred as AE, ME and EE, respectively. The yield of the extracts varied from 10.3 to 12.8% (w/w). The extractions were performed in triplicate.
2.3. DPPH• radical scavenging assay
Radical scavenging capacity (RSC) of T. farfara extracts against stable 2.2-diphenyl-2-picrylhydrazyl hydrate (DPPH•, Sigma-Aldrich Chemie, Steinheim, Germany) was determined on a UV/Vis spectrophotometer Spectronic Genesys 8 (Rochester, USA) at 515 nm by a slightly modified method of Brand-Williams and co-workers [19]. Extract solutions were prepared by dissolving dry T.
farfara extract in methanol. The solution of DPPH• in methanol (6.5×10⁻⁵ M) was prepared daily before measurements. Two mL of this solution were mixed with 50 µL of extract solution in a 1 cm path length microcuvette and after 30 min the decrease in absorbance was read. Blank sample with the same amount of methanol and DPPH• was prepared and measured daily. The RSC was calculated by the following formula: I=[(AB-AA)/AB]×100, where I is DPPH• inhibition, %; AB is the absorbance of a blank sample (t=0 min); AA is the absorbance of extract solution (t=30 min). The amount of extract required to decrease the initial DPPH• concentration in the reaction by 50% is referred as an effective concentration, IC50. The measurements were carried out in triplicate for each solvent.
2.4. ABTS•+ radical cation decolourisation assay
The RSC of extracts was also measured by ABTS•+ radical cation assay [20]. Stock solution of ABTS (2 mM) was prepared by dissolving in 50 mL of phosphate buffered saline (PBS) obtained by dissolving 8.18 g NaCl, 0.27 g KH2PO4, 1.42 g Na2HPO4 and 0.15 g KCl in 1 L of ultra-pure water. If
the pH was lower than 7.4, it was adjusted with NaOH. Ultra-pure water was used to prepare 70 mM solution of K2S2O8. ABTS
•+
radical cation was produced by reacting 50 mL of ABTS stock solution with 200 µL of K2S2O8 solution and allowing the mixture to stand in the dark at room temperature for
15–16 h before use. The radical was stable in this form for more than 2 days when stored in the dark at room temperature. For the assessment of extracts, ABTS•+ solution was diluted with PBS to obtain the absorbance of 0.800±0.030 at 734 nm. Three mL of ABTS•+ solution were mixed with 30 µL ethanol solution of T. farfara extract in 1 cm path length microcuvette. The absorbance was read at ambient temperature after 1, 4, 6 and 10 min. PBS solution was used as a blank sample. All determinations were performed in triplicate. The percentage decrease of the absorbance at 734 nm was calculated by the formulae: I=[(AB-AA)/AB] × 100, where I is ABTS•+ inhibition, %; AB is the absorption of blank sample (t=0 min); AA is the absorption of extract solution (t=10 min). The RSC was expressed as a percentage of inhibition of Trolox (6-hydroxy-2.5.7.8-tetramethylchroman-2-carboxylic acid) mM equivalent per 1000 g using prepared calibration curve. The extent of quenching of ABTS•+ radical by extracts was compared with standard amounts of Trolox. The concentrations of Trolox standard used for calibration curve were 0.001, 0.01, 0.1, 0.5, 1, 1.5 mM/L.
2.5. Ferric reducing antioxidant power (FRAP)
The ability of plant extracts to reduce ferric ion (FRAP assay) is another indicator frequently used for assessing antioxidant power [21]. Ferrous ion (Fe2+) produced in this assay forms a blue complex (Fe2+/TPTZ) absorbing at 593 nm. Briefly, the reagent was prepared by mixing acetate buffer (300 mM, pH 3.6), a solution of 10 mM TPTZ in 40 mM HCl, and 20 mM FeCl3×6H2O at 10:1:1 (v/v/v).
Firstly, 300 µL of freshly prepared FRAP reagent was heated to 37 °C and an absorbance (A0) of a
blank reagent was read at 593 nm in a Biotek EL808 microplate reader (Vermont, USA). Then 10 µL of 0.1% extract solution in water and 30 µL H2O were added (final dilution of samples in the reaction
mixture was 1:34) and the absorbance (A) was recorded every 1 min during the whole monitoring period which lasted up to 30 min. The change in the absorbance (∆A593 nm) between the final reading and A0 was calculated for each sample and related to the ∆A593 nm of a Fe
2+
reference solution which was measured simultaneously.
2.6. Determination of total phenolic compounds (TPC)
The content of TPC in extracts was determined with Folin–Ciocalteu reagent [22]. Calibration curve was prepared by using 1 mL reference gallic acid solutions in ethanol (0.025, 0.075, 0.100, 0.175 and 0.350 mg/mL), which were mixed with 5 mL of a standard Folin-Ciocalteu reagent and diluted with distilled water (1:10) and 4 mL of 7.5% sodium carbonate solution in distilled water. The absorption was read after 30 min at 765 nm. The concentration of TPC was expressed in mg of gallic acid equivalents (GAE) per g of plant extract.
Deodorized extracts of Tussilago farfara L. 204
2.7. Determination of flavonoids
The percentage of flavonoids was measured using rutin as a reference [23]. One mL of plant extract solution in 95% ethanol (10 g/L) and 1 mL of aluminum trichloride solution in 95% ethanol (20 g/L) were pipetted into a 25 mL volumetric flask and made up with 95% ethanol. The absorbance was read at 415 nm after 40 min at 20 °C. Blank samples were prepared from the mixture of 1 mL of plant extract and 1 drop of diluted acetic acid. The absorbance of a reference solution, which was prepared by using 1 mL of rutin solution instead of plant extract, was measured simultaneously. Rutin solution was prepared from 0.05 g of dried at 130-150 °C for 3 h rutin, which was diluted in 100 mL of 95% ethanol. All determinations were performed in triplicate. The percentage of flavonoids in plant extracts was calculated by formula: X=(A×mo×100×10)/(Ao×m×100), where A is the absorbance of
extract; Ao is the absorbance of rutin; m is the weight of pure extract (g); mo is the weight of rutin (g).
2.8. Determination of flavonols
The content of flavonols was determined by the previously reported method [24]. Series of reference rutin solutions containing 0.05, 0.1, 0.15, 0.2, 0.3, 0.4, and 0.5 mg/mL of rutin were prepared. Two mL of reference were mixed with 2 mL of aluminum trichloride solution (20 g/L) in 95% ethanol and 6 mL of sodium acetate solution in ethanol (50 g/L) were added. The absorbance was read at 440 nm after 2.5 h at 20 °C and the calibration curve on the dependence of the absorbency on the concentration of rutin was drawn. Plant extract samples were prepared under the same conditions by using 2 mL of extract (10 g/L) in 95% ethanol instead of rutin. All determinations were performed in triplicate. The percentage of flavonols was calculated by the formula: X=(C×V×100)/(m×100), where C is the concentration of rutin, determined form the calibration curve (mg/mL); V is the volume of plant extract (mL); m is the weight of pure plant extract (g).
2.9. On-line radical scavenging assay (HPLC/UV/DPPH•)
The extracts were analyzed on a HPLC/UV system supplemented with DPPH• radical scavenging detector. Two chromatograms were recorded simultaneously, one of which representing UV absorbance of effluent at 265 nm prior to the reaction, while a mirror chromatogram was obtained at 517 nm after reaction of the effluent with DPPH• solution in the reaction coil. The mobile phase was supplied to the column by a model 9012 HPLC gradient pump (Varian, USA) at a flow rate 0.75 mL/min. The samples (20 µL) were injected into the HPLC system by means of Cheminert C1 injector (Valco Instruments, USA). Reverse-phase LiChroSpher RP-18e 5 µm 12.5×0.4 cm column and 0.5×0.4 cm precolumn (Merck, Germany) were used for separation. The DPPH• reagent was prepared by dissolving 0.01 M DPPH• in 0.1 M sodium citrate buffer (pH=7.6), methanol and acetonitrile (50:25:25 v/v). It was continuously supplied into a reaction coil (3 m of 0.25 mm id fused-silica capillary) by a model 2200 HPLC pump (Bischoff, Germany) at a flow rate of 0.75 mL/min. The signals were acquired at 265 and 517 nm wavelengths by means of Linear 206 PHD and Linear UVIS 200 UV-VIS detectors, respectively. Solution A (bidistilled water with 0.05% TFA) and B (methanol with 0.05% TFA) were used as a mobile phase components for gradient elution. The extracts were separated using the following gradient: 10% of B at 0 min, 25% of B at 5 min, 40% of B at 25 min. 95% of B at 40 min. 95 % of B at 43 min and 10% of B at 44 min. Clarity chromatography software (DataApex. Czech Republic) was used for data acquisition.
2.10. LC-MS analysis
LC system consisted of a Thermo-Fisher Spectra System (TFSP, San Jose, CA) P1000XR pump, a TFSP 6000LP Photodiode Array Detector and a TFSP AS 3000 autosampler. Separation of compounds was performed on a Varian Pursuit XRs 5 C18 column (250 mm×4.6 mm ID, 5 µm) using a linear gradient of 0–30 min., 3–97% of acetonitrile (A) to bidistilled water with 0.1% TFA (v/v) (B), 30–35 min., 20–80% of A to B, 35-45 min., 3-97% of A to B. Flow rate was 1 mL/min and 10 µL of the sample was injected.
Mass spectra were acquired using a Thermo-Fisher LCQ mass spectrometer (Finnigan MAT, San Jose, CA) equipped with an atmospheric pressure chemical ionization source (APCI) using both positive and negative ion mode. The APCI source operating parameters were as follows: the capillary and APCI vaporizer temperatures were set to 250 °C and 450 °C, respectively, and the spray was stabilized with nitrogen sheath and auxiliary gas (80 and 25 arbitrary units, respectively). Discharge current was 5 µA and capillary voltage was +15 V and −15 V in the positive and negative ion mode, respectively. The mass spectra were acquired in the data dependent mode with wideband activation (i.e. the most intense ion obtained for each scan in the full mass spectrum is further submitted to 38% collision energy for MS/MS).
2.11. Statistical analysis
For antioxidant activity measurements, mean values and standard deviations were calculated from at least three replicates using MS Excel 2003. Statistical analysis was performed by using one-way analysis of the variance (ANOVA), followed by the Duncans’ post hoc test to compare the means showing significant variation (p<0.05). All the data were subjected to variance analysis using the GLM procedure of SAS [25]. Analyses were performed using MSStat (ANALYT MTC, Muehlheim, Germany, MS Statistical Software Version 3.02u); looking for differences in the plant origins.
3. Results and Discussion
3.1. Antioxidant properties of extracts in electron/hydrogen transfer based assays
DPPH• and ABTS•+ radical scavenging and FRAP assays were used for assessing antioxidant activity of T. farfara extracts (Table 1). These methods are simple and widely used for the fast screening of plant antioxidant properties and they provide quite reliable preliminary information on the presence of antioxidatively active constituents in the extracts. In general, the reaction is based on the ability of radicals to accept either an electron or hydrogen atom. The extracts were isolated consecutively by using increasing polarity solvents, acetone, methanol or ethanol. Ethanol and methanol are quite similar protonic solvents; however both of them were tested because ethanol is more acceptable for the isolation of food and pharmaceutical grade ingredients. The results demonstrated that extract RSC was dependent on the solvent polarity, the type of free radical used in the reaction and the origin of plant material. The IC50 values of T. farfara extracts in DPPH
•
assay were from 0.15 (EE) to 0.27 (AE) mg/mL for the extracts isolated from the plants grown in Lithuania and 0.22 (EE) to 0.39 (AE) mg/mL for the plants grown in France, showing that EE possessed stronger RSC than AE and ME in this assay. In this case the extracts isolated with polar solvents were stronger DPPH• radical scavengers, which is in agreement with previously published results [26-28]. However, EE extracts were less effective in scavenging ABTS•+ than AE and ME. Although the principle of DPPH• and ABTS•+ assays is similar, the latter is applicable both for lipophilic and hydrophilic antioxidants; in addition DPPH• can be dissolved only in organic solvents (e.g., methanol), while ABTS•+ is soluble in both aqueous and organic media. Therefore, ABTS•+ assay can be performed in hydrophilic and lipophilic systems [20].
FRAP assay is a versatile method and can be readily applied to aqueous, alcohol and acetone extracts of different plants. In this assay, the antioxidant activity is determined on the basis of the ability to reduce ferric (III) iron to ferrous (II) iron and the results are expressed in mg ferrous iron equivalents per mL of sample. In FRAP assay, similarly to ABTS•+, acetone extracts were significantly stronger antioxidants than ME and EE. The ferric reducing antioxidant power of different extracts was in the range of 0.44–0.52 mg Fe (II)/mL for Lithuanian origin plants and 0.39-0.62 mg Fe (II)/mL for French origin plants. In FRAP assay a ferric salt (Fe III) is used as an antioxidant and its redox potential (0.70 V) is comparable to that of ABTS•+ (0.68 V), therefore the results of TEAC and FRAP assays showed similar trends [29].
Deodorized extracts of Tussilago farfara L. 206
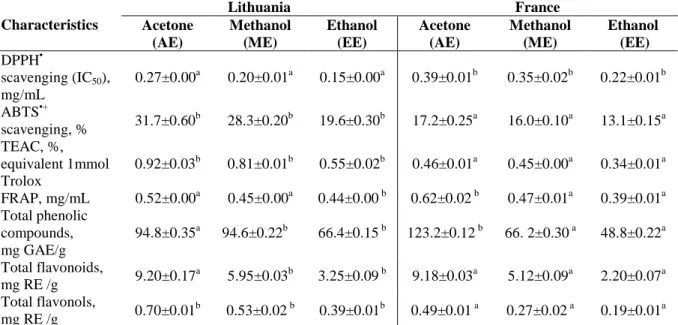
Table 1. Antioxidant characteristics, the content of total phenolic compounds, flavonoids and flavonols in the extracts isolated from T. farfara
Characteristics Lithuania France Acetone (AE) Methanol (ME) Ethanol (EE) Acetone (AE) Methanol (ME) Ethanol (EE) DPPH• scavenging (IC50), mg/mL 0.27±0.00a 0.20±0.01a 0.15±0.00a 0.39±0.01b 0.35±0.02b 0.22±0.01b ABTS•+ scavenging, % 31.7±0.60 b 28.3±0.20b 19.6±0.30b 17.2±0.25a 16.0±0.10a 13.1±0.15a TEAC, %, equivalent 1mmol Trolox 0.92±0.03b 0.81±0.01b 0.55±0.02b 0.46±0.01a 0.45±0.00a 0.34±0.01a FRAP, mg/mL 0.52±0.00a 0.45±0.00a 0.44±0.00 b 0.62±0.02 b 0.47±0.01a 0.39±0.01a Total phenolic compounds, mg GAE/g 94.8±0.35a 94.6±0.22b 66.4±0.15 b 123.2±0.12 b 66. 2±0.30 a 48.8±0.22a Total flavonoids, mg RE /g 9.20±0.17 a 5.95±0.03b 3.25±0.09 b 9.18±0.03a 5.12±0.09a 2.20±0.07a Total flavonols, mg RE /g 0.70±0.01 b 0.53±0.02 b 0.39±0.01b 0.49±0.01 a 0.27±0.02 a 0.19±0.01a Superscript letters indicate if the values for the extracts isolated with the same solvent from Lithuanian and French origin plants are statistically different
Comparing antioxidant activity indicators it may be observed that the extracts isolated from Lithuanian origin T. farfara in most cases possessed higher RSC than French origin plants, although in FRAP assay these differences were negligible. The differences in climatic conditions (the amount of rainfall during plant development was nearly three times less abundant in Lithuania than in France, the average temperature was also lower in Lithuania) might have the impact on these differences, however, other factors, such as plant chemotype, soil, sunlight may also have the impact on plant properties and composition. Determination of the effects of these factors on T. farfara properties would require special experimental design which was beyond the scope of this study.
3.2. Content of total phenolic compounds (TPC), flavonoids and flavonols
Phenolic compounds are very important plant antioxidants due to the presence of hydroxyl groups in their structure. It was established that phenolic compounds are the major constituents with antioxidant activity in many plants which are able to adsorb and neutralize the free radicals [30]. Among them flavonoids is the most abundant group of natural constituents found in various plants, which exhibit antioxidant activity through radical scavenging or chelating mechanisms [31]. The content of polyphenols, flavonoids and flavonols in the extracts isolated from two origin plants by three different solvents is presented in Table 1. The highest concentration of all three compound groups was in AE followed by ME and EE except for ME isolated from T. farfara from Lithuania; it contained similar amount of TPC to AE. It is interesting noting that AE of French origin plants contained higher amount of TPC than AE of Lithuanian origin T. farfara, while the content of TPC in ME and EE was higher in Lithuanian origin plants. However, the sums of TPC in AE+ME and AE+EE were similar (189.4 mg/g) or very close (161.2 and 171.0 mg/g) for both origin plants. So far as acetone and alcohol were used as consecutive extraction solvents it may be suggested that individual phenolic compounds are present in the plants of two origins at different proportions. The content of flavonoids, expressed in rutin equivalents was from 2.20 to 9.48 mg/g. In general, these results are in agreement with previously published data [26-27]. It is obvious that acetone does not provide exhaustive extraction of phenolic compounds, flavonoids and flavonols from the solid plant residue obtained after hydrodistillation; polar solvent should be applied as a second solvent.
The RSC and reducing capacity of plant extracts may serve as an indicator of potential antioxidant activities through the action of breaking the free radical chain by donating hydrogen atom [32]. Usually the content of TPC measured in the extracts isolated from whole plant material is in a good correlation with RSC of such extracts. However, for T. farfara extracts isolated from the
hydrodistillation residue such correlations were more complex. Strong correlation (R²) was observed between TPC, total flavonoids and FRAP; 0.8341 and 0.7964, respectively, suggesting that phenolic compounds might be important contributors to the antioxidant properties of these extracts. However, the correlation between TPC, total flavonoids and RSC was very weak, less than 0.5: in DPPH• assay 0.269 and 0.3803, respectively; in ABTS•+ assay 0.1905 and 0.3036, respectivelly. The correlation coefficient between total flavonols and FRAP (0.3368) or DPPH• (0.005)was found to be very weak, but strong correlation was observed between total flavonols and RSC in ABTS•+ assay (0.7949).
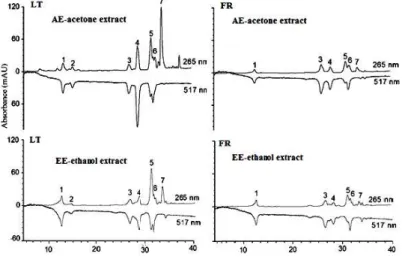
Figure 1. HPLC–UV–DPPH chromatograms of acetone (AE) and ethanol (EE) extracts of T. farfara from Lithuanian (LT) and French origin (FR).
3.3. Assessment of radical scavengers by the on-line HPLC-DPPH• method
Flavonoid glycosides quercetin-3-O-β-L-arabinopyranoside and quercetin-3-O-β-D-glucopyranoside [33] as well as quinic, chlorogenic and dicaffeoylquinic acids were reported previously in T. farfara flower bud extract from China [11]. The on-line HPLC-DPPH• method was used for the detection of radical scavenging components. The ESI-MS of the AE, ME and ET of T.
farfara extracts from two origins (Figure 1) were qualitatively different. Compounds 3 and 4 showed
[M-H]- signal at m/z 515 with fragmentation at m/z 353 and 179, from which a molecular formula C25H24O12 was assigned. The ion at m/z 353 indicated a chlorogenic acid fragment derived from the
loss of a caffeoyl group. The ion at m/z 179 indicated fragments of caffeic acid moieties. These MS data indicated that the compounds 3 and 4 were dicaffeoylquinic acid isomers. HPLC/MS data was not sufficient to determine exact isomers of dicaffeoylquinic acid; it is known that both of them are common components of T. farfara and exhibit antioxidant activity [11]. Usually, the location of the caffeoyl groups in dicaffeoylquinic are at C-3'; C-4' or C-3'; C-5'.
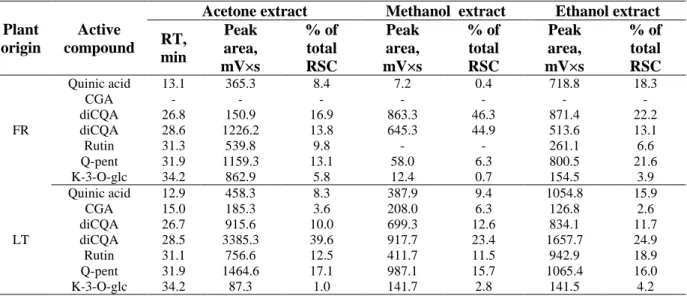
The ESI-MS of the T. farfara extracts from Lithuania gave ions corresponding to: 1-(m/z 191)-quinic acid, 2-(m/z 354)-chlorogenic acid, 3-4 (m/z 515)-dicaffeoyl191)-quinic acid, 5-(m/z 609)-quercetin-3-rutinoside (rutin), 6-(m/z 434)-quercetin-pentoside and 7-(m/z 447)-kaempferol-glucoside. In the extracts of French origin chlorogenic acid was not detected. Quinic, chlorogenic and dicaffeoylquinic acids and rutinoside were previously isolated from the flower buds of T. farfara [11], whereas, to the best of our knowledge, quercetin-pentoside and kaempferol-glucoside were not previously reported in this plant. In general, the RSC of T. farfara extracts from the plants grown in Lithuania was slightly higher than those of French origin (Table 1). The profiles of chromatograms of T. farfara extracts from different growing locations obtained by HPLC–DPPH• method were also different (Figure 1): the number of negative peaks in the extracts of Lithuanian T. farfara origin was higher. Dicaffeoylquinic acids and quercetin-pentoside were major active compounds with total RSA 39.6, 10 and 17.1% (AE from Lithuania) and 16.9, 13.8 and 13.1% (AE from France), respectively (Table 2). Phytochemical composition of plant secondary metabolites depends on several factors, such as cultivation area, climatic conditions, vegetation phase, genetic peculiarities and others; therefore evaluation of plant properties from different geographical regions was in the focus of numerous studies [30-31].
Deodorized extracts of Tussilago farfara L. 208
Table 2. Composition and radical scavenging capacity of Tussilago farfara constituents evaluated by
the on-line HPLC-UV-DPPH• method Plant
origin
Active compound
Acetone extract Methanol extract Ethanol extract
RT, min Peak area, mV×s % of total RSC Peak area, mV×s % of total RSC Peak area, mV×s % of total RSC FR Quinic acid 13.1 365.3 8.4 7.2 0.4 718.8 18.3 CGA - - - - diCQA 26.8 150.9 16.9 863.3 46.3 871.4 22.2 diCQA 28.6 1226.2 13.8 645.3 44.9 513.6 13.1 Rutin 31.3 539.8 9.8 - - 261.1 6.6 Q-pent 31.9 1159.3 13.1 58.0 6.3 800.5 21.6 K-3-O-glc 34.2 862.9 5.8 12.4 0.7 154.5 3.9 LT Quinic acid 12.9 458.3 8.3 387.9 9.4 1054.8 15.9 CGA 15.0 185.3 3.6 208.0 6.3 126.8 2.6 diCQA 26.7 915.6 10.0 699.3 12.6 834.1 11.7 diCQA 28.5 3385.3 39.6 917.7 23.4 1657.7 24.9 Rutin 31.1 756.6 12.5 411.7 11.5 942.9 18.9 Q-pent 31.9 1464.6 17.1 987.1 15.7 1065.4 16.0 K-3-O-glc 34.2 87.3 1.0 141.7 2.8 141.5 4.2
CGA: chlorogenic acid, diCQA: dicaffeoylquinic acid, Q-pent: quercetin-pentoside, K-3-O-glc: kaempferol-glucoside.
Acknowledgments
The study was supported by Research Council of Lithuania (grant nos. TAP47 and SVE-06/2011). References
[1] A. Augustyniak, G. Bartosz, A. Čipak, G. Duburs, L. Horáková, W. Łuczaj, M. Majekova, A. D. Odysseos, L. Rackova, E. Skrzydlewska, M. Stefek, M. Štrosová, G. Tirzitis, P.R. Venskutonis, J. Viskupicova, P. S. Vraka and N. Žarković (2010). Natural and synthetic antioxidants: An updated overview, Free Rad. Res. 44, 1216–1262.
[2] A. Schieber, F. C. Stintzing and R. Carle (2001). By-products of plant food processing as a source of functional compounds - Recent developments, Trends Food Sci. Technol. 12, 401-413.
[3] A. Moure, J. M. Cruz, D. Franco, J. M. Dominguez, J. Sineiro, H. Domínguez, M. José Núñez and J. C. Parajó (2001). Natural antioxidants from residual sources, Food Chem. 72, 145-171.
[4] N. Ramarathnam, T. Osawa, M. Namiki and S. Kawakishi (1989). Chemical studies on novel rice hull antioxidants. 2. Identification of isovitexin, a c-glycosyl flavonoid, J. Agric. Food Chem. 37, 316–319. [5] M. Watanabe, Y. Ohshita and T. Tsushida (1997). Antioxidant compounds from buckwheat (Fagopyrum
esculentum Möench) hulls, J. Agric. Food Chem. 45, 1039–1044.
[6] G. R. Takeoka and L. T. Dao (2002). Anthocyanins. In: Methods of Analysis for Functional Foods and Nutraceuticals, ed: W. J. Hurst, CRC Press, Inc. Boca Raton, Florida, pp. 219–241.
[7] J. Roche, M. Alignan, A. Bouniols, M. Cerny, F. Vear, Z. Mouloungui and O. Merah (2010). Sterol content in sunflower seeds (Helianthus annuus L.) as affected by genotypes and environmental conditions, Food Chem. 121, 990-995.
[8] E. Uzun, G. Sariyar, A. Adsersen, B. Karakoc, G. Otuk, E. Oktayoglu and S. Pirildar (2004).Traditional medicine in Sakarya province (Turkey) and antimicrobial activities of selected species, J. Ethnopharmacol. 95, 287-296.
[9] Y. F. Liu, X. W. Yang and B. Wu (2006). GC–MS analysis of essential oil constituents from buds of Tussilago farfara L., China. J. Chin. Pharm. Sci. 15, 10–14.
[10] A. Judzentiene and J. Budiene (2011). Volatile oils of flowers and stems of Tussilago farfara L. from Lithuania, J. Essent. Oil Bear. Plants. 14, 413-416.
[11] S. Gao, T. J. Trout and S. Schneider (2008). Evaluation of fumigation and surface seal methods on fumigant emissions in an orchard replant field, J. Environ. Qual. 37, 369–77.
[12] H. R. Park, M. Y. Yoo, J. H. Seo, I.S. Kim, N. Y. Kim, J. Y. Kang, L. Cui, C. S. Lee, C. H. Lee and H. S. Lee (2008). Sesquiterpenoids isolated from the flower buds of Tussilago farfara L. inhibit diacylglycerol acyltransferase, J. Agric. Food Chem. 56, 10493–10497.
[13] N. Didry, M. Pinkas and M. Torck (1980). Phenolic components from Tussilago farfara, Ann. Pharm. Fr. 38, 237–241.
[14] R. Lebada, A. Schreier, S. Scherz, C. Resch, L. Krenn and B. Kopp (2000). Quantitative analysis of the pyrrolizidine alkaloids senkirkine and senecionine in Tussilago farfara L. by capillary electrophoresis, Phytochem. Anal. 11, 366-369.
[15] Bundesgesundheitsamt 1992. Abwehr von Arzneimittelrisiken - Stufe II. (Defence against medicine risks - stage II.) BAnz no.111, vom 17.6.1992. Pharm. Ind. 54, 177-181.
[16] Committee on Herbal Medicinal Products (2011). Public statement on the use of herbal medicinal products containing toxic, unsaturated pyrrolizidine alkaloids (PAs), EMA/HMPC/893108/2011. [17] C. Wawrosch, B. Kopp and H. Wiederfield (2000) Permanent monitoring of pyrrolizidine alkaloid
content in micropropagated Tussilago farfara L.: A tool to fulfill statutory demands for the quality of coltsfoot in Austria and Germany, Acta Hort. 530, 469-472.
[18] A. Dvaranauskaite, P.R. Venskutonis, C. Raynaud, T. Talou, P. Viškelis and E. Dambrauskienė (2008). Characterization of steam volatiles in the essential oil of black currant buds and the antioxidant properties of different bud extracts, J. Agric. Food Chem. 56, 3279-3286.
[19] W. Brand-Williams, M. Cuvelier and C. Berset (1995). Use of a free radical method to evaluate antioxidant activity, LWT-Food Sci. & Technol. 28, 25–30.
[20] R. Re, N. Pellegrini, A. Proteggente, A. Pannala, M. Yang and C. Rice-Evans (1999). Antioxidant activity applying an improved ABTS radical cation decolorization assay, Free Radical Biol. Med. 26, 1231-1237.
[21] I. F. F. Benzie and J. Strain (1996). The ferric reducing ability of plasma (FRAP) as a measure of “antioxidant power”: the FRAP assay, Anal. Biochem. 239, 70–76.
[22] O. Folin and V. Ciocalteu (1927). On tyrosine and tryptophane determinations in proteins, J. Biol. Chem. 73, 627–650.
[23] State Pharmacopoeia of USSR (1989). Moscow, Medicina. 2, 324-334 (in Russian).
[24] A. Yermakov, V. Arasimov and N. Yarosh (1987). Methods of Biochemical Analysis of Plants. Leningrad: Agropromizdat (in Russian).
[25] SAS Institute, SAS/STAT user's guide, version 6. SAS Inst., Cary, NC (1987).
[26] D. Bandonienė, P. R. Venskutonis, D. Gruzdienė and M. Murkovic (2002). Antioxidative activity of sage (Salvia officinalis L.), savory (Satureja hortensis L.) and borage (Borago officinalis L.) extracts in rapeseed oil, Eur. J. Lip. Sci. Tech. 104, 286–292.
[27] A. Dapkevicius, T. A. van Beek, G. P. Lelyveld, A. van Veldhuizen, A. de Groot, J. P. H. Linssen and P. R. Venskutonis (2002). Isolation and structure elucidation of radical scavengers from Thymus vulgaris Leaves, J. Nat. Prod. 65, 892–896.
[28] V. Povilaitytė and P. R. Venskutonis (2000). Antioxidative activity of purple peril (Perilla frutescens L.), Moldavian dragonhead (Dracocephalum moldavica L.) and Roman chamomile (Anthemis nobilis L.) extracts in rapeseed oil, J. Am. Oil Chem. Soc, 77, 951–956.
[29] D. Huang, B. Ou and R.L. Prior (2005). The chemistry behind antioxidant capacity assays, J. Agric. Food Chem. 53, 1841–1856.
[30] O. J. Florence, A. A. Adeolu and J. A. Anthony (2011). Comparison of the nutritive value, antioxidant and antibacterial activities of Sonchus asper and Sonchus oleraceus, Rec. Nat. Prod. 5, 29-42.
[31] F. Pourmorad, S. J. Hosseinimehr and N. Shahabimajd (2006). Antioxidant activity, phenol and flavonoid contents of some selected Iranian medicinal plants, Afr. J. Biotechnol. 5, 1142-1145.
[32] K. S. Jamuna, C. K. Ramesh, T. R. Srinivasa and K. I. Raghu (2011). In vitro antioxidant studies in some common fruits, Int. J. Pharm. Pharm. Sci. 3, 60-63.
[33] M. R. Kim, J. Y. Lee, H. H. Lee, D. K. Aryal, Y. G. Kim, S. K. Kim, E. R. Woo and K. W. Kang (2006). Antioxidative effects of quercetin-glycosides isolated from the flower buds of Tussilago farfara L., Food Chem. Toxicol. 44, 1299-1307.
[34] J. Roche, M. Alignan, A. Bouniols, M. Cerny, F. Vear, Z. Mouloungui and O. Merah (2010). Sterol content in sunflower seeds (Helianthus annuus L.) as affected by genotypes and environmental conditions, Food Chem. 121, 990-995.
[35] M. Alignan, J. Roche, A. Bouniols, M. Cerny, Z. Mouloungui and O. Merah (2009). Effects of genotype and sowing date on phytostanols - phytosterols content and agronomic traits in wheat under organic agriculture, Food Chem. 117, 219–225.