The Mediterranean Sea and the Gulf of Cadiz as a natural laboratory for paleotsunami research: Recent advancements
P.M. De Martini, H.J. Bruins, L. Feist, B.N. Goodman-Tchernov, H. Hadler, J. Lario, G. Mastronuzzi, L. Obrocki, D. Pantosti, R. Paris, K. Reicherter, A. Smedile, A. Vött
PII: S0012-8252(21)00077-5
DOI: https://doi.org/10.1016/j.earscirev.2021.103578
Reference: EARTH 103578
To appear in: Earth-Science Reviews
Received date: 31 March 2020 Revised date: 12 February 2021 Accepted date: 25 February 2021
Please cite this article as: P.M. De Martini, H.J. Bruins, L. Feist, et al., The Mediterranean Sea and the Gulf of Cadiz as a natural laboratory for paleotsunami research: Recent advancements, Earth-Science Reviews (2021), https://doi.org/10.1016/ j.earscirev.2021.103578
This is a PDF file of an article that has undergone enhancements after acceptance, such as the addition of a cover page and metadata, and formatting for readability, but it is not yet the definitive version of record. This version will undergo additional copyediting, typesetting and review before it is published in its final form, but we are providing this version to give early visibility of the article. Please note that, during the production process, errors may be discovered which could affect the content, and all legal disclaimers that apply to the journal pertain.
The Mediterranean Sea and the Gulf of Cadiz as a natural laboratory for paleotsunami research: recent advancements
De Martini, P.M.1, Bruins, H.J.2, Feist, L.3, Goodman-Tchernov, B.N.4, Hadler, H.5,
Lario, J.6, Mastronuzzi, G.7, Obrocki, L. 5, Pantosti, D. 1, Paris, R.8, Reicherter, K. 3,
Smedile, A. 1, Vött, A. 5
1 Istituto Nazionale di Geofisica e Vulcanologia, Sezione Roma1, Rome, Italy, paolomarco.demartini@ingv.it, alessandra.smedile@ingv.it,
daniela.pantosti@ingv.it
2 Ben-Gurion University of the Negev, Jacob Blaustein Institutes for Desert Research, Sede Boker Campus, 84990 Midreshet Ben-Gurion, Israel,
hjbruins@bgu.ac.il,
3 Division of Earth Sciences and Geography, Neotectonics and Natural Hazards, RWTH Aachen University, Lochnerstraße 4 – 20, 52056 Aachen, Germany,
k.reicherter@nug.rwth-aachen.de , l.feist@nug.rwth-aachen.de
4 Department of Marine Geosciences, University of Haifa, 199 Abu Khoushy Blvd, Mt. Carmel, Haifa 3498838, Israel, bgoodman@univ.haifa.ac.il
5 Institute of Geography, Natural Hazard Research and Geoarchaeology team, Johannes Gutenberg-Universität Mainz, Germany, hadler@uni-mainz.de,
L.Obrocki2@geo.uni-mainz.de, voett@uni-mainz.de
6 Facultad de Ciencias, UNED, Spain, javier.lario@ccia.uned.es
7 Dipartimento di Scienze della Terra e Geoambientali, Università degli Studi di Bari, Italy, giuseppe.mastronuzzi@uniba.it
8 Université Clermont Auvergne, CNRS, IRD, OPGC, Laboratoire Magmas et Volcans, F-63000 Clermont-Ferrand, France, raphael.paris@uca.fr,
Abstract
After the 2004 Indian Ocean (IOT) and the 2011 Tohoku-oki tsunamis, new research in tsunami-related fields was strongly stimulated worldwide and also in the Mediterranean. This research growth yields substantial advancements in tsunami knowledge.
Among these advancements is the “Paleotsunami” research that has marked particular progress on the reconstruction of the tsunami history of a region. As an integration of the historical documentation available in the Mediterranean and the Gulf of Cadiz areas, geological and geoarchaeological records provide the insights to define the occurrence, characteristics, and impact of tsunamis of the past. Here, we present the recent advancements done for both the onshore and offshore realms.
As for the onshore, we discuss case studies dealing with recent high-resolution works based on: a) direct push in situ sensing techniques, applied to identification and characterization of typical paleotsunami deposits features; b) combined XRF-X-CT approach, implemented for the identification of fine-scale sedimentary structures useful for the definition of the causative flow dynamics; c) the geoarchaeological “new field” contribution, with the development of specific diagnostic criteria in search for tsunami impact traces in archaeological strata; d) comparison of multiple dating methods and of different modeling codes for the definition of the potential source for the displacement of boulders of exceptional dimension, identified by 3D size calculation.
As for the offshore advancements, we present case studies focusing on the recognition of tsunami deposits and their sedimentary traces in the geological record from the nearshore, thanks to diver-operated coring equipment, down to the continental slope, by means of vibracorer and long gravity core sampling in deeper areas. The examples provided show a multiproxy approach with a high potential of retrieving a complete record of paleotsunami traces at least during the Holocene. This is based on the combination of multidisciplinary approaches including ray imaging, high-resolution measurement of physical properties, X-ray fluorescence data, grain-size analysis, micropaleontology, palynological content, isotopic and optically stimulated luminescence dating methods.
Keywords
Paleotsunami deposits; Mediterranean Sea; High-resolution studies; Geology; Archeology; backwash wave
Introduction
The occurrence of a new tsunami event, how tragic it may be, is a unique opportunity to provide scientists with new critical information that increases knowledge on the different aspects of the phenomenon and to reduce the negative impact of future events on coastal societies.
Geological signatures of the impact of tsunamis of the past are commonly identified in coastal archives based on coring, trenching and subsurface geophysical methods in combination with detailed sedimentological, geomorphological, geochemical, geophysical and microfaunal analysis (e.g. Dominey-Howes et al., 2000, Mastronuzzi et al., 2007, Goodman-Tchernov et al. 2009, De Martini et al., 2010, Vött et al., 2011, Cuven et al., 2013, Pilarczyk et al. 2014, Costa et al., 2016, Chagué-Goff et al., 2017, Finkler et al., 2018a, 2018b, Werner et al., 2018a).
Paleotsunami research was initially developed in the 1980s (Atwater, 1987) in the NW of the United States (Cascadia), in Scotland (Dawson et al., 1988) and in Japan.
Because of the youthfulness of the studies on the geological signatures of tsunamis and the relative rarity of large tsunamis, prior to 2004 (the year of the Indian Ocean Tsunami) the number of direct observations of the effects they produced in the natural environment was very limited; this is because most of the attention was focused on the impact on the coastal human environment. Conversely, the enormous amount of detailed observations, collected by various teams and through different techniques, after the 2004 Indian Ocean (IOT) and the 2011 Tohoku-oki tsunamis, clearly highlighted how the occurrence of a tsunami represents a unique opportunity to define the conditions under which tsunami geological records were formed and preserved in geological archives, establish their significance and parametrization. This understanding has a large potential to evaluate the hazard and in perspective to contribute in tsunami risk reduction; in fact, the geological record of past tsunamis is not only a precious source of information on the extent of inundation along the coast and inland and on run-up size, but also on the age of the event(s). These are all useful pieces of information for evaluating past tsunami size, their recurrence at any particular site, and, to potentially define the source location and mechanism when incorporated with modeling approaches. This path of paleotsunami research can be summarized in a few words: studying the present to understand the past, studying the past as a key to the future.
1 - Tsunamis in the Mediterranean: historical data, paleotsunami records and potential tsunamigenic sources
The Mediterranean region is particularly rich in paleotsunami data, and this is due to the availability of historical records that provided precious clues to geologists and archeologists in search for “the direct evidence of tsunamis” (eg. sediments, morphological signatures, destruction layers, etc.; e.g.: Scheffers and Kelletat, 2003; Mastronuzzi, 2010; Anzidei et al., 2014; Scardino et al., 2020). Tsunamis in the Mediterranean may originate from large earthquakes as well as active volcanoes and significant submarine landslides. In fact, the Mediterranean area is quite a complex active zone of deformation with different geodynamic
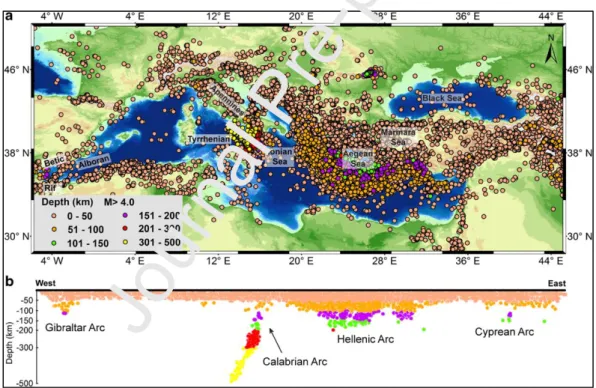
processes taking place from west to east and well depicted by the instrumental seismicity record (Figure 1.1).
The Mediterranean area is characterized by NW-SE oriented convergence occurring between the African and Eurasian plates, at the present rate of about 5 mm/yr (DeMets et al., 2010). Important crustal deformation is present in the
Western Mediterranean where the inner orogenic domain is represented to the
west by Rif-Betic belt and the Gibraltar Arc up to the northern Apennines and the Calabrian Arc eastward, while a number of extensional basins form the back-arc domain from the Alboran basin to the west to the Tyrrhenian basin eastward (Faccenna et al., 2014). Convergence is distributed among a number of active tectonic structures with the only subduction zone being still active the Western Ionian Sea under the Calabrian Arc (Faccenna et al., 2014, see Figure 1 for the plate tectonic setting of the Mediterranean).
The Eastern Mediterranean is characterized by important active subduction
under the Hellenic Arc and under the Cyprean Arc (Angelier et al., 1982, Mascle and Martin, 1990). The Hellenic Arc and Trench system as well as its back-arc region of the Aegean Sea are seismically known to be very active while in central Greece the Corinth Rift, with an extension rate of 5-15 mm/yr (Avallone et al., 2004) is characterized by intense crustal seismicity too.
Figure 1.1: a) Instrumental seismicity in the Mediterranean region between 1900 and 2018 (source: https://earthquake.usgs.gov/earthquakes/search/) and depth of the earthquakes. B) Color-coded depths of the earthquakes according to a scale in km (modified after Ulutas, 2020).
The Marmara Sea is controlled since the Late Pliocene by the very active dextral strike-slip North Anatolian Fault (NAF) and its branches (Yaltirak, 2002). The
Black Sea region presents along its northern margin an active subduction zone,
responsible for the formation of the Caucasus (Robinson, 1997).
Tsunamis may originate from several of these active zones; for example, in the historical past (Soloviev et al., 2000; Maramai et al., 2014), relevant tsunamis were produced by earthquakes originated in the Alboran basin (1522 CE), Ionian Sea (1169, 1693, 1908 CE), Hellenic Arc and Trench system (365 and 1303 C.E.), Cyprean Arc (1222 CE), Levantine Sea (551 CE).
Tsunamis related to active volcanism and landslides represent an even larger challenge in terms of hazard assessment and risk mitigation (Paris, 2015). In fact, not being necessarily anticipated by earthquakes or other defined precursory phenomena, alert cannot be issued and risk reduction can be based only on hazard scenarios, where they exist. For example, the December 22, 2018 flank collapse of Anak Krakatau volcano (Indonesia) that generated a tsunami that devastated the coasts of the Sunda Strait, killing more than 430 people, is a clear example of this criticality (Giachetti et al., 2012, Gouhier & Paris, 2019; Grilli et al., 2019; Takabatake et al., 2019). In most of the cases, tsunami warning systems worldwide are structured to deal with earthquake-generated tsunamis only.
There are several volcanoes in the Mediterranean that could potentially generate tsunamis (e.g. Etna, Vesuvius and Phlegrean Fields coastal volcanoes – Ischia, Linosa, Pantelleria, Eolian islands in Italy and Nisyros-Yali, Santorini-Kolumbo volcanic islands in Greece, Figure 1.3). Stromboli, for instance, is one of the most tsunamigenic volcanoes in the world, with 5 tsunamis described during the 1900s (Maramai et al., 2005a) and a well-documented landslide tsunami in 2002 (e.g. Bonaccorso et al., 2003; Maramai et al., 2005b; Tinti et al. 2006). The recurrent instability of Italian volcanoes such as Stromboli, Etna, Vesuvius or Ischia is well highlighted by a number of submarine debris avalanche deposits (e.g. Pareschi et al., 2006a; Milia et al., 2007; Romagnoli et al., 2009; De Alteriis et al., 2010). Apart from slope instabilities, there are other mechanisms that can be implied in the generation of volcanic tsunamis (Paris et al., 2015): i.e., pyroclastic flows and lahars entering the water, caldera collapse, volcanic earthquake, and underwater explosion. It is thus often difficult to identify the specific process causing tsunamis of the past related to large explosive eruptions, as illustrated by the debates on the 1883 Krakatau tsunami (e.g. Carey et al., 2001; Maeno & Imamura, 2011; Paris et al., 2014) and Late Bronze Age eruption of Santorini (e.g. McCoy & Heiken, 2000; Pareschi et al., 2006b; Bruins et al., 2008; Novikova et al., 2011; Nomikou et al., 2016; Werner et al., 2018b). Nowadays there is a particular concern about tsunami hazard of a future eruption of Kolumbo submarine volcano, 7 km north-east of Santorini (Nomikou et al., 2014). An analogue of the possible future eruption could be found in Ulvrova et al. (2016) that used numerical simulations together with the spatial distribution and composition of tsunami deposits on the coasts of Santorini Island, trying to constrain the source of the tsunami observed during the 1650 CE eruption of Kolumbo.
For what it concerns the hazard posed by submarine landslides in the Mediterranean, the challenge is even larger. The basic information to evaluate this hazard and define tsunami scenarios are landslides location and size along with the estimate of their potential for producing a tsunami and frequency of sliding. An updated distribution of submarine landslides in the Mediterranean basin is provided by the relevant work of Urgeles and Camerlenghi, 2013 (see Figure 2 pp. 2602).
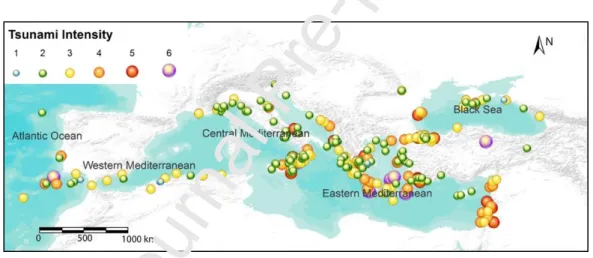
A large variety of tsunami data are available for the Mediterranean region and its connected seas. These include: a) historical reports (see Soloviev et al., 2000; Maramai et al., 2014, for a unified catalogue “The Euro-Mediterranean Tsunami Catalogue, containing 290 tsunamis generated in the European and Mediterranean seas since 6150 BCE to current days (Figure 1.2),
http://roma2.rm.ingv.it/en/facilities/data_bases/52/euro-mediterranean_tsunami_catalogue, this catalogue is the result of a systematic and detailed review of all the regional catalogues available in literature covering the study area, together with about 900 documentary sources, including historical documents, books, scientific reports, newspapers and previous catalogues); b) the Global Historical Tsunami Database run by NOAA for information on tsunami events from 2000 BCE to the present available at https://www.ngdc.noaa.gov/hazard/tsu_db.shtml); c) onshore and offshore geological signatures (see the ASTARTE Paleotsunami deposits database - North-eastern Atlantic and Mediterranean (NEAM) region - V. 2017.2, available at https://arcg.is/airGy, the collected and analyzed data for the Mediterranean area alone can be summarized as follow: 66 sites and 120 geological evidence of tsunamis; 11% of sites exceeds the value of 10 m in elevation a.s.l., while the inundation distance of 17% of the sites overcomes 500 m inland); d) modern instrumental records.
Figure 1.2: Distribution of the historical tsunami occurred in the Mediterranean region and its connected seas, please note that the plotted coordinates of each tsunami event refer to those of the triggering cause, i.e. the coordinates of the tsunami generating earthquake, volcanic eruption or landslide.
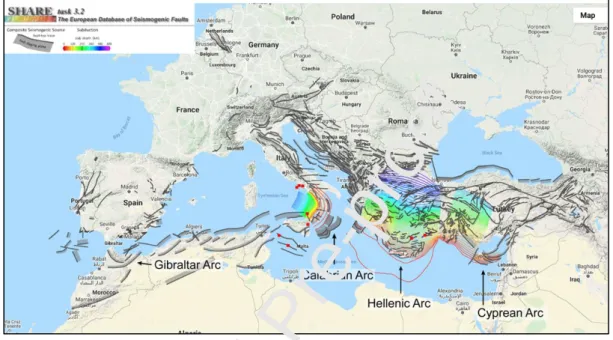
As for the potential tsunami seismic sources a review can be found in the European Database of Seismogenic faults (Basili et al., 2013) available at http://diss.rm.ingv.it/share-edsf/, (Figure 1.3), and in Petricca and Babeyko, 2019, and references therein.
The 2011 Tohoku-oki disaster highlighted the need for incorporating information from tsunami deposits (Sawai et al., 2012), complex geometry of the source, and quantification of source uncertainties in probabilistic tsunami hazard analysis (PTHA) studies (Selva et al., 2016). Recently, a serious effort was done to provide Probabilistic Tsunami Hazard Map for the NEAM region, see Grezio et al., 2017, and references therein, and for region-wide long-term homogenous PTHA for NEAM area derived purely from seismic sources, more is
available at http://ai2lab.org/tsumapsneam/interactive-hazard-curve-tool/. Hopefully, in a near future, tsunami deposits information will be incorporated also in the Mediterranean PTHA, following the Tohoku-oki lessons.
PTHA methods for landslide and volcanic sources of tsunamis are far less established compared to the earthquake sources (Grezio et al., 2017). However, there are efforts in this direction as for example, Paris et al. (2019) proposed a conditional probabilistic hazard analysis for tsunamis generated by volcanic explosions in the submerged part of the Campi Flegrei caldera (Italy).
Figure 1.3: Distribution of seismogenic faults, composite seismogenic sources and active subduction zones (bold black line and gray zone represent fault top trace and fault dipping plane, respectively), modified from the European Database of Seismogenic faults (Basili et al., 2013). The active volcanoes mentioned in the text above are plotted as red squares.
A very critical issue for the management of tsunami hazard and alert in the Mediterranean, is related to its tectonic and geographical arrangement. In fact, in the Mediterranean, all the potential tsunami sources are in the near-field domain and thus, tsunami wave travel times usually do not exceed 1 hour. Because of this, given the limited potential of tsunami alerts in the Mediterranean area, tsunami hazard assessment and prevention actions become the strongest and effective tools for tsunami risk reduction. Under this light, the knowledge of the occurrences of the past, and specifically the history of paleotsunamis that may span back in time several millennia, become a critical contribution to highlight the coastal areas most prone to tsunami inundation, the frequency of these events, and the potential source type (e.g., Okal and Synolakis, 2004).
The Mediterranean area is an ideal open laboratory for paleotsunami research for multiple reasons. First, while it is a relatively small and closed sea it contains nearly all of the tsunami-generating features of an open ocean, including tectonically active plates, volcanoes and submarine landslides. Moreover, the Mediterraean area appears to be ideal also to face the problematic storm vs.
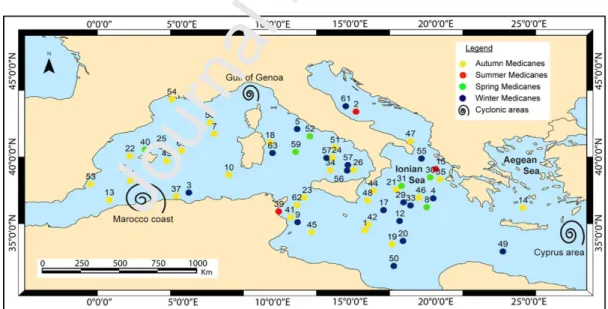
tsunami source differentiation, which is very critical in the reconstruction of a paleotsunami history at a specific site. In fact, its semi-closed morphology coincides with moderate fetch lengths and its climatic conditions are dominated by hot and dry summers, rainy and moderately cold winters. Such conditions disfavor the formation of very large low-pressure systems. The formation of common cyclones in the Mediterranean Sea is known to be favored in front of Morocco coast (Northern Africa), in the Gulf of Genoa (Italy) and around the island of Cyprus (Figure 1.4), while tropical-like cyclones (known as Medicanes or Mediterranean Hurricanes) may primarily generate in the western Mediterranean and in the Ionian Sea, less frequently in the Aegean and in the Levantine seas (Figure 1.4). Medicanes, with diameter usually less than 300 km and an intensity commonly much weaker than tropical cyclones, are usually accompanied by strong winds, heavy rainfall, rare tornadoes and, secondarily, flood (Nastos et al., 2018, and references therein). Even if the Gulf of Cadiz is known to be under the influence of frequent North Atlantic storm waves up to 4 m high, from W-NW (Costa et al., 1992), only a few tempestites are documented onshore (Andrade et al., 2004; Kortekaas and Dowson, 2007). Thus, potential storm/medicane related deposits in the Mediterranean and Gulf of Cadiz coastal areas certainly exists but some physical criteria for attempting distinguishing between storm and tsunami deposits can be used (Morton et al., 2007, and references therein). More recently, reviews of both instrumentally and historically recorded tsunami and storm data also support the position that tsunami traces in the geological record are stand-alone seismo-tectonic signals and cannot be re-interpreted as climate signals (Marriner et al., 2017; Vött et al., 2019b).
Figure 1.4: Geographical distribution of main cyclonic areas (spiral) and seasonal medicane occurrence for the time period 1969–2014 (yellow color for autumn, red color for summer, green color for spring and blue color for winter) based on 63 numbered cases (modified after Nastos et al., 2018)
2 – 2011 Tohoku-oki tsunami lessons
The Mw 9.0 earthquake that occurred on March 11, 2011, offshore Honshu Island (Japan) triggered a tsunami with disastrous effects. Official fatalities were more than 15,899 and missing about 2,529 (at 10 June 2020, National Police Agency, Japan). Some reinforced concrete buildings and many tsunami barriers were severely damaged (Mori et al., 2011). A large variety of inundation typologies were observed including very different environments from agricultural lands, to coastal rural towns and modern urban cities, interacting with a local coastal morphology being substantially different across the affected area. From optical, thermal, and SAR data (Chini et al., 2013) it was possible to observe a maximum value of inundation of about 6 km, in the central portion of the Sendai plain, with a distance tapering to about 1 km at the edges of the plain, that are characterized by high-relief morphology. Moreover, the general trends of inundation distance and run-up are both “parabolic” with opposite convexity, highlighting an anticorrelation of the two distributions (Chini et al., 2013). In fact, field surveys reported that while on the Sendai Plain the maximum inundation height observed was 19.5 m and the water propagated more than 5 km inland (Goto et al., 2011; Mori et al., 2011), along the ria coast north of Sendai tsunami waves were focused by narrow bays producing the largest run‐ups reaching up to 40 m, with maximum values (Goto et al., 2011; Mori et al., 2011). Moreover, run‐up heights greater than 10 m and 20 m were found along 425 km and 290 km of coast length, respectively (Mori et al., 2011).
Detailed post-event surveys (Goto et al., 2011) provided a unique opportunity to put solid basis for the interpretation of the tsunami effects on the natural environment, particularly relevant for the study and characterization of paleotsunamis. The 2011 tsunami inundated up to 4.5 km inland along a transect adjacent to Sendai Airport, but the sand-dominated deposit (thicker than 0.5 cm) reached approximately 2.8 km in land (Goto et al., 2011) with a tsunami mud-dominated thin layer traceable up to the inundation limit. Similar observations were also collected 10 km north of the Sendai airport as well as 40 km southward where the tsunami inundated up to 4 km while the sand deposit left terminates at about 3 km (Goto et al., 2011). The tsunami deposits, a massive sand, graded or laminated, often with soil rip-up clasts, generally thin inland with a maximum thickness of about 30 cm in the seaward areas (Goto et al., 2011), in good agreement with the observations collected on modern subaerial sand beds deposited by major tsunamis (Morton et al., 2007). Moreover, in flatter coastal areas like the paddy fields, a centimeter-thick mud drape deposited on top of the tsunami sand probably from suspension load (Goto et al., 2011). Mud sediments were investigated in detail and a high concentration of salt was measured as a result of seawater evaporation (Goto et al., 2011). The preservation of the marine geochemical signature can be problematic especially in sandy deposits ( zczucin ski et al., 2007 Chague -Goff, 2010; Chagué-Goff et al, 2017), but it is effective or at least less problematic in organic-rich sediments (Chagué-Goff, 2010; Chagué-Goff et al, 2017).
In summary, the 2011 Tohoku-oki tsunami showed that the inundation distance (about 5-6 km in the Sendai Plain) was larger than the 2011 tsunami sandy deposit traces (about 3-4 km inland), and that the 2011 geochemical signature left by the tsunami water in the most internal 2 km can be used to trace the inundation limit but appears to degrade quickly mainly because rainfall resulted in the leaching of salts from the sandy sediments (Chagué-Goff et al., 2012).
Therefore, this suggests, or better reinforces, the idea that geologists in search for tsunami deposits generally measure a minimum value. It also illustrates very well the possible differences between "paleo" tsunami signatures and the "present-days" events, for which inundation maps were underestimated in several areas (Mori et al., 2011). In this respect, it is important to emphasize the primary role of detailed geomorphological studies for an effective site selection in paleo-studies.
Another lesson was learned by the many images and videos showing the occurrence of a very important backwash flow towards the ocean. This is certainly a promising area of research, as illustrated by post-event turbidites observed off Japan after the 2011 Tohoku-oki earthquake and tsunami. In particular, Usami et al. (2017) show that turbidity current generated by the 2011 tsunami backwash flow transported sand-size grains from the outer shelf or inner bay to the bathyal slope. This tsunami backwash turbidite was full of foraminifera from the continental shelf, while the earthquake turbidite, deposited below, includes bathyal foraminifera only. Moreover, Arai et al. (2013) evidenced a turbidity current formed by the downslope motion of suspension clouds of seafloor sediments stirred up by the tsunami. More data are needed but these results may suggest that there is a significant potential to test different and new approaches in order to discriminate between bathyal “paleoseismic turbidite” and “paleotsunami turbidite”, hopefully opening a new perspective in terms of tsunami recurrence.
Another lesson derived from the 2011 event include the fact that the so called Jogan 869 CE tsunami was known from both historical (Abe et al., 1990) and field studies (Minoura et al., 2001) and it has been found to be comparable or at least to have strong similarities with the 2011 Tohoku-oki tsunami (Sugawara et al., 2013). Thus, the reconstruction of the tsunami history of the past can well be used to forecast future events.
The gigantic 2011 Tohoku-oki tsunami sheds light on the understanding and estimation of three critical parameters that characterize a tsunami: inundation distance, run-up height and recurrence of inundation at any single site. But it also highlighted how an important backwash flow is with regards to its ability to leave traceable signatures in the offshore realm.
The knowledge of inundation distance, run-up height, and recurrence from the geological record is absolutely unique and critical to undertake the needed actions for tsunami hazard assessment and risk reduction. In fact, paleotsunami research is able to integrate and extend back in time the available historical record filling the possible gaps that are naturally expected in this record (e.g. Goodman-Tchernov et al. 2016, Vött et al., 2018).
The integration of paleotsunami records together with historical accounts and modern modeling yields robust tsunami hazard assessments for future events producing highly valuable scenarios as they are supported by different datasets. In this paper we suggest that armed with the knowledge gained from research following recent events globally, the Mediterranean area may furnish important new elements not only to a better understanding of the tsunami hazard along its coasts, but also to the global research effort on paleotsunami signatures. This is particularly true given the specific peculiarities of this area, such as the relatively long and robust historical record that can serve as a guide and stimulus for the
selection of research areas, and the significant contribution derived from accompanying archeological findings.
In the following, we present several examples of recent multidisciplinary tsunami deposits studies that represent the advancement developed in the Mediterranean area and Gulf of Cadiz, during the past decade or so. Several of these advancements were stimulated by the new information and understanding on onshore inundation and backwash characteristics derived from the 2011 Tohoku-oki tsunami event. In the following, these advancements are subdivided into two categories: onshore and offshore.
3- Onshore paleotsunami research advancements
The onshore advancements are shown by discussing case studies dealing with: (1) recent applications of direct push in situ sensing techniques highlighting typical paleotsunami deposits features, with centimeter-scaled stratigraphic data, this high quality-resolution approach is and much less time-consuming with respect to common sediment drilling, allowing large area mapping (potentially useful for inundation distance problem); (2) recent use of X-ray computed tomography (X-CT) defining a detailed characterization of fine-scale sedimentary structures useful to better decipher the link between paleotsunami deposit structures and causative flow dynamics (ideal for tsunami vs storm causative source question) (3) “new” geoarchaeological approach and diagnostic criteria identifying and characterizing tsunami impact and its ramifications in archaeological strata from “normal” site formation processes (4) new technological efforts for the definition of the potential source (storm vs tsunami) by adopting different modeling codes, 3D size calculation and absolute age of displaced boulders of exceptional size by using Terrestrial Laser Scanning data and Drone photographs as well as multiple dating methods.
3.1 - Chasing paleotsunami signals in coastal sedimentary archives using Direct Push sensing techniques – case study from western Greece
Advances in paleotsunami research were recently achieved by using direct push (DP) in situ sensing techniques in search of tsunami signals (Obrocki et al., 2020; Vött et al., 2019a). DP measurements provide in situ stratigraphic data by pushing the DP sensor through soils and sediments (Fig. 3.1.1). DP data allow the differentiation of sediment properties such as composition, grain size and material consolidation on a centimeter-scale. Therefore, DP data help improving the quality and resolution of sediment cores regarding compaction, contamination and loss of sediment effects caused during or by the drilling process and are much less time-consuming than common sediment drilling (Dietrich and Leven 2006).
Figure 3.1.1: Illustration of the direct push (DP) system and the hydraulic profiling tool (HPT) and cone penetration testing (CPT) sensors used within the present case study.
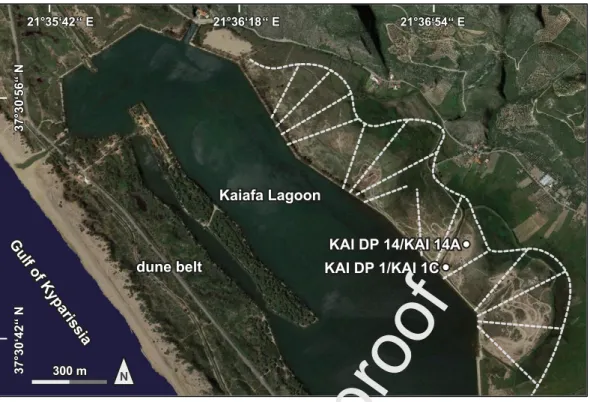
Obrocki et al. (2020) identified two palaeotsunamite candidates at the Kaiafa Lagoon (Gulf of Kyparissia, western Peloponnese; Fig. 3.1.2) using hydraulic profiling (DP HPT) and cone penetration testing (DP CPT) tools in combination with stratigraphic information from sediment cores. Radiocarbon dating allowed the allocation of these tsunami layers as candidates for the AD 551 and AD 1303 earthquake and tsunami events, both historically well documented (Guidoboni et al., 1994; Ambraseys, 2009). In contrast, evidence of major storm events was neither found in the local sedimentary record nor it is acknowledged by historical data (cf. Vött et al., 2019b).
Multiple tsunami washover fans are described from the eastern shore of the Kaiafa Lagoon (Koster et al., 2015; Fig. 3.1.2). Typical tsunami features were found within the local stratigraphic record of such fans as, for example, (i) basal erosional unconformities and abrupt increases in grain size, (ii) rip-up clasts and mud caps, (iii) coarsening upward sequences and thinning inland. These parameters were reliably recognized by DP signals collected with DP HPT and DP CPT sensors (Obrocki et al., 2020; Fig. 3.1.1). In search of allochthonous sand sheets, the total sand content based on the same DP dataset were calculated using a simple multivariate linear regression approach (Obrocki et al., 2020).
INFORMATIVE VALUE MEASURED PARAMETERS DP SENSOR sediment composition layer boundaries elastic behaviour variations in consistency bulk density tip resistance (qt) sleeve friction (ft) pore pressure (u2) Cone Penetration Testing (CPT)
qt u2 ft
sediment composition clay mineral content
layer boundaries aquifer static ground water level electrical conductivity (EC)
water injection pressure (Pinj) estimated hydraulic conductivity (Kest) Hydraulic Profiling Tool (HPT)
EC Array
injection screen (Pinj)
trunk line running inside the drive rods
(data transfer)
DP sensor (data measurement)
control unit
(data aquisition) trunk line
automative drill rig lithostratigraphic unit: 4 lithostratigraphic unit: 3 lithostratigraphic unit: 2 lithostratigraphic unit: 1 PC
DIRECT PUSH SYSTEM
Figure 3.1.2: Topographical overview of the Kaiafa Lagoon (western Greece) with vibracoring and DP sounding sites; for further details, see text. White dashed line depicts tsunami-borne washover fans. Map based on GoogleEarth aerial images (5/5/2015).
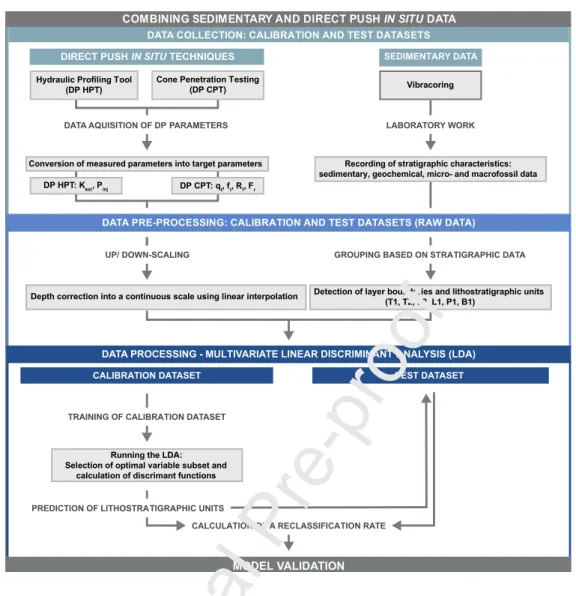
In the following, we discuss the large potential of combined DP HPT and DP CPT parameters for the identification of tsunami layers by applying a multivariate linear discriminant analysis (LDA). In a first step, LDA can be used to find the best DP variables and, thus, discriminant functions that help to discriminate between autochthonous and allochthonous (= tsunami) deposits at the Kaiafa Lagoon. In a second step, the linear discriminant functions found are used to identify tsunami deposits in a DP test dataset (Fig. 3.1.3).
Data collection: Direct push (DP) in situ sensing and sediment analysis
DP logging was carried out at two sounding sites on the eastern shore of the Kaiafa Lagoon (KAI DP 1, KAI DP 14; Figure 3.1.2) using a Geoprobe 540 MT system adapted to an automotive Nordmeyer RS 0/2.3 drill rig equipped with a Geoprobe HPT K8050 (2.25-inch system) probe for DP HPT measurements and a Geotech probe NOVA for DP CPT logging (Fig. 3.1.1). DP techniques enable the constant measurements of parameters in response to the varying sedimentary conditions with a vertical resolution of 2 cm. During the HPT measurement, water is injected into the underground by a small injection screen at the side of the probe allowing for the acquisition of the water injection pressure (Pinj) and
the estimated hydraulic conductivity (Kest.). Additionally, the HPT probe is
equipped with four electrodes in a Wenner array that enables the vertical measurement of the electrical conductivity (EC). The DP CPT system collects constantly the tip resistance (qt), the sleeve friction (ft) and the pore pressure
(u2) (Lunne et al., 2002). The tip resistance describes the total force acting on the
KAI DP 1/KAI 1C KAI DP 14/KAI 14A Kaiafa Lagoon dune belt G ulf o f K yp ariss ia KAI DP 1/KAI 1C KAI DP 14/KAI 14A Kaiafa Lagoon dune belt G ulf o f K yp ariss ia 300 m 300 m N 21°36‘54‘‘ E 21°35‘42‘‘ E 21°36‘18‘‘ E 3 7 °3 0 ‘4 2 ‘‘ N 3 7° 3 0 ‘5 6 ‘‘ N 21°36‘54‘‘ E 21°35‘42‘‘ E 21°36‘18‘‘ E 3 7 °3 0 ‘4 2 ‘‘ N 3 7° 3 0 ‘5 6 ‘‘ N KAI DP 1/KAI 1C KAI DP 14/KAI 14A KAI DP 1/KAI 1C
KAI DP 14/KAI 14A Kaiafa Lagoon Kaiafa Lagoon dune belt G ulf o f K yp ariss ia dune belt G ulf o f K yp ariss ia
Journal Pre-proof
cone tip divided by the projected area of the cone, whereas the sleeve friction is defined by the total force acting on the sleeve of the rod divided by the total area of sleeve (Fig. 3.1.1). qt and ft were further used to calculate the friction ratio (Rf)
and normalized friction ration (Fr) (Robertson et al., 2016).
In addition to DP measurements, vibracoring was conducted at both DP sounding sites. Sediment-filled plastic liners were opened in the laboratory, cleaned, photo documented and described comprising standard criteria like grain size, sediment colour, carbonate content, organic content, macrofossil content etc. Grain size analyses of fine material (< 2 mm) were carried out using the highly reliable Köhn sieving and pipette method (Köhn, 1929).
Data processing: multivariate linear discriminant analysis (LDA)
LDA is used to find one or more linear discriminant functions that allows for a dataset classification with maximum inter-group variance relative to the intra-group variance (Bahrenberg et al., 2008). Here, the following variables were used for the discriminant analysis: EC, Pinj, Kest., qt, ft, u2, Rf, Fr.
Data processing was realized in two steps (Fig. 3.1.3): (1) DP data collected at sounding site KAI DP 1 was grouped into six lithostratigraphic units found for vibracore KAI 1C based on sedimentary, geochemical and micro- and macrofossil data, and (2) DP data collected at sounding sites KAI DP 1 and KAI DP 14 were linearly interpolated on a 1 cm depth scale using the ‘linterp’ function of the ‘astrochron’ R package (Meyers, 2014).
LDA was then computed for KAI DP 1 (calibration dataset) using the ‘lda’ function of the ‘MA ’ R package (Venables and Ripley, 2002), in which the following equation is applied: D = b0 +b1x1+b2x2 … bnxn
where D is the discriminant score, bi are the discriminant coefficients and xi are
the values of the discriminating variables. The validity of LDA was determined by the reclassification of dataset KAI DP 1 and the calculation of a reclassification rate. Finally, LDA was used to derive classification rules for the grouping of the test dataset, namely DP data from site KAI DP 14 (Fig. 3.1.3).
Figure 3.1.3: Combined approach of DP in situ and sedimentary data using a multivariate discriminant analysis (LDA) to predict lithostratigraphic units.
Results and Discussion
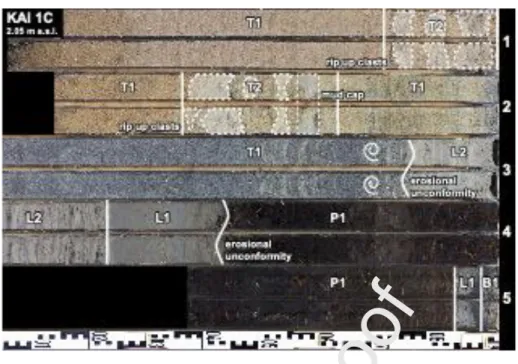
Vibracore KAI 1C is characterized by a sequence of basal grey paleo-beach sands (B1), peat (P1), silty-clayey lagoonal sediments (L1), clayey silt with intersecting fine to medium sands (L2), followed by massive tsunami sands (T1) with various features of high-energy transport such as clayey rip-up clasts (T2) (Figure 3.1.4).
PREDICTION OF LITHOSTRATIGRAPHIC UNITS TRAINING OF CALIBRATION DATASET
UP/ DOWN-SCALING GROUPING BASED ON STRATIGRAPHIC DATA
DATA AQUISITION OF DP PARAMETERS
CALIBRATION DATASET TEST DATASET
Cone Penetration Testing (DP CPT)
DATA PRE-PROCESSING: CALIBRATION AND TEST DATASETS (RAW DATA)
DATA PROCESSING - MULTIVARIATE LINEAR DISCRIMINANT ANALYSIS (LDA) DATA COLLECTION: CALIBRATION AND TEST DATASETS
COMBINING SEDIMENTARY AND DIRECT PUSH IN SITU DATA
Hydraulic Profiling Tool (DP HPT)
LABORATORY WORK
Recording of stratigraphic characteristics: sedimentary, geochemical, micro- and macrofossil data DIRECT PUSH IN SITU TECHNIQUES
MODEL VALIDATION
Running the LDA: Selection of optimal variable subset and
calculation of discrimant functions
Depth correction into a continuous scale using linear interpolation Detection of layer boundaries and lithostratigraphic units (T1, T2, L2, L1, P1, B1)
Vibracoring SEDIMENTARY DATA
Conversion of measured parameters into target parameters
DP HPT: Kest, Pinj DP CPT: qt, ft, Rf, Fr
CALCULATION OF A RECLASSIFICATION RATE
Figure 3.1.4: Photo of vibracore KAI 1C drilled on the eastern shore of the Kaiafa Lagoon. T1 – tsunami sands; T2 – tsunami-borne rip-up clasts, L2 – sandy silt to silty sands, L1 –silty and clayey lagoonal deposits, P1 – peat, B1 – beach sands. Ground surface is to the upper left, final coring depth to the lower right.
LDA was used to verify whether tsunami-related lithostratigraphic units can be identified based on DP HPT and DP CPT data. In total, five discriminant functions were derived with u2, ft, qt and Pinj as the most discriminant variables and a
Wilks’ Lambda of 6.2*10-3. The first two discriminant functions (LDA 1, LDA 2) are significant and describe 98.63 % of the variance between the six lithostratigraphic units (B1, P1, L1, L2, T1, T2). The discriminant scores for LDA 1 and LDA 2 document a clear statistical dependence of the DP values on the defined lithostratigraphic units (Figure 3.1.5 A).
The discriminatory profile of LDA 1(eigenvalue 94.18%) allows to discriminate between high-energy units T1 and T2 with mean values of -5.14 and -4.74, respectively, and between low-energy units P1 and L1 with mean values of 8.30 and 4.62, respectively (Figure 3.1.5 C). The tsunami-induced abrupt change in environmental conditions is marked by an erosional contact at 2.77 m b.s. (Figure 3.1.4). This sharp contact is also depicted by the LDA 1 curve showing a gradual transition from unit L1 to unit L2 followed by an abrupt decrease to minimum discriminant scores of units T1 and T2 (Figure 3.1.5 B).
Lithostratigraphic units B1 and L2 can be well classified by the combined interpretation of LDA 1 and LDA 2 (Figure 3.1.5 A). With the focus on paleotsunami research, results of LDA 1 clearly improves the discrimination between units T1 and B1 (Figure 3.1.5 C). As the beach is part of the tsunami erosion zone, these units are barely discriminable using grain size analysis data alone (Röbke and Vött, 2017).
Figure 3.1.5: Results of linear discriminant analysis (LDA) of multivariate DP data with discriminant scores of the first two discriminant functions for the calibration data set KAI DP 1 (A), and the test dataset KAI DP 14 (B). (C) shows vertical discriminatory profiles using the LDA 1 function (KAI DP 1; black, KAI DP 14; grey) and predicted lithostratigraphic records – based on LDA data – compared to ‘real’ ones observed by studying sediment cores.
The high LDA validity is proven by a reclassification rate of 89.37 % for all lithostratigraphic units and 91.58 % for tsunami-related unit T1. Misclassification can be explained by inaccuracies of a priori grouping using stratigraphic information. Of the 62 misclassified cases, 14 occurred at layer boundaries between two lithostratigraphic units resulting in an average shift of only 2.80 cm in vertical direction (Figure 3.1.5 C). In contrast to vibracoring, DP
in situ measurements do not entail the risk of sediment compaction (Obrocki et
al., 2020). The depth offset between calibrated and predicted data may be caused by technical reasons. Other 44 falsely grouped cases were observed for the assignment of discriminant scores into unit T1 instead of unit T2 and vice versa (Figure 3.1.5 C). The predicted profile shows an increased number of unit T2 layers at almost the same depth but with decreased thickness compared to the calibrated profile. Rip-up clasts are usually small-scale sedimentary features (mm or cm scale, Dawson and Stewart, 2007). It seems that predicted rip-up
clasts at DP sounding site KAI DP 1 represent additional rip-up clast adjacent to the ones found at vibracoring site KAI 1C. The more precise detection and delimitation of unit T2 due to better resolved DP data compared to a priori grouped units must be also considered.
Finally, discriminant functions were used to classify the test dataset recorded at sounding site KAI DP 14 c. 130 m northeast of site KAI DP 1 (Figure 3.1.1). The comparison of the predicted dataset and the stratigraphic record of vibracore KAI 14A show a total classification rate of 69.07 %. Difficulties occurred for the grouping of the peat sequence P1 probably due to differences in decomposition resulting in a misclassification into units B1 and L1 (Landva et al. 1983; Missiaen et al., 2015). Figure 3.1.5 C shows that lithostratigraphic units B1, L1 and P1 are in most cases paired rather than separated based on the discriminant scores derived from LDA 1 and LDA 2. Therefore, additional parameters are needed to improve the discrimination between different low-energy units within the test dataset.
In contrast, classification rules derived from the calibration dataset were extremely helpful to differentiate between low-energy and high-energy deposits and to trace tsunami-related sediment layers within the test dataset (Figures. 3.1.5 B & C). This is confirmed by a very good reclassification rate of 93.12 % for unit T1. The LDA 1 discriminatory profiles illustrate the high efficiency of DP data to estimate the thickness of tsunami layers along transects (Figure 3.1.5 C). This allows for the rapid detection of thinning-inland of tsunami-related sand sheets and to estimate the maximum inundation extent.
To sum up, our case study shows that DP is a powerful tool to reliably identify and trace tsunami deposits in their vertical and lateral dimensions. Results of LDA prove a strong statistical relationship between DP HPT and DP CPT data and corresponding lithostratigraphic units. This allows for a clear discrimination between tsunami sediments and other facies within coastal sedimentary sequences. Calibrating DP data by sedimentary data collected at key sites clearly reduces the need of a high number of sediment cores and subsequent laboratory analysis to detect tsunami layers, keeping in mind that DP measurements are considerably quicker to realize and deliver instantaneously analytical in situ data. Several DP measurements can be realized within one day only. The use of DP techniques can thus significantly improve the cost and time efficiency of data acquisition within the frame of paleotsunami research.
3.2 – Combined XRF-X-CT applied to coastal sedimentary archives, southern Spain case study
Information gained from historical or Holocene tsunami deposits cannot be combined with quantitative data on the inundation (flow depth and velocity, current direction, runup, etc.). That is why recent events such as the 2011 Tohoku-oki tsunami represent opportunities to better understand the causal links between flow dynamics and deposits. Sedimentary deposits left inland by the 2011 tsunami were extensively studied using different methods: (a) sediment sources estimated from foraminifera, diatom and nannolith assemblages (Pilarczyk et al., 2012 zczuciński et al., 2012 Tanigawa et al., 2016), heavy minerals (Jagodziński et al., 2012), and geochemistry (Chagué-Goff et al., 2012); (b) current dynamics inferred from anisotropy of magnetic
susceptibility (Schneider et al., 2014); (c) maximum inundation and sand deposition limits identified using grain size analysis (Abe et al., 2012) and geochemical proxies (Chagué-Goff et al., 2012).
The 1755 Lisbon tsunami example
Some of these methods were also applied to tsunami deposits in the Mediterranean. The 1755 Lisbon tsunami and its deposits along the Spanish coast represent a relevant case-study. Cuven et al. (2013) used a combination of textural (grain size distribution, AMS), micromorphological (X-ray tomography, thin sections) and geochemical analyses (X-ray microfluorescence, ICP-AES) to provide a comprehensive reconstruction of the different phases of the 1755 tsunami uprush and backwash deposition in the Los Lances Bay (Figure 3.2.1). The uprush-backwash transition is marked by a switch from marine to continental sources of sediments, as evidenced by vertical variations the Ca-Al Spearman coefficient of correlation, higher K (high mud content), and lower Si and Ba concentrations (Cuven et al., 2013).
Figure 3.2.1: Summary of the methods used in Cuven et al. (2013) and Falvard & Paris (2017) for characterizing the microtexture, microstructure and chemical composition of tsunami deposit (1755 Lisbon tsunami, southern coast of Spain) using different types of sampling and analyses.
On the same deposits, Falvard and Paris (2017) later focused on X-ray computed tomography (X-CT) to provide a detailed characterization of fine-scale
sedimentary structures (erosive contacts, mudlines, rip-up clasts, lamination), vertical trends of grain size distribution and marine bioclasts, and sedimentary fabric. Falvard & Paris (2017) developed a simple method that automatically calculates grain-size metrics on two-dimensional vertical slice X-ray images, following a given vertical step (defined by the operator) along the sediment core. Lamination observed in the Los Lances deposits correspond to the spaced stratification of upper plane beds. Each new wave initiates a sediment pulse that is recorded by a distinct subunit. The base of each subunit is marked by a laminated mudline, followed by a crudely laminated and inversely graded mixture of mud and sand. The upper part of the subunit is mostly sandy and slightly normally-graded. The peak of maximum grain size thus appears approximately at the middle of the subunit, except when its upper part is truncated by the following wave. The separation of thousands of individual grains on three-dimensional stacks of horizontal slices allows three-dimensional fabric to be characterized at each vertical step. The fabric gives information on the direction and strength of the current, as well as sediment concentration and deposition rate (Paris et al., 2020). X-CT imagery also illustrates the incorporation of mud in the tsunami deposit: scouring and detachment of mud clasts, deformation of these soft clasts in the flow, formation of mud aggregates, mudlines and mud drapes. According to Falvard and Paris (2017), the mudlines that were previously interpreted as short-lived settling phases of clay-to-silt sediment, are in fact poorly sorted (cohesive mud-sand mixture) and crudely laminated. They correspond to the frictional fine-grained region of an erosive traction carpet formed by intense shear stress at the base of a highly concentrated flow. Even if the patterns identified by Falvard and Paris (2017) are probably not valid for all tsunami deposits, their results demonstrate the great potential of X-CT for defining globally applicable laws for the interpretation of tsunami deposits.
3.3 - Geoarchaeological Tsunami Deposits research advancements, Crete Island (Greece) case study
The catastrophic Tohoku-oki tsunami of 11 March 2011 was an extremely powerful event, and many images were taken concerning the impact of this very large tsunami on urban environments, available on the internet. Such visual records are important to comprehend, recognize and decipher paleotsunami deposits in ancient urban centers that are investigated by archaeological excavations.
A progressing tsunami flow can be seen in Figure 3.3.1. The wave demolishes houses, partly or completely, and other human-made constructions situated in its path. The local soil/sediment surface, i.e. the geological substratum, is also partly eroded and transported by the water flow. Both human-made objects and geological/soil materials are chaotically mixed and transported forward by the tsunami. The muddled jumble is dropped as chaotic deposits along the path of its flow, first the heavier objects and gradually lighter materials as the onward and possible backward flows diminish in strength (Figure 3.3.2).
Figure 3.3.1: The front of the destructive tsunami wave flowing through houses and agricultural fields of Sendai, a large coastal city in northeastern Japan. Dark soil/sediment, building debris, and human-made objects are chaotically mixed in the progressing tsunami wave ( http://11reviews.blogspot.com/2011/04/japan-tsunami-march-201103-sendai.html).
Figure 3.3.2: The coastal town of Minamisanriku in northeastern Japan on March 13, 2011, two days after the tsunami. Destroyed buildings and chaotic deposits, showing mixed debris lying above and inside sediments dumped by the tsunami. © REUTERS/Kyodo, The Atlantic, Alan Taylor, March 13, 2011, 33 photos in focus. ( https://www.theatlantic.com/photo/2011/03/japan-earthquake-aftermath/100023/)
"The present is the key to the past" is a well-known concept in the geological sciences. Indeed, the recent Tohoku-oki tsunami of 2011, widely covered by the media, will undoubtedly assist to diagnose and interpret ancient tsunami deposits. Concerning the Mediterranean region, there are many ancient coastal cities that may have been hit by tsunamis in the past. However, astonishing little research has been done so far in this field. One of the reasons is that archaeologists, excavating urban sites along the Mediterranean, have usually been trained in archaeological aspects related to architecture (walls, floors) and pottery, but not in the earth sciences. Hence their insights regarding geological, sedimentological, geomorphological and soil features in archaeological excavations are usually limited. It is, therefore, no surprise that comparatively little tsunami evidence has been recognized by “urban” archaeologists. Even in New Zealand, where archaeological remains along the coast have a much more rural character, McFadgen and Goff (2007:263) noticed that ‘‘Tsunami evidence has rarely been proposed from archaeological sites, primarily because of a limited understanding of the requisite evidence and environmental context’’. The recognition and study of tsunami deposits at archaeological coastal sites can be regarded as a new geoarchaeological field that needs to be developed (Bruins et al., 2008:195). Archaeological formation processes are known to a considerable extent (Schiffer, 1987). Also, a variety of paleo-tsunami signatures have been recognized and described in various deposits worldwide, including the Mediterranean region (Scheffers and Kelletat, 2004; Dominey-Howes et al., 2006). What is usually lacking in archaeological excavations is the ability to differentiate tsunami impact and its ramifications in archaeological strata from “normal” site formation processes.
Geoarcheology at the Minoan town of Palaikastro, Crete (Greece)
The following examples of ancient tsunami deposits discovered in Greece, in the Minoan town of Palaikastro (Figure 3.3.3), in Crete (Bruins et al., 2008). highlight well the potential of geoarcheology in the paleotsunami research.
The tsunami occurred during the Late Minoan IA period, at some time during the middle part of the 2nd millennium BCE, was caused by the huge volcanic eruption at the Santorini islands in the Aegean Sea, situated about 155 km northeast of Palaikastro located along the coast of northeastern Crete (Bruins et al., 2008, 2009; Bruins and Van der Plicht, 2014). In the course of the long-standing archaeological excavations at Palaikastro, the possibility of tsunami impact was first raised during 1986, when excavations of Building 2 (located in the “Exc” area of Figure 3.3.3) revealed puzzling destruction features (MacGillivray et al., 1987: 150-151). However, it was not clear whether a previous earthquake or a possible tsunami were responsible for the levelling of Building 2. About a decade later, the archaeologists Driessen and Macdonald (1997: 90) wrote regarding Building 2: ‘‘In searching for tsunami evidence, we are mostly clutching at straws. Further work is clearly required in this area’’. Subsequent field research by Bruins, in cooperation with MacGillivray, deputy-director of the investigations, led to detailed discoveries of tsunami deposits, found to be widespread along the Promontory and East Beach of the Palaikastro site (Figure 3.3.3).
Figure 3.3.3: The bay of Palaikastro and the surrounding landscape, looking southward. Ancient tsunami deposits and impact features were discovered in relation to archaeological stratigraphic phases and ancient buildings along the Promontory (Figure 3.3.4), the East Beach (Figure 3.3.5) and the main site of archaeological excavations, indicated by “Exc” (Photo by H.J. Bruins, taken from Mount Kastri).
Most of these deposits are characterized by a chaotic mixture of building remains, human-made objects, particularly broken pottery sherds, as well as various geological materials, including local soil and sometimes even reworked volcanic tephra from the Minoan Santorini eruption. The term “geoarchaeological tsunami deposits” was coined by Bruins in view of this mixed facies of geological materials and human-made objects. Their genesis may be paralleled with modern examples, such as visible in Figures 3.3.1 and 3.3.2 regarding the 2011 Tohoku-oki tsunami in Japan.
The following tsunami signatures were recognized in the geoarchaeological tsunami deposits (Figure 3.3.4) at Palaikastro (Bruins et al., 2008): (1) Erosional contact with the underlying strata; (2) Volcanic ash intraclasts in the lower part of the deposit; (3) Remains of building foundations and reworked building stone material in the lower part of the deposit; (4) Individual marine shells; (5) Marine micro-fauna; (6) Imbrication of rounded beach pebbles, building debris, ceramic sherds and even bones; (7) Multi-modal chaotic composition.
Figure 3.3.4: A cliff section along the East Beach at Palaikastro (Crete), showing various tsunami signatures, including a sharp unconformity (erosional contact) between the well-sorted sediments in the lower part of the picture, overlain by chaotic geoarchaeological tsunami deposits. For scale, the white stick, standing on the erosional contact, is 100 cm long. The lower part of the chaotic tsunami deposit shows remains of a building foundation to the left and many dislocated building stones. Higher up in the section occur smaller pieces of stones, beach pebbles, pottery sherds, marine shells and sometimes volcanic ash intraclasts, all mixed with fine particles of local reddish soil (Photo by H.J. Bruins).
An important diagnostic characteristic of the multimodal chaotic deposits is the predominant horizontal orientation of pottery sherds, stone slabs and even animal bones (Figure 3.3.5). This is quite uncommon in archaeological layers, as most site formation processes tend to randomize the spatial orientation of artefacts (Schiffer, 1987). Another feature visible in Figure 3.3.5, indicative of tsunami deposition, is a discontinuous layer of well-rounded beach pebbles, which were also swept along with the tsunami flows and deposited in between horizontally oriented stacked ceramic sherds. Obviously, such facies cannot be explained by “normal” archaeological site formation processes. Pottery sherds and other flat building debris are well suited, due to their shape, to obtain imbrication patterns by tsunami flows.
Figure 3.3.5: Chaotic geoarchaeological tsunami deposits at Palaikastro, Crete (Greece), visible at the Promontory (Bruins et al., 2008, pp198, Fig. 7). These multimodal chaotic deposits show a mixture of human-made objects originating from destroyed buildings, including stone slabs, wall plaster, pottery sherds, food remains (cattle bones), all mixed with local reddish soil and beach pebbles. Many of the objects show imbrication patterns, deposited as “roof tiles” on each other, indicative of powerful water flows (Photo by H.J. Bruins).
Considering the elevation of these deposits on the East Beach cliff and the lower sea level in Minoan times, the tsunami wave(s) must have been higher than 9 m to reach the buildings on these elevated parts with sufficient destruction impact. The backwash flow was probably less powerful on the elevated Promontory and East Beach cliff, while the remaining wall remnants of destroyed Minoan buildings helped to retain debris (compare also with Figure 3.3.2).
Although we tried during the field research to find traces of the runup level of the tsunami caused by the Minoan Santorini eruption, we were unable to detect related diagnostic signatures. The surrounding landscape, as visible in Figure 3.3.3, is on the one hand characterized by the rather steep slopes of Mount Petsofas, and on the other hand by agricultural fields on the lower slopes and in the broad valley. Both erosion and agricultural activities have probably erased runup features beyond recognition. One has to realize that, unlike modern
tsunami events, in which runup can be studied immediately, palaeotsunami research may not be able to detect all elements of a tsunami event in the landscape, after ca 3.500 years, in this case. Indeed, as noted by Bruins et al (2008) a detailed stratigraphic recording and preservation mechanism is required with sufficient resolution and memory capability in space and time, which may be lacking in the natural landscape. Ancient human settlements and archaeological excavations along the coast may sometimes provide such a detailed stratigraphic framework, in which buried tsunami signatures may become both exposed and recognizable.
Micromorphology studies under the petrographic microscope of undisturbed in situ samples of tsunami deposits at Palaikastro formed an important part of the research (Bruins et al., 2008). The technique for taking samples of unconsolidated soils and sediments was developed first in the field of soil science (Osmond and Bullock, 1970), expanding in recent years into a large number of micromorphology specializations (Nicosia and Stoops, 2017). Undisturbed samples of the Palaikastro tsunami deposits were impregnated by epoxy in a specialized lab in order to facilitate the making of thin sections. Thus, their micromorphology could be studied, showing important key constituents on the micro-scale, including coralline algae, foraminifera and inter-tidal zone components, such as pieces of cemented beach-rock and rounded beach sand, which occur mixed with local reddish soil in these multimodal deposits.
The geoarchaeological tsunami layer is visible over a wide area (ca 200 m) along the Promontory and East Beach cliffs, albeit with local variations. These chaotic deposits cannot be explained by sea storms. Morton et al. (2007) made a comparative study of sandy tsunami and storm deposits. They noticed that sea storm inundation is a gradual process, involving many waves, which transport sediment primarily as bed load by traction, leaving numerous discrete layers. The differences between sedimentation by tsunamis and sea storms in the Mediterranean were presented and discussed for many locations by Vött et al. (2019). Concerning the above deposits at Palaikastro, it is clear that sea storms cannot account for imbrication of large stone objects and pottery sherds, as shown in Figure 3.3.5. Moreover, these deposits are multi-modal, containing a range of particles of different sizes from clay to building stones. Tsunami action is capable to smash, erode, transport, mix and dump such a variety of objects and particle sizes, as can be seen in Figures 3.3.1 and 3.3.2 regarding the 2011 Tohoku-oki tsunami in Japan. Anyway, powerful storms like hurricanes do not occur in the Mediterranean region, which is the main geographic focus of this article.
3.4 - Boulders deposits in the Mediterranean Sea: examples from its western and central parts
The presence along the Mediterranean coast of large boulders of exceptional size - compared to those normally accumulated inland by storm surges - was firstly reported by Pirazzoli et al (1999) along the coast of the Euboean Gulf, in Greece. Since then, numerous studies have reported anomalous boulders accumulations in several sites of the long coastal perimeter of the Mediterranean (i.e.: Mastronuzzi and Sansò, 2000; 2004; Kelletat and Schellmann, 2002; Whelan and Kelletat, 2002; Scicchitano et al., 2007; Mastronuzzi et al., 2007; Vött et al., 2008;
2019b; Scheffers et al., 2008; Maouche et al., 2009; Barbano et al., 2010; Alvarez-Gómez et al., 2011; Mastronuzzi and Pignatelli, 2012; Shah-Hosseini et al., 2013; Lario et al., 2017; Roig-Munar et al., 2018; 2019). The particular conformation of the basin and the articulation of some coastal tracts could amplify storm waves providing them particular energy which may also be able to move boulders of exceptional sizes producing phenomena of morphological convergence (Mastronuzzi and Sanso, 2004, 2006; Mastronuzzi et al., 2006; Biolchi et al., 2016; 2019; Piscitelli et al., 2017). The interpretation of the morphogenetic process responsible for the accumulation of these unusual deposits does not find a consensus among scientists, although it is well known that large boulders have been accumulated by recent tsunamis. Eyewitnesses permitted to ascribe the accumulation of mega boulders to the impact of both 2004 IOT and 2011 Tohoku-oki tsunamis (i.e.: Goto et al., 2007; 2011; Wallis et al., 2018; Iwai et al., 2019 and references therein) however, very strong storms may cause the accumulation of large boulders too (Switzer and Burston, 2010, Cox et al., 2019). Because of this and in absence of a direct evidence, the first question to answer about boulders is about their origin: storms (tempestite) or paleo-tsunamis (tsunamite)?
In recent years, studies on large boulders focused on two main objectives that are to identify their origin and to define the hazard and vulnerability of the territory with respect to their genesis. Important results derive from studies at different sites along the Mediterranean coast: specifically (ì) along the eastern coasts of Spain and of Balearic Islands (Alvarez-Gómez et al., 2011; Lario et al., 2017; Roig-Munar et al., 2018b; 2019a), both faced to the Algerian coast known as a seismic and tsunamigenic area, (ìì) along the coast of Puglia (Mastronuzzi e Pignatelli, 2012), in the southernmost part of Italy, placed between the seismo- and tsunami-genic areas of the Apennine and Dinaric, Albanid and Hellenid chains, and (ììì) on the island of Malta (Biolchi et al., 2016) in the center of Mediterranean basin.
Spanish Coast
The Mediterranean Spanish Coast has very few geological records of EWE (Extreme Wave Events) such as tsunamis or storm surges. Some historical tsunamis have been reported in the region, however, their impact at the coast was negligible. During the past years some boulders deposits, usually with ridge morphology, have been studied (Figure 3.4.1).
Tsunami generation models show that in the Iberian Peninsula, Murcia is the province potentially affected by the greatest tsunamis, mainly generated by large seismic events in Northern Algeria. The Balearic Islands of Ibiza and Minorca also may be affected by the highest maximum wave heights passing the four-meters mark locally. (Alvarez-Gómez et al., 2011). The hazard decision matrix for tsunamis on the Spanish Mediterranean coast indicates that a 6.0-6.5 Mw earthquake less than 40 km offshore and at a depth of less than 100 km would have the potential to generate a locally destructive tsunami (IOC, 2011).
Different approaches to calculate the minimum height of the tsunami wave or storm wave capable of moving the boulders found along the coastline have been applied using formulas for a JBB scenario by Engel and May (2012) and for a