The Honeybee Gut Microbiota Is Altered after Chronic Exposure to Different
Families of Insecticides and Infection by Nosema ceranae
Régis Rouzé
1, Anne Moné
1, Frédéric Delbac
1, Luc Belzunces
2, and Nicolas Blot
1*
1
Université Clermont Auvergne, CNRS, Laboratoire “Microorganismes: Génome et Environnement”, F-63000 Clermont–Ferrand,
France; and
2INRA, Laboratoire de Toxicologie Environnementale, UR 406 A&E, CS 40509, 84914 Avignon, France.
(Received December 21, 2018—Accepted April 1, 2019—Published online August 3, 2019)
The gut of the European honeybee Apis mellifera is the site of exposure to multiple stressors, such as pathogens and ingested
chemicals. Therefore, the gut microbiota, which contributes to host homeostasis, may be altered by these stressors. The abundance
of major bacterial taxa in the gut was evaluated in response to infection with the intestinal parasite Nosema ceranae or chronic
exposure to low doses of the neurotoxic insecticides coumaphos, fipronil, thiamethoxam, and imidacloprid. Experiments were
performed under laboratory conditions on adult workers collected from hives in February (winter bees) and July (summer bees)
and revealed season-dependent changes in the bacterial community composition. N. ceranae and a lethal fipronil treatment
increased the relative abundance of both Gilliamella apicola and Snodgrassella alvi in surviving winter honeybees. The parasite
and a sublethal exposure to all insecticides decreased the abundance of Bifidobacterium spp. and Lactobacillus spp. regardless
of the season. The similar effects induced by insecticides belonging to distinct molecular families suggested a shared and
indirect mode of action on the gut microbiota, possibly through aspecific alterations in gut homeostasis. These results demonstrate
that infection and chronic exposure to low concentrations of insecticides may affect the honeybee holobiont.
Key words: honeybee microbiota, insecticides, parasite, dysbiosis
Insects are exposed to many stressors in their environment,
particularly their gut since it is both the site of development
of many pathogens and the site of exposure to ingested
xeno-biotics. At the interface between the environment and the
insect, the gut microbiota is sensitive to biotic and abiotic
stressors. The consequences for the host of dysbiosis may be
pleiotropic because the microbiota is connected to the
physi-ologies of the gut and nervous and immune systems (56, 71).
The environmental stressors of the European honeybee
(Apis mellifera) have attracted interest due to the ecological
and economical importance of this pollinator as well as the
colony losses that have been observed worldwide over the
last few decades (19, 79). The origin of these losses is
assumed to be multicausal, involving pathogens, such as the
highly prevalent gut parasite Nosema ceranae, and agrochemical
contaminants, particularly neurotoxic insecticides (34, 39).
N. ceranae is a fungal-related parasite belonging to
Microsporidia. This obligate intracellular parasite proliferates
within the epithelial cells of the adult honeybee midgut and
affects metabolic, digestive, and immune functions as well as
the gut epithelium renewal rate (5, 39, 64). Consequently, N.
ceranae may reduce the honeybee lifespan and provoke colony
depopulation.
Honeybees are also exposed to a number of pesticides
through the foraging of contaminated pollen and nectar that
are brought back to the colony (10). Some chemicals are
deliberately introduced into hives by beekeepers, particularly
the acaricides used against the ectoparasite Varroa destructor.
These pesticides may be detected in hive matrices, including
wax, pollen, and honey (8, 18, 51, 62). Therefore, all colony
members are chronically exposed, particularly through their
diet. The most abundant and ubiquitous contaminants of
matrices are varroacides. Systemic insecticides commonly used
in agriculture, including neonicotinoids and phenylpyrazoles,
are also frequently detected in hives. These compounds are
neurotoxic insecticides (14). Even at low doses, they may
alter honeybee behavior, learning, and memory and induce an
immune response as well as increases in detoxifying activities
(9, 17, 20, 32, 33). Some of these effects, including cell damage,
have also been observed in the midgut (5, 13, 15, 63).
N. ceranae and ingested pesticides are in contact with the
honeybee gut and may alter its physiology. Therefore, the
composition and function of gut microbial communities may
be affected by these stressors (35, 44, 53). The worker honeybee
gut core microbiota, which is shared among individuals, is
composed of five major bacterial taxa comprising the
Lactobacillus Firm-4 and Lactobacillus Firm-5 clades, the
Gammaproteobacteria Gilliamella apicola and Snodgrassella
alvi, and species related to the Bifidobacterium asteroides
cluster (49). Other taxa, although less abundant, are also
present, particularly Alphaproteobacteria. Most of the 10
8to
10
9intestinal bacteria are localized within the hindgut. The
crop and midgut are less colonized (36). The intestinal
micro-biota contributes to host homeostasis. It stimulates the immune
system, constitutes a biological barrier against pathogens, and
participates in digestion (29, 49, 50, 52, 80). Thus, the impact
of stressors on the honeybee and its gut may be explained, at
least partially, by an imbalanced microbiota, i.e. dysbiosis.
In the present study, we investigated how the composition
of the honeybee gut microbiota may be affected under laboratory
conditions after an infection with N. ceranae or after a chronic
exposure to neurotoxic insecticides belonging to three families:
the phenylpyrazole fipronil, the neonicotinoids thiamethoxam
and imidacloprid, and the organophosphate acaricide coumaphos.
Quantitative real-time PCR (qPCR) was used to assess changes
* Corresponding author. E-mail: nicolas.blot@uca.fr; Tel: +33 4 73 40 74 57.
in the abundance of the major bacterial groups of the honeybee
core microbiota, namely, Lactobacillus spp., Bifidobacterium
spp., Alphaproteobacteria and Gammaproteobacteria, and
the species G. apicola and S. alvi.
Materials and Methods
Honeybee artificial rearing, infection with N. ceranae, and chronic exposure to insecticides
Two experiments were performed using A. mellifera interior worker bees collected on the frames of five colonies of the same apiary at the Laboratoire Microorganismes: Génome et Environnement (Clermont-Ferrand, France) in February 2017 (winter bees) and July 2017 (summer bees). Each of the five colonies represented an independent replicate. Honeybees were anesthetized with CO2 and placed into groups of 70 individuals in Pain-type cages containing a 5-mm piece of PseudoQueen (Inkto Supply, Vancouver, Canada). Honeybees were maintained at 33±1°C under a humidified atmosphere and fed 50% (w/v) sucrose syrup supplemented with 1% (w/v) Provita’Bee (ATZ Diététic, Mas Cabardès, France) ad libitum, as previously described (4). Dead bees were removed and sucrose consumption was quantified daily.
Seven experimental groups, including an untreated control, were tested for each colony replicate. Honeybees were collectively infected using a feeder containing approximatively 150,000 spores per bee in 2.5 mL of sugar syrup that was maintained for 24 to 34 h until complete consumption. N. ceranae spores were obtained from previously infected honeybees and purified according to Vidau et al. (81). Chronic exposure to insecticides was performed by feeding non-infected honeybees with sugar syrup supplemented with either 0.25 or 1.0 μg kg–1 fipronil, 650 μg kg–1 coumaphos, 1.7 μg kg–1 thiamethoxam, or 3.5 μg kg–1 imidacloprid. Insecticide stock solu-tions were prepared in DMSO, leading to a final concentration of 0.05% DMSO (v/v) in the syrup. Non-intoxicated bees (i.e. untreated control and infected honeybees) were fed syrup supplemented with 0.05% DMSO. According to the acute lethal dose (LD50) (62), the daily mean consumption of insecticides was below 1:194th of the LD50 for coumaphos, thiamethoxam, and imidacloprid, and below 1:550th and 1:150th of the LD50 for low and high fipronil exposure, respectively (Fig. S1).
Gut sampling and DNA purification
Honeybees were sacrificed 18 d after the initiation of experiments, but 15 d for the highest dose of fipronil due to high mortality, along with the corresponding controls. Regarding each replicate, the hindguts of 7 honeybees were dissected on ice, pooled, flash frozen in liquid nitrogen, and stored at –80°C. The presence or absence of N. ceranae spores was checked by microscopy (×400) before pooling. Samples were homogenized in 800 μL of RLT buffer (Qiagen) and ground using a microtube pestle. The mixture was transferred to a tube containing 0.150 g of 0.1-mm silica beads and cells were mechanically disrupted by a set of 6 bead-beating pulses of 30 s at 30 Hz, with 30-s interruptions (28). After 3 series of thermal shocks at 65°C and in liquid nitrogen, samples were centrifuged at 8,000×g for 5 min and 200 to 300 μL of the clear supernatant was transferred to a new tube, carefully avoiding both pelleted and floating slimy materials. One volume of ethanol containing 1% (v/v) of 2-mercaptoethanol was added to the sample, which was then transferred to a DNeasy spin column for DNA purification (DNeasy Mini Kit, Qiagen). DNA concentrations were quantified using the bisBenzimide DNA Quantitation Kit, Fluorescence Assay (Sigma-Aldrich).
PCR quantification of bacterial taxa abundance
The theoretical specificity of primer pairs for the 16S rRNA gene was evaluated using the Testprime 1.0 tool (46) to estimate the coverage of bacterial taxa from the SILVA 132 database. Coverage was also estimated on honeybee microbiota 16S rRNA sequences from previous experiments (2, 21, 23, 59, 61, 83), requiring
sequence assignment and selection. Taxonomic assignment was performed through a Blast search against the SILVA 132 database, keeping only sequences with >98% identity. Data reported by Corby-Harris et al. (21) were used to assign Lactobacillus sp. sequences to the Firm-4 and Firm-5 clades. Only sequences covering the whole amplicon were considered for each primer set, while sequences with ambiguous positions in the priming regions were removed. Primer sets have been experimentally tested for their ability to fulfill qPCR quality requirements (12) on honeybee gut material by checking their specificity (by gel electrophoresis), linear dynamic range, efficiency, and amplification reproducibility using 1:4 serial dilutions of gut DNA extracts.
qPCR was performed on a CFX96 Real-Time System Thermocycler (BioRad) in 96-well plates (Eurogentec RT-PL96-MQ) in a final volume of 20 μL containing 10 μL of 2X Absolute Blue qPCR SYBR Green Mix (Thermo Scientific), 10 pmol of each primer (Table 1), and 2 to 24 ng of total genomic DNA. The PCR program consisted of an initial step at 94°C for 10 min, and 40 cycles comprising 94°C for 25 s, 25 s of annealing at 53°C, and 25 s of elongation at 72°C. Treated and untreated samples from an identical replicate were always deposited on the same plate and all plates were duplicated. The specificity of the reactions was assessed by analyzing the melting curves of the amplified products (Bio-Rad CFX Manager software). The Cycle Quantification (CQ) values obtained were proportional to the log of input DNA amounts.
In contrast to previous studies, in which qPCR data were normalized to total DNA content or sample weights, we selected the total bacterial content as a reference. Therefore, we avoided biases due to non-bacterial DNA, e.g. DNA from N. ceranae or the honeybee, or those due to the loss of material following dissection or defecation. The total bacterial DNA content was estimated by the mean of CQ values obtained with both the 341F/534R and BAC338F/BAC805R primer pairs (Table 1). It is important to note that the two pairs gave very similar CQ values (correlation coefficient of 0.985; n=197). In each taxonomic group, the corresponding CQ was subtracted from the mean reference CQ of the same sample. Normalized CQ were then compared pairwise. The log2 of the ratio of a taxonomic group under the treated condition relative to the untreated condition was obtained by subtracting the normalized CQ of the control from the normalized CQ of the treated sample from the same colony and sampling day. Statistical analyses were performed using PAST software (37).
Results
Honeybees were exposed to the parasite N. ceranae or to
low doses of the four neurotoxic insecticides. Daily sugar
consumption was constant throughout the experiment and not
significantly different between groups (Fig. S1). Survival
analyses showed a significant decrease in honeybee survival
for both winter and summer honeybees infected with N.
ceranae or exposed to the highest dose of fipronil (Fig. S2).
The four other insecticide treatments did not significantly
reduce honeybee survival.
In order to assess the abundance of major bacterial taxa,
published primer pairs targeting the 16S rRNA gene were
checked for qPCR quality (Table 1). Ten primer pairs were
eventually selected that target: total bacteria (two pairs),
Alphaproteobacteria, Bifidobacteriaceae (almost exclusively
represented by Bifidobacterium spp. in the honeybee gut),
Lactobacillus spp. with one pair recognizing all Lactobacillus
spp. (including Firm-4, Firm-5, and L. kunkeei clades) and another
the Lactobacillus Firm-5 clade only, Gammaproteobacteria,
G. apicola species, and S. alvi species (two pairs, including
one recognizing Neisseriaceae that are almost exclusively
represented by S. alvi in the honeybee microbiota). Principal
component and ANOVA2 analyses suggested that season
Table 1. Primer pairs tested for the QPCR quantification of the honeybee microbiota major bacterial taxa. Primer pairs and sequences (5′→3′) Targeted group and % coverage in SILVA database (in honeybee microbiota) Amplicon size
(bp) Linearity (r²) Efficiency (E) validated DNA rangea and CQ range Refe-rence Bacteria 341F CCTACGGGAGGCAGCAG * 534R ATTACCGCGGCTGCTGGCA * Bacteria 81.7 169–195 r² = 0,999E = 0,92 50 pg to 50 ngCQ 10 to 22 11 BAC338F ACTCCTACGGGAGGCAG *
BAC805R GACTACCAGGGTATCTAATCC * Bacteria 77.4 443–469 r² = 0,999E = 0,85 50 pg to 10 ng
b CQ 13.5 to 23
86 BACT1369F CGGTGAATACGTTCYCGG
PROK1492R GGWTACCTTGTTACGACTT Bacteria 25.4 133–146 r² = 0,999E = 0,84 50 pg to 50 ngCQ 11 to 23 77 926F AAACTCAAAKGAATTGACGG 1062R CTCACRRCACGAGCTGAC Bacteria 78.4 172–179 r² = 0,999E = 0,87 50 pg to 50 ngCQ 11 to 22 6 Bifidobacterium spp. Bifi-F2 TCGCGTCYGGTGTGAAAG *
Bifi-R2 CCACATCCAGCRTCCAC * Bifidobacteriaceae 89.3 Bifidobacterium spp. 89.0 (96.1, n=51) 243 r² = 0,999E = 0,78 50 pg to 50 ngCQ 14.5 to 25 70 Bifi-F1 CAAGCGAGAGTGAGTGTACC
Bifi-R1 GCCGATCCACCGTTAAGC Bifidobacterium spp. 2.5 (88.7, n=53) 165 r² = 0,999E = 0,90 C50 pg to 50 ngQ 14.5 to 25.5 53 Act920F3 TACGGCCGCAAGGCTA
Act1200R TCRTCCCCACCTTCCTCCG Actinobacteria 86.7Bifidobacteriaceae 84.8
Bifidobacterium spp. 86.5 (94.2, n=52)
299–307 r² = 0,999
E = 0,67 not validated 6
Lactobacillus spp.
Lact-F1 TAACGCATTAAGCACTCC *
Lact-R1 GCTGGCAACTAATAATAAGG * Lactobacillus L. kunkeei (0, n=875)3 (28.6, n=1,705)
Firm-4 (0, n=88) Firm-5 (97.2, n=424) 270 r² = 0,998 E = 0,89 C50 pg to 50 ngQ 13.5 to 24.5 53 Lact-F2 AGCAGTAGGGAATCTTCCA *
Lact-R2 CACCGCTACACATGGAG * Lactobacillus L. kunkeei (96.8, n=875)87.2 (95.7, n=1,690) Firm-4 (97.7, n=88) Firm-5 (91.7, n=424) 341 r² = 0,997 E = 1,08 50 pg to 10 ng b CQ 14 to 23 70 928F-Firm TGAAACTYAAAGGAATTGACG
1040FirmR ACCATGCACCACCTGTC Firmicutes 73.7Lactobacillales 73.3
Lactobacillus (43.6) (69.1, n=1,705) L. kunkeei (97.7-8, n=875) Firm-4 (97.7, n=88) Firm-5 (0.5, n=424) Mollicutes 39.8 149–157 r² = 0,998 E = 0,83 50 pg to 10 ng b CQ 14.5 to 23.5 6 Alphaproteobacteria a682F CDAGTGTAGAGGTGAAATT *
908aR CCCCGTCAATTCCTTTGAGTT * Alphaproteobacteria 63.6 Bartonella 25.4 (89.6, n=77) Acetobacteraceae 0.8 (10.0, n=201) 245–250 r² = 0,998 E = 0,91 50 pg to 50 ngCQ 14.5 to 25 6 Gammaproteobacteria 1080γF TCGTCAGCTCGTGTYGTGA *
γ1202R CGTAAGGGCCATGATG * Gammaproteobacteria 61.2 Gilliamella 96.9 (97.1, n=516) Snodgrasella 0 (0, n=342) Enterobacteriales 94.0 146–160 r² = 0,999 E = 0,90 50 pg to 50 ngCQ 14.5 to 25 6 Snodgrasella alvi Neiss-F AAGCGGTGGATGATGTGG *
Neiss-R TGATGGCAACTAATGACAAGG * Neisseriaceae 79.4 Snodgrassella 86.4 (95.1, n=344) Snodgrassella alvi 100 (95.6, n=226)
194–199 r² = 0,999
E = 0,90 C50 pg to 50 ngQ 13.5 to 23.5 53 Beta-1009-qtF CTTAGAGATAGGAGAGTG *
Beta-1115-qtR AATGATGGCAACTAATGACAA * Snodgrasella 77.3 (93.0, n=344) Snodgrassella alvi 76.9 (94.2, n=226) 127–128 r² = 0,999E = 0,87 50 pg to 50 ngCQ 15 to 24 60 Snod-F GGAATTTCTTAGAGATAGGAAAGTG
Snod-R TTAATGATGGCAACTAATGACAA Snodgrasella 11.4 (0, n=344) Snodgrassella alvi 23.1 (0, n=226) 136 r² = 0,999E = 0,86 50 pg to 50 ngCQ 15 to 26 85
Gilliamella apicola
G1-459-qtF GTATCTAATAGGTGCATCAATT *
G1-648-qtR TCCTCTACAATACTCTAGTT * Gilliamella 23.0 (71.6, n=232) Gilliamella apícola 22.9 (80.7, n=109) 210 r² = 0,999E = 0,91 C50 pg to 50 ngQ 14.5 to 25.5 60 Gill-F CCTTTGTTGCCATCGATTAGG
Gill-R GACATTCTGATTCACGATTACTAGC Gilliamella 28.0 (1.7, n=355) Gilliamella apícola 37.5 (0.9, n=233) 249 r² = 0,999E = 0,83 50 pg to 50 ngCQ 16.5 to 28 85 Past-F TTGTTGCCAGCGATTAGG
Past-R ATTCTGATTCACGATTACTAGC Gilliamella apícola 4.2 (2.1, n=233) Frischella perrara 100 (94.9, n=59) 243 r² = 0,998E = 0,75 200 pg to 50 ng c CQ 18 to 27.5
53
Bacteroidetes
798cfbF CRAACAGGATTAGATACCCT
cfb967R GGTAAGGTTCCTCGCGTAT Bacteroidia 86.2 (100, n=44)Spirochaetaceae 42.8 202–208 r² = 0,998E = 0,90 C50 pg to 50 ngQ 21.5 to 33 d 6 a total DNA from the honeybee gut
b not quantitative for higher DNA concentrations c not quantitative for lower DNA concentrations d high CQ precluded any analyses
was the main factor explaining differences in the abundance
of these taxa (Fig. S3). More than 79% of variance was
explained by one principal component that appeared to be
mainly linked to season and partly to treatments, particularly
to N. ceranae infection.
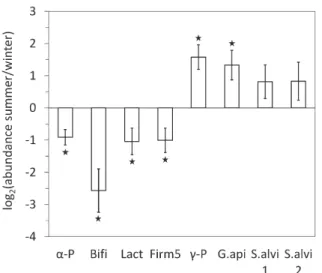
The abundance of the major bacterial taxa was initially
compared between summer and winter in untreated honeybees.
Bifidobacterium spp., Lactobacillus spp., Lactobacillus
Firm-5, and Alphaproteobacteria were significantly more abundant
in winter, while G. apicola and Gammaproteobacteria were
both more abundant in summer (Fig. 1). The core microbiota
of the gut was subjected to global seasonal variations.
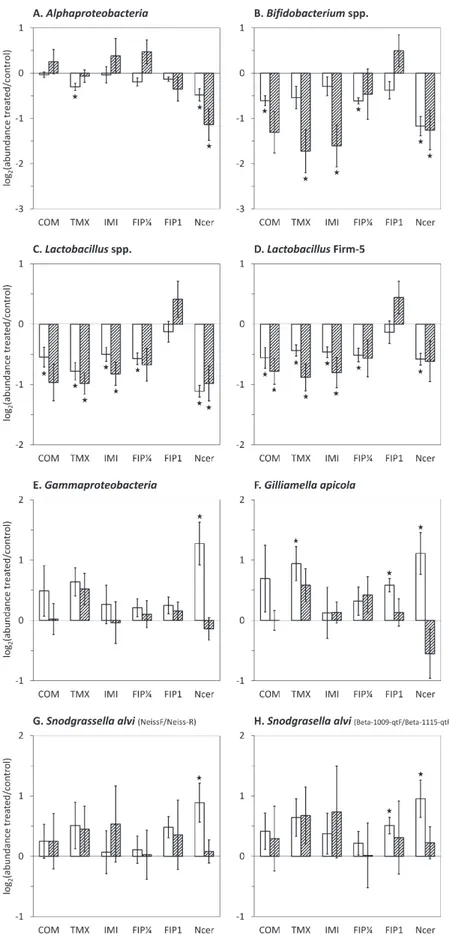
The abundance of bacterial groups in honeybees chronically
exposed to fipronil, imidacloprid, thiamethoxam, or coumaphos
was then compared to the untreated control (Fig. 2). Sublethal
exposure to all insecticides induced a significant decrease in
the relative abundance of Lactobacillus spp. in winter and
summer honeybees, except for the treatment with the lower
dose of fipronil (0.25 μg kg
–1) for which the decrease was not
significant in summer. The highest and lethal dose of fipronil
(1 μg kg
–1) did not significantly change Lactobacillus spp.
abundance. Similar results were obtained with all Lactobacillus
spp. or the Firm-5 clade only. A significant decrease in the
abundance of Bifidobacterium spp. was observed in response
to imidacloprid and thiamethoxam in summer honeybees and
to coumaphos and the low dose of fipronil (0.25 μg kg
–1) in
winter honeybees. The abundance of Bifidobacterium spp.
was not affected by the lethal dose of fipronil. Chronic exposure
to insecticides induced other significant variations, but in
winter honeybees only, with a decrease in the relative abundance
of Alphaproteobacteria in response to thiamethoxam (Fig.
2A), an increase in G. apicola in response to thiamethoxam
and 1 μg kg
–1fipronil (Fig. 2F), and an increase in S. alvi in
response to 1 μg kg
–1fipronil using S. alvi-, but not
Neisseriaceae-specific primers (Fig. 2G and H). Collectively, these results
showed the similar effects of sublethal doses of insecticides
that were more significant in winter honeybees.
N. ceranae infection induced variations in the proportion
of all bacterial groups tested (Fig. 2). The abundance of
Alphaproteobacteria, Bifidobacterium spp., and Lactobacillus
spp. was significantly decreased by the parasite regardless of
the season. In contrast, Gammaproteobacteria, G. apicola,
and S. alvi significantly increased in winter honeybees only.
However, one phylotype identified as S. alvi was less
abundant in infected bees, as shown by Denaturating Gradient
Gel Electrophoresis (Fig. S4), suggesting the complex
rebal-ancing of S. alvi strains in infected honeybees.
Discussion
Seasonality of the honeybee microbiota and of stressor-induced
variations
The abundance of the main bacterial groups of the gut
microbiome differed in summer and winter honeybees (Fig.
1). The higher abundance of G. apicola during the beekeeping
season was already suggested by Ludvigsen et al. (57). In
contrast to previous studies (21, 57) seasonal dynamics were
also observed for Alphaproteobacteria, Bifidobacterium spp.,
and Lactobacillus spp., which were less abundant in summer.
Since the honeybee gut microbiota is influenced by the
envi-ronmental landscape (42), it is logically influenced by season
in temperate areas. Genomic data suggested that G. apicola
participates in digestion through the breakdown of complex
carbohydrates, such as the pectin contained in pollen (29, 52).
The increased abundance of G. apicola in summer may be
related to increases in these resources.
Responses to stressors also differed according to season
(Fig. 2), with more significant results being observed in winter.
The mortality of honeybees exposed to acute neonicotinoid
treatments was previously reported to be higher in winter
than in summer (7). We herein demonstrated that the
micro-biota, and, thus, the holobiont were more sensitive in winter.
The lack of significance in summer bees may be related to a
higher heterogeneity in microbial communities, reflected by
the greater variance of data (Fig. 2 and S3) and higher
α-diversity (57). These findings may be explained by the
greater diversity of resources in summer (25, 42). Moreover,
short-living summer bees have a more diverse physiology,
engaging in the age-dependent division of labor with
succes-sive changes in the endocrine system (73), and microbiota
richness and abundance have been suggested to differ with
ontogenetic stages and behavioral tasks (40, 43). In contrast,
in February, aged overwintering bees are more homogeneous,
clustering inside the hive and feeding on less diverse reserves.
Alterations in the honeybee microbiota by the intestinal
parasite N. ceranae
Pathogens may alter the composition of the honeybee
microbiota (30, 35), and the present results revealed that all
Fig. 1. Comparison of the abundance of major bacterial taxa in the gut microbiota between summer and winter honeybees: Alphaproteobacteria (α-P), Bifidobacterium spp. (Bifi), Lactobacillus spp. (Lact), Lactobacillus Firm-5 clade only (Firm5), Gammaproteobacteria (γ-P), Gilliamella
apicola (G.api), and Snodgrassella alvi (S.alvi1 and S.alvi2 using the
primer pairs Neiss-F/Neiss-R and Beta-1009-qtF/Beta-1115-qtR, respectively). Interior worker honeybees were maintained for 18 d in cages (control conditions) before 16S rRNA gene quantification by qPCR in the hindgut. The y-axis represents the mean log2 of fold changes (FC) in taxon abundance between summer and winter workers. Positive and negative values denote higher and lower abundance, respectively, in summer bees than in winter bees. Data were gathered from five independent colony replicates. Bars represent 95% confidence intervals. Stars indicate significant differences (P<0.05) by a paired Wilcoxon signed-rank test.
Fig. 2. Abundance of major taxa in the gut microbiota of pesticide-exposed or N. ceranae-infected honeybees and untreated honeybees. Interior worker honeybees were submitted to a chronic exposure to 650 μg kg–1 coumaphos (COM), 1.7 μg kg–1 thiamethoxam (TMX), 3.5 μg kg–1 imidacloprid (IMI), 0.25 μg kg–1 (FIP¼), or 1 μg kg–1 fipronil (FIP1) or to an infection with N. ceranae (Ncer). The abundance of bacterial taxa was assessed by qPCR after 15 or 18 d in winter (white bars) and summer (hatched bars) honeybees. The y-axes depict the mean log2 of fold changes (FC) in abundance between treated and untreated samples. Negative and positive values denote lower and higher abundance, respectively, in response to stressors. Data were gathered from five independent colony replicates. Bars represent 95% confidence intervals. Stars indicate significant differences (P<0.05) by a paired Wilcoxon signed-rank test.
major bacterial taxa were affected by N. ceranae (Fig. 2),
with a decrease in lactic acid bacteria (LABs), including
Lactobacillus spp. and Bifidobacterium spp., and an increase
in S. alvi and G. apicola. The increase in S. alvi and G. apicola
may have been due to a rebalance in the microbiota by
occu-pying niches left vacant by LABs. The results of the DGGE
analysis suggested that while all S. alvi species experienced
an increase in abundance, the content of a specific strain
decreased. This opposite variation in strain content was
pre-viously reported for G. apicola in response to an antibiotic
treatment, suggesting variations in the ability of strains to
cope with stress (66). This important dysbiosis was not
observed in A. mellifera in previous studies (41, 54, 58). In
the Asian honeybee A. cerana, Li et al. (53) observed a similar
decrease in the abundance of Bifidobacterium spp., but no
significant change in Lactobacillus spp..
It is unlikely that N. ceranae directly affects gut microbial
communities because its development entirely occurs within
midgut epithelial cells. However, it may alter honeybee midgut
homeostasis. N. ceranae induces a degeneration in the midgut
epithelium and peritrophic matrix (26, 39, 48) that may alter
the activation of the immune system by luminal bacteria (38,
47). The infection also up-regulates the antioxidant system,
reduces the production of reactive oxygen species (ROS) (26,
65, 81, 82), and may provoke immunosuppression by inhibiting
the production of antimicrobial peptides (AMP) (3, 5, 16, 55).
No data are available on the honeybee hindgut. Interestingly,
the microsporidian parasite Paranosema locustae alters the
gut microbiota of Locusta migratoria, but also induces
acidi-fication and an increase in ROS in the hindgut (74, 78). By
affecting the gut ecosystem, possibly through changes in
AMPs, ROS, or pH, N. ceranae may favor or impair bacterial
communities.
Alterations in the honeybee gut microbiota by insecticides
Honeybees were chronically exposed to concentrations of
insecticides that correspond to residue levels detected in hive
matrices (18, 45, 51, 62), denoting realistic exposure. These
treatments led to variations in the honeybee core microbiota
taxa, with a general decrease in LABs (Fig. 2). Kakumanu et
al. (44) also observed a significant decrease in Lactobacillus
spp. in response to the fungicide chlorothalonil, but a slight
increase in Bifidobacterium spp. in response to coumaphos.
This opposite variation in Bifidobacterium spp. suggests the
strong influence of the mode of exposure (oral exposure in
cages vs an in-hive CheckMite+® treatment) on microbial
responses. In contrast to our results, Raymann et al. (68)
reported that imidacloprid did not significantly affect the
microbiota. The treatment with 1.0 μg kg
–1fipronil did not
have a stronger effect on LABs than the 0.25 μg kg
–1treatment,
but induced an increase in G. apicola and S. alvi in winter
(Fig. 2). This higher insecticide concentration was lethal (Fig.
S2) and may have had a strong effect on morbidity in the
microbiota because dying honeybees were sampled.
Insecticides may have a direct impact on bacterial growth
that strongly varies upon insecticides and bacterial strains
(75). Thus, insecticides from different families may not have
the same direct impact on gut bacteria. The similar effects
observed in response to different insecticides (Fig. 2) may
have been due to aspecific changes in the gut homeostasis that
may secondarily affect the microbiota. In the midgut, chronic
and oral exposure to insecticides altered the immune system,
activated antioxidant defenses, and induced damage in epithelial
cells (5, 9, 15, 20, 31, 68). Thus, gut bacterial communities
may have to cope with changes in their environment.
Ingested neurotoxic insecticides are absorbed in the gut
and diffuse throughout the whole insect body (76), eventually
affecting the nervous system (14). Neonicotinoids, such as
thiamethoxam and imidacloprid, induce morphological,
cytological, and transcriptomic alterations in the brain and
disrupt the hormonal balance (20). Thus, besides local effects
on the gut, insecticides exert pleiotropic effects that may, in
turn, affect the gut and its microbiota, which is considered to
be connected to the nervous system in mammals (69). This
indirect impact on the gut has been demonstrated based on
changes in midgut antioxidant activities following a single
topical exposure to fipronil (13).
Dysbiosis may sensitize the honeybee to other stressors
The microbiota protects the host against pathogens by
stimulating the immune system and providing competition
for niche occupation (36). The honeybee gut microbiota is
considered to induce AMP production and the LABs themselves
exhibit antibacterial properties (50, 67, 80). The suppression
of honeybee gut bacteria by antibiotics increased honeybee
vulnerability to N. ceranae (54), and some bacteria, including
LABs, may conversely reduce parasite proliferation (22, 27).
In contrast, feeding supplemented with S. alvi increased honeybee
sensitivity to the trypanosomal parasite Lotmaria passim (72).
The insect microbiota may also comprise strains with the
ability to enhance host resistance to insecticides (84). In the
moth Plutella xylostella, a positive correlation was observed
between Lactobacillales abundance and fipronil resistance.
Moreover, some gut bacteria isolated from insects, including
Lactobacillus spp., are considered to metabolize insecticides
(1, 24). Thus, dysbiosis and a reduction in LABs may sensitize
the honeybee to pathogens and pesticides.
The season-dependent gut microbiota may be regarded as a
modulator of interactions between the honeybee and its
stressors, emphasizing the need to consider the holobiont, i.e.
the insect and its symbionts, both in summer and winter,
when assessing the effects of stressors.
Acknowledgements
The project was funded by the ANR MIXTRESS program (ANR-15-CE34-0004). The authors are thankful to Jérôme Lesobre, Johan Panek, and Laurianne Paris for their support in beekeeping activities and to Clermont Auvergne Métropole for lending the beehive site. The authors declare no conflict of interest.
References
1. Almeida, L.G. de, L.A.B. de Moraes, J.R. Trigo, C. Omoto, and F.L. Cônsoli. 2017. The gut microbiota of insecticide-resistant insects houses insecticide-degrading bacteria: a potential source for biotech-nological exploitation. PLoS One 12:e0174754.
2. Anderson, K.E., T.H. Sheehan, B.M. Mott, P. Maes, L. Snyder, M.R. Schwan, A. Walton, B.M. Jones, and V. Corby-Harris. 2013. Microbial ecology of the hive and pollination landscape: Bacterial associates from floral nectar, the alimentary tract and stored food of honey bees (Apis mellifera). PLoS One 8:e83125.
3. Antúnez, K., R. Martín-Hernández, L. Prieto, A. Meana, P. Zunino, and M. Higes. 2009. Immune suppression in the honey bee (Apis
mellifera) following infection by Nosema ceranae (Microsporidia).
Environ. Microbiol. 11:2284–2290.
4. Aufauvre, J., D.G. Biron, C. Vidau, R. Fontbonne, M. Roudel, M. Diogon, B. Viguès, L.P. Belzunces, F. Delbac, and N. Blot. 2012. Parasite-insecticide interactions: a case study of Nosema ceranae and fipronil synergy on honeybee. Sci. Rep. 2:326.
5. Aufauvre, J., B. Misme-Aucouturier, B. Viguès, C. Texier, F. Delbac, and N. Blot. 2014. Transcriptome analyses of the honeybee response to Nosema ceranae and insecticides. PLoS One 9:e91686.
6. Bacchetti De Gregoris, T., N. Aldred, A.S. Clare, and J.G. Burgess. 2011. Improvement of phylum- and class-specific primers for real-time PCR quantification of bacterial taxa. J. Microbiol. Methods. 86:351–356. 7. Baines, D., E. Wilton, A. Pawluk, M. de Gorter, and N. Chomistek.
2017. Neonicotinoids act like endocrine disrupting chemicals in newly-emerged bees and winter bees. Sci. Rep. 7:10979.
8. Beyer, M., A. Lenouvel, C. Guignard, M. Eickermann, A. Clermont, F. Kraus, and L. Hoffmann. 2018. Pesticide residue profiles in bee bread and pollen samples and the survival of honeybee colonies―a case study from Luxembourg. Environ. Sci. Pollut. Res. https://doi. org/10.1007/s11356-018-3187-4.
9. Boncristiani, H., R. Underwood, R. Schwarz, J.D. Evans, J. Pettis, and D. vanEngelsdorp. 2012. Direct effect of acaricides on pathogen loads and gene expression levels in honey bees Apis mellifera. J. Insect Physiol. 58:613–620.
10. Bonmatin, J.-M., C. Giorio, V. Girolami, et al. 2015. Environmental fate and exposure; neonicotinoids and fipronil. Environ. Sci. Pollut. Res. 22:35–67.
11. Bru, D., F. Martin-Laurent, and L. Philippot. 2008. Quantification of the detrimental effect of a single primer-template mismatch by real-time PCR using the 16s rRNA gene as an example. Appl. Environ. Microbiol. 74:1660–1663.
12. Bustin, S.A., V. Benes, J.A. Garson, et al. 2009. The MIQE guidelines: Minimum information for publication of quantitative real-time PCR experiments. Clin. Chem. 55:611–622.
13. Carvalho, S.M., L.P. Belzunces, G.A. Carvalho, J.-L. Brunet, and A. Badiou-Beneteau. 2013. Enzymatic biomarkers as tools to assess environmental quality: A case study of exposure of the honeybee Apis
mellifera to insecticides. Environ. Toxicol. Chem. 32:2117–2124.
14. Casida, J.E., and K.A. Durkin. 2013. Neuroactive insecticides: targets, selectivity, resistance, and secondary effects. Annu. Rev. Entomol. 58:99–117.
15. Catae, A.F., T.C. Roat, M. Pratavieira, A.R. da Silva Menegasso, M.S. Palma, and O. Malaspina. 2018. Exposure to a sublethal concentration of imidacloprid and the side effects on target and nontarget organs of
Apis mellifera (Hymenoptera, Apidae). Ecotoxicology 27:109–121.
16. Chaimanee, V., P. Chantawannakul, Y. Chen, J.D. Evans, and J.S. Pettis. 2012. Differential expression of immune genes of adult honey bee (Apis mellifera) after inoculated by Nosema ceranae. J. Insect Physiol. 58:1090–1095.
17. Charreton, M., A. Decourtye, M. Henry, G. Rodet, J.-C. Sandoz, P. Charnet, and C. Collet. 2015. A locomotor deficit induced by sublethal doses of pyrethroid and neonicotinoid insecticides in the honeybee
Apis mellifera. PLoS One 10:e0144879.
18. Chauzat, M.-P., J.-P. Faucon, A.-C. Martel, J. Lachaize, N. Cougoule, and M. Aubert. 2006. A survey of pesticide residues in pollen loads collected by honey bees in France. J. Econ. Entomol. 99:253–262. 19. Chauzat, M.-P., A. Jacques, EPILOBEE Consortium, M. Laurent, S.
Bougeard, P. Hendrikx, and M. Ribière-Chabert. 2016. Risk indicators affecting honeybee colony survival in Europe: one year of surveillance. Apidologie 47:348–378.
20. Christen, V., F. Mittner, and K. Fent. 2016. Molecular effects of neonicotinoids in honey bees (Apis mellifera). Environ. Sci. Technol. 50:4071–4081.
21. Corby-Harris, V., P. Maes, and K.E. Anderson. 2014. The bacterial communities associated with honey bee (Apis mellifera) foragers. PLoS One 9:e95056.
22. Corby-Harris, V., L. Snyder, C.A. Meador, R. Naldo, B. Mott, and K.E. Anderson. 2016. Parasaccharibacter apium, gen. nov., sp. nov., improves honey bee (Hymenoptera: Apidae) resistance to Nosema. J. Econ. Entomol. 109:537–543.
23. Cox-Foster, D.L., S. Conlan, E.C. Holmes, et al. 2007. A metagenomic survey of microbes in honey bee colony collapse disorder. Science 318:283–287.
24. Daisley, B.A., M. Trinder, T.W. McDowell, S.L. Collins, M.W. Sumarah, and G. Reid. 2018. Microbiota-mediated modulation of organophosphate insecticide toxicity by species-dependent lactobacilli interactions in a Drosophila melanogaster insect model. Appl. Environ. Microbiol. 84:e02820-17.
25. Danner, N., A. Keller, S. Härtel, and I. Steffan-Dewenter. 2017. Honey bee foraging ecology: Season but not landscape diversity shapes the amount and diversity of collected pollen. PLoS One 12:e0183716. 26. Dussaubat, C., J.-L. Brunet, M. Higes, et al. 2012. Gut pathology and
responses to the microsporidium Nosema ceranae in the honey bee
Apis mellifera. PLoS One 7:e37017.
27. El Khoury, S., A. Rousseau, A. Lecoeur, B. Cheaib, S. Bouslama, P.-L. Mercier, V. Demey, M. Castex, P. Giovenazzo, and N. Derome. 2018. Deleterious interaction between honeybees (Apis mellifera) and its microsporidian intracellular parasite Nosema ceranae was mitigated by administrating either endogenous or allochthonous gut microbiota strains. Front. Ecol. Evol. 6:58.
28. Engel, P., R.R. James, R. Koga, W.K. Kwong, Q.S. McFrederick, and N.A. Moran. 2013. Standard methods for research on Apis mellifera gut symbionts. J. Apic. Res. 52:1–24.
29. Engel, P., and N.A. Moran. 2013. Functional and evolutionary insights into the simple yet specific gut microbiota of the honey bee from metagenomic analysis. Gut Microbes. 4:60–65.
30. Erban, T., O. Ledvinka, M. Kamler, B. Hortova, M. Nesvorna, J. Tyl, D. Titera, M. Markovic, and J. Hubert. 2017. Bacterial community associated with worker honeybees (Apis mellifera) affected by European foulbrood. PeerJ 5:e3816.
31. Garrido, P.M., M.P. Porrini, K. Antúnez, B. Branchiccela, G.M.A. Martínez-Noël, P. Zunino, G. Salerno, M.J. Eguaras, and E. Ieno. 2016. Sublethal effects of acaricides and Nosema ceranae infection on immune related gene expression in honeybees. Vet. Res. 47:51. 32. Godfray, H.C.J., T. Blacquiere, L.M. Field, R.S. Hails, G. Petrokofsky,
S.G. Potts, N.E. Raine, A.J. Vanbergen, and A.R. McLean. 2014. A restatement of the natural science evidence base concerning neonicotinoid insecticides and insect pollinators. Proc. R. Soc. B. 281:20140558.
33. Godfray, H.C.J., T. Blacquière, L.M. Field, R.S. Hails, S.G. Potts, N.E. Raine, A.J. Vanbergen, and A.R. McLean. 2015. A restatement of recent advances in the natural science evidence base concerning neonicotinoid insecticides and insect pollinators. Proc. R. Soc. B. 282:20151821.
34. Goulson, D., E. Nicholls, C. Botias, and E.L. Rotheray. 2015. Bee declines driven by combined stress from parasites, pesticides, and lack of flowers. Science 347:1255957–1255957.
35. Guo, J., J. Wu, Y. Chen, J.D. Evans, R. Dai, W. Luo, and J. Li. 2015. Characterization of gut bacteria at different developmental stages of Asian honey bees, Apis cerana. J. Invertebr. Pathol. 127:110–114. 36. Hamdi, C., A. Balloi, J. Essanaa, et al. 2011. Gut microbiome dysbiosis
and honeybee health. J. Appl. Entomol. 135:524–533.
37. Hammer, O., D.A.T. Harper, and P.D. Ryan. 2001. PAST: Paleontological Statistics software package for education and data analysis. Palaeontol. Electronica 4:9.
38. Hegedus, D., M. Erlandson, C. Gillott, and U. Toprak. 2009. New insights into peritrophic matrix synthesis, architecture, and function. Annu. Rev. Entomol. 54:285–302.
39. Higes, M., A. Meana, C. Bartolomé, C. Botías, and R. Martín-Hernández. 2013. Nosema ceranae (Microsporidia), a controversial 21st century honey bee pathogen: N. ceranae an emergent pathogen for beekeeping. Environ. Microbiol. Rep. 5:17–29.
40. Hroncova, Z., J. Havlik, J. Killer, et al. 2015. Variation in honey bee gut microbial diversity affected by ontogenetic stage, age and geo-graphic location. PLoS One 10:e0118707.
41. Hubert, J., M. Bicianova, O. Ledvinka, M. Kamler, P.J. Lester, M. Nesvorna, J. Kopecky, and T. Erban. 2017. Changes in the bacteriome of honey bees associated with the parasite Varroa destructor, and pathogens Nosema and Lotmaria passim. Microb. Ecol. 73:685–698. 42. Jones, J.C., C. Fruciano, F. Hildebrand, H.A. Toufalilia, N.J. Balfour,
P. Bork, P. Engel, F.L. Ratnieks, and W.O. Hughes. 2018. Gut micro-biota composition is associated with environmental landscape in honey bees. Ecol. Evol. 8:441–451.
43. Jones, J.C., C. Fruciano, J. Marchant, F. Hildebrand, S. Forslund, P. Bork, P. Engel, and W.O.H. Hughes. 2018. The gut microbiome is associated with behavioural task in honey bees. Insectes Soc. 65:419–429.
44. Kakumanu, M.L., A.M. Reeves, T.D. Anderson, R.R. Rodrigues, and M.A. Williams. 2016. Honey bee gut microbiome is altered by in-hive pesticide exposures. Front. Microbiol. 7:1255.
45. Kasiotis, K.M., C. Anagnostopoulos, P. Anastasiadou, and K. Machera. 2014. Pesticide residues in honeybees, honey and bee pollen by LC– MS/MS screening: Reported death incidents in honeybees. Sci. Total Environ. 485–486:633–642.
46. Klindworth, A., E. Pruesse, T. Schweer, J. Peplies, C. Quast, M. Horn, and F.O. Glöckner. 2013. Evaluation of general 16S ribosomal RNA gene PCR primers for classical and next-generation sequencing-based diversity studies. Nucleic Acids Res. 41:e1.
47. Kuraishi, T., O. Binggeli, O. Opota, N. Buchon, and B. Lemaitre. 2011. Genetic evidence for a protective role of the peritrophic matrix against intestinal bacterial infection in Drosophila melanogaster. Proc. Natl. Acad. Sci. U.S.A. 108:15966–15971.
48. Kurze, C., Y. Le Conte, P. Kryger, O. Lewkowski, T. Müller, and R.F.A. Moritz. 2018. Infection dynamics of Nosema ceranae in honey bee midgut and host cell apoptosis. J. Invertebr. Pathol. 154:1–4. 49. Kwong, W.K., and N.A. Moran. 2016. Gut microbial communities of
social bees. Nat. Rev. Microbiol. 14:374–384.
50. Kwong, W.K., A.L. Mancenido, and N.A. Moran. 2017. Immune system stimulation by the native gut microbiota of honey bees. R. Soc. Open Sci. 4:170003.
51. Lambert, O., M. Piroux, S. Puyo, C. Thorin, M. L’Hostis, L. Wiest, A. Buleté, F. Delbac, and H. Pouliquen. 2013. Widespread occurrence of chemical residues in beehive matrices from apiaries located in different landscapes of western France. PLoS One 8:e67007.
52. Lee, F.J., D.B. Rusch, F.J. Stewart, H.R. Mattila, and I.L.G. Newton. 2015. Saccharide breakdown and fermentation by the honey bee gut microbiome: Fermentation by honey bee gut microbes. Environ. Microbiol. 17:796–815.
53. Li, J., H. Qin, J. Wu, B.M. Sadd, X. Wang, J.D. Evans, W. Peng, and Y. Chen. 2012. The prevalence of parasites and pathogens in Asian honeybees Apis cerana in China. PLoS One 7:e47955.
54. Li, J.H., J.D. Evans, W.F. Li, Y.Z. Zhao, G. DeGrandi-Hoffman, S.K. Huang, Z.G. Li, M. Hamilton, and Y.P. Chen. 2017. New evidence showing that the destruction of gut bacteria by antibiotic treatment could increase the honey bee’s vulnerability to Nosema infection. PLoS One 12:e0187505.
55. Li, W., J.D. Evans, J. Li, S. Su, M. Hamilton, and Y. Chen. 2017. Spore load and immune response of honey bees naturally infected by
Nosema ceranae. Parasitol. Res. 116:3265–3274.
56. Lu, K., R. Mahbub, and J.G. Fox. 2015. Xenobiotics: Interaction with the intestinal microflora. ILAR J. 56:218–227.
57. Ludvigsen, J., A. Rangberg, E. Avershina, M. Sekelja, C. Kreibich, G. Amdam, and K. Rudi. 2015. Shifts in the midgut/pyloric microbiota composition within a honey bee apiary throughout a season. Microbes Environ. 30:235–244.
58. Maes, P.W., P.A.P. Rodrigues, R. Oliver, B.M. Mott, and K.E. Anderson. 2016. Diet-related gut bacterial dysbiosis correlates with impaired development, increased mortality and Nosema disease in the honeybee (Apis mellifera). Mol. Ecol. 25:5439–5450.
59. Martinson, V.G., B.N. Danforth, R.L. Minckley, O. Rueppell, S. Tingek, and N.A. Moran. 2011. A simple and distinctive microbiota associated with honey bees and bumble bees: the microbiota of honey bees and bumble bees. Mol. Ecol. 20:619–628.
60. Martinson, V.G., J. Moy, and N.A. Moran. 2012. Establishment of characteristic gut bacteria during development of the honeybee worker. Appl. Environ. Microbiol. 78:2830–2840.
61. Moran, N.A., A.K. Hansen, J.E. Powell, and Z.L. Sabree. 2012. Distinctive gut microbiota of honey bees assessed using deep sampling from individual worker bees. PLoS One 7:e36393.
62. Mullin, C.A., M. Frazier, J.L. Frazier, S. Ashcraft, R. Simonds, D. vanEngelsdorp, and J.S. Pettis. 2010. High levels of miticides and agrochemicals in North American apiaries: implications for honey bee health. PLoS One 5:e9754.
63. Oliveira, R.A., T.C. Roat, S.M. Carvalho, and O. Malaspina. 2014. Side-effects of thiamethoxam on the brain and midgut of the Africanized honeybee Apis mellifera (Hymenopptera: Apidae). Environ. Toxicol. 29:1122–1133.
64. Panek, J., L. Paris, D. Roriz, A. Mone, A. Dubuffet, F. Delbac, M. Diogon, and H. El Alaoui. 2018. Impact of the microsporidian
Nosema ceranae on the gut epithelium renewal of the honeybee, Apis mellifera. J. Invertebr. Pathol. https://doi.org/10.1016/j.jip.2018.09.007.
65. Paris, L., M. Roussel, B. Pereira, F. Delbac, and M. Diogon. 2017. Disruption of oxidative balance in the gut of the western honeybee
Apis mellifera exposed to the intracellular parasite Nosema ceranae
and to the insecticide fipronil. Microb. Biotechnol. 10:1702–1717. 66. Raymann, K., L.-M. Bobay, and N.A. Moran. 2018. Antibiotics
reduce genetic diversity of core species in the honeybee gut microbiome. Mol. Ecol. 27: 2057–2066.
67. Raymann, K., and N.A. Moran. 2018. The role of the gut microbiome in health and disease of adult honey bee workers. Curr. Opin. Chem. Biol. 26:97–104.
68. Raymann, K., E.V.S. Motta, C. Girard, I.M. Riddington, J.A. Dinser, and N.A. Moran. 2018. Imidacloprid decreases honey bee survival but does not affect the gut microbiome. Appl. Environ. Microbiol. 84:e00545-18.
69. Rhee, S.H., C. Pothoulakis, and E.A. Mayer. 2009. Principles and clinical implications of the brain–gut–enteric microbiota axis. Nat. Rev. Gastroenterol. Hepatol. 6:306–314.
70. Rinttilä, T., A. Kassinen, E. Malinen, L. Krogius, and A. Palva. 2004. Development of an extensive set of 16S rDNA-targeted primers for quantification of pathogenic and indigenous bacteria in faecal samples by real-time PCR. J. Appl. Microbiol. 97:1166–1177.
71. Ryu, J.-H., S.-H. Kim, H.-Y. Lee, J.Y. Bai, Y.-D. Nam, J.-W. Bae, D.G. Lee, S.C. Shin, E.-M. Ha, and W.-J. Lee. 2008. Innate immune homeostasis by the homeobox gene caudal and commensal-gut mutualism in Drosophila. Science 319:777–782.
72. Schwarz, R.S., N.A. Moran, and J.D. Evans. 2016. Early gut colonizers shape parasite susceptibility and microbiota composition in honey bee workers. Proc. Natl. Acad. Sci. U.S.A. 113:9345–9350.
73. Seeley, T.D. 1985. Honeybee Ecology: A Study of Adaptation in Social Life. Princeton University Press, Princeton, New Jersey. 74. Shi, W., Y. Guo, C. Xu, S. Tan, J. Miao, Y. Feng, H. Zhao, R.J. St.
Leger, and W. Fang. 2014. Unveiling the mechanism by which microsporidian parasites prevent locust swarm behavior. Proc. Natl. Acad. Sci. U.S.A. 111:1343–1348.
75. Staley, Z.R., V.J. Harwood, and J.R. Rohr. 2015. A synthesis of the effects of pesticides on microbial persistence in aquatic ecosystems. Crit. Rev. Toxicol. 45:813–836.
76. Suchail, S., G.D. Sousa, R. Rahmani, and L.P. Belzunces. 2004. In
vivo distribution and metabolisation of 14C-imidacloprid in different
compartments of Apis mellifera L. Pest Manage. Sci. 60:1056–1062. 77. Suzuki, M.T., L.T. Taylor, and E.F. Delong. 2000. Quantitative analysis
of small-subunit rRNA genes in mixed microbial populations via 5ʹ-nuclease assays. Appl. Environ. Microbiol. 66:4605–4614. 78. Tan, S., K. Zhang, H. Chen, Y. Ge, R. Ji, and W. Shi. 2015. The
mechanism for microsporidian parasite suppression of the hindgut bacteria of the migratory locust Locusta migratoria manilensis. Sci. Rep. 5:17365.
79. vanEngelsdorp, D., and M.D. Meixner. 2010. A historical review of managed honey bee populations in Europe and the United States and the factors that may affect them. J. Invertebr. Pathol. 103:S80–S95. 80. Vásquez, A., E. Forsgren, I. Fries, R.J. Paxton, E. Flaberg, L. Szekely,
and T.C. Olofsson. 2012. Symbionts as major modulators of insect health: lactic acid bacteria and honeybees. PLoS One 7:e33188. 81. Vidau, C., M. Diogon, J. Aufauvre, et al. 2011. Exposure to sublethal
doses of fipronil and thiacloprid highly increases mortality of honeybees previously infected by Nosema ceranae. PLoS One 6:e21550. 82. Vidau, C., J. Panek, C. Texier, D.G. Biron, L.P. Belzunces, M. Le
Gall, C. Broussard, F. Delbac, and H. El Alaoui. 2014. Differential proteomic analysis of midguts from Nosema ceranae-infected honeybees reveals manipulation of key host functions. J. Invertebr. Pathol. 121:89–96.
83. Vojvodic, S., S.M. Rehan, and K.E. Anderson. 2013. Microbial gut diversity of Africanized and European honey bee larval instars. PLoS One 8:e72106.
84. Xia, X., B. Sun, G.M. Gurr, L. Vasseur, M. Xue, and M. You. 2018. Gut microbiota mediate insecticide resistance in the Diamondback Moth, Plutella xylostella (L.). Front. Microbiol. 9:25.
85. Xu, L.-L., J. Wu, J. Guo, and J.-L. Li. 2014. Dynamic variation of symbionts in bumblebees during hosts growth and development. Sci. Agric. Sin. 47:2030–2037.
86. Yu, Y., C. Lee, J. Kim, and S. Hwang. 2005. Group-specific primer and probe sets to detect methanogenic communities using quantitative real-time polymerase chain reaction. Biotechnol. Bioeng. 89:670–679.