HAL Id: hal-02120302
https://hal.archives-ouvertes.fr/hal-02120302
Submitted on 5 May 2019HAL is a multi-disciplinary open access archive for the deposit and dissemination of sci-entific research documents, whether they are pub-lished or not. The documents may come from teaching and research institutions in France or abroad, or from public or private research centers.
L’archive ouverte pluridisciplinaire HAL, est destinée au dépôt et à la diffusion de documents scientifiques de niveau recherche, publiés ou non, émanant des établissements d’enseignement et de recherche français ou étrangers, des laboratoires publics ou privés.
Astronomically-paced coccolith size variations during
the early Pliensbachian (Early Jurassic)
Baptiste Suchéras-Marx, Emanuela Mattioli, Bernard Pittet, Gilles Escarguel,
Guillaume Suan
To cite this version:
Baptiste Suchéras-Marx, Emanuela Mattioli, Bernard Pittet, Gilles Escarguel, Guillaume Suan. Astronomically-paced coccolith size variations during the early Pliensbachian (Early Juras-sic). Palaeogeography, Palaeoclimatology, Palaeoecology, Elsevier, 2010, 295 (1-2), pp.281-292. �10.1016/j.palaeo.2010.06.006�. �hal-02120302�
Astronomically-paced coccolith size variations
during the early Pliensbachian (Early Jurassic)
Baptiste Suchéras-Marx, Emanuela Mattioli, Bernard Pittet, Gilles Escarguel, Guillaume Suan
UMR 5125 PEPS, CNRS, France; Université Lyon 1, Campus de la DOUA, Bâtiment Géode, 69622 Villeurbanne Cedex, France
Keywords:
Micro-algae size, Calcareous nannofossils, Orbital cycles, Photic zone habitats, Palaeoenvironmental changes, Early Jurassic.
Abstract
Though climate and environmental changes are known to influence diversity and assemblages of coccolithophorids, unicellular photoautotroph algae, the relationships between the size luctuations of coccoliths, the small calcite plates covering the coccolithophorid cell, and environmental parameters remain unclear. To understand possible interactions between coccolith size and environmental changes, a high-resolution (every 5 cm)biometric study of Crepidolithus crassus coccoliths was performed in the Lower Pliensbachian (Lower Jurassic; ∼188 Myr) hemipelagic deposits of Peniche (Portugal). The six measured parameters show covariant patterns related to size variations rather than morphological changes. The size variations are cyclic, and they occur in opposite phase to changes in the sedimentary calciumcarbonate content. Spectral analyses performed on the size measurements of the C. crassus coccoliths and the calcium carbonate contents showthat changes in both parameters are paced by the Earth's eccentricity and precession orbital cycles. As revealed by mixture analyses, the observed size variations result from changes in the relative abundance of two distinct biometric groups that are statistically stable through the analysed time interval. These two groups are classified as: “small crassus”with a major axis mean size of 6.5± 0.75 μm, and “large crassus”, which averages at 8.5±0.75 μm and dominates the assemblages in the studied interval. Crepidolithus crassus has been recently interpreted as a deep-dweller (living in the lower photic zone) and its development may have been greatly dependent on light availability and nutrient concentration. Accordingly, the two size groups likely developed at different water-depths due to differential coccolith (and cell) masses and buoyancies. Consequently, we propose that changes in the transparency of the water column may have been an important factor controlling the replacement between the two groups and hence the resulting coccolith mean size fluctuations. Ultimately, both water transparency and nutrient recycling within the photic zone were mainly influenced by the frequency and intensity of storms that occurred under orbital control.
1. Introduction
Coccolithophores are one of the major planktonic micro-algae in modern oceans. Coccolithophores produce intra-cellular carbonate platelets named coccoliths that are exported to the cell surface to form the coccosphere. Because they act simultaneously as organic and inorganic carbon pumps, coccolithophores are largely studied for their possible influence on the carbon cycle (e.g., Rost and Riebesell, 2004; Langer et al., 2006; Rickaby et al., 2007; Iglesias-Rodriguez et al., 2008). Since the first appearance of coccolithophorids during the late Triassic, climate changes are known to have had a major influence on coccolith production and distribution in the past oceans (e.g., McIntyre, 1967; McIntyre et al.,
1970; Molfino andMcIntyre, 1990; Westbroek et al., 1993; Erba, 2006). These patterns indicate the close relationship between climate and biosphere, and they are of major interest in palaeontology and palaeoceanography.
Over sub-million-year timescales, climate changes are modulated by orbital cycles (Milankovitch, 1941; Berger, 1978), which control the solar radiance received by the Earth. In turn, orbitally-forced changes in climate, weathering, continental runoff, oceanic circulation and productivity control the amount of carbonate or clay inputs that are exported to deep-sea regions and are ultimately preserved in sedimentary successions (Einsele, 1982; Einsele and Ricken, 1991). Hence, cyclic patterns of sedimentation are increasingly used to reconstruct ocean/atmosphere climate dynamics on short- and long-term timescales for periods covering the Paleozoic to the Neogene (Weedon and Jenkyns, 1990; Claps et al., 1995; Elrick andHinnov, 1996;Hinnov and Park, 1999; Hilgen et al., 2003; Weedon, 2003; Suan et al., 2008b). Despite the major role of orbital cycles on sub-million-year climate changes, their influence on the development and assemblages of coccolithophores remain relatively poorly-documented and understood.
Orbitally-paced cyclic patterns have been identified in fluctuations of the abundance of the modern species Florisphaera profunda (Beaufort et al., 1997), or in the relative abundance of Cretaceous species (Erba et al., 1992; Mutterlose and Ruffel, 1999; Herrle et al., 2003; Bornemann et al., 2005) and Jurassic taxa (Claps et al., 1995; Mattioli, 1997;Walsworth-Bell et al., 2000; Olivier et al., 2004). These studies suggested an intimate coupling between the abundance of a given taxon and orbitally-forced fertility changes of the sea-surface waters where the organism developed. Recent biometric studies have shown the predominant role of climatic variations on Paleogene and Neogene coccolith and nannolith sizes (Parente et al., 2004; Narciso et al., 2006; Henderiks and Pagani, 2008; Tremolada et al., 2008). Furthermore, estimates of coccolith size variations are of fundamental importance to assessing pelagic carbonate fluxes and, hence, for our understanding of global biogeochemical cycles on the submillion-year timescale (Young and Ziveri, 2000; Baumann, 2004). Nevertheless, biometric studies that unambiguously relate coccolith size to orbital cycles are still rare, and previous attempts to establish any relationship between size variations and a given cycle have been inconclusive (e.g., Bralower and Parrow, 1996; Colmenero-Hidalgo et al., 2002; Bornemann and Mutterlose, 2006).
In this study, we analysed the size variations of the early Jurassic coccolith Crepidolithus
crassus (Deflandre, 1954) Noël, 1965 to investigate the possible influence of orbitally-related
climatic cycles on coccolith size variations through time. This species is represented by robust, dissolution-resistant coccoliths and is one of the most abundant taxa in lower Jurassic assemblages. We investigated the Pliensbachian sedimentary succession from the Peniche section (Lusitanian Basin, Portugal), where marlstone–limestone alternations crop out spectacularly and continuously along the Atlantic coast. Coccoliths were measured at high-resolution (every 5 cm) over a relatively short time interval (∼200000 years).
2. Materials and methods
2.1. The Peniche section
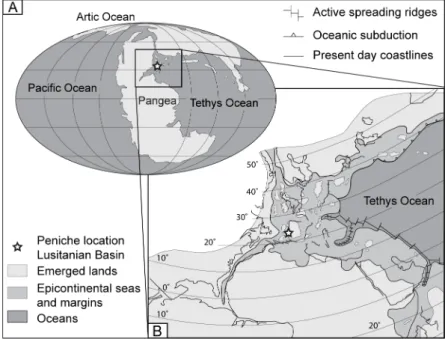
The Peniche section (Middle-West coast of Portugal; Fig. 1) is one of the most complete and continuous sedimentary successions of the western Tethys for the Pliensbachian/Toarcian interval (∼190–180 My ago). Several ammonite bio-events provide a detailed biostratigraphic framework (Mouterde, 1955; Elmi et al., 1988), making this section a good candidate for the Pliensbachian/Toarcian Global Stratotype Section and Point (GSSP) (Duarte et al., 2004; Elmi, 2006). Peniche belongs to the Jurassic Lusitanian Basin (Fig. 1A and B), which is limited eastwards by the Iberian Meseta and westwards by the Berlenga–Farilhões Horst (Wright and Wilson, 1984). The Pliensbachian part of the Peniche section (Fig. 2) is represented by marlstone–limestone alternations rich in belemnites and ammonites. The
presence of levels enriched in microbialitic nodules is a remarkable sedimentary feature (Elmi et al., 1988).
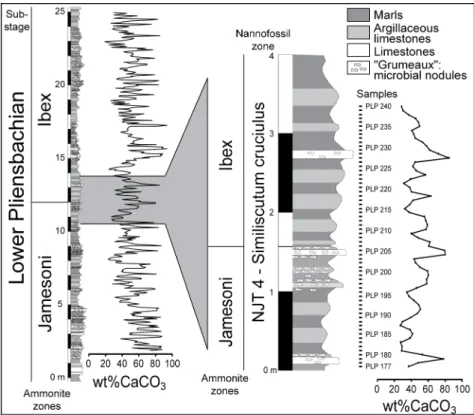
Across the Jamesoni and Ibex ammonite zones, 23 mof the Peniche section have been sampled at high resolution every 5 cm (455 samples). In this interval, the variations of calcium carbonate content were measured (Fig. 2), and the obtained data were subjected to spectral analysis to evaluate the impact of orbital cycles on carbonate sedimentation during the Early Pliensbachian. A shorter interval (3.2 m) was then selected for high-resolution biometric analyses of C. crassus coccoliths. This part of the section, which encompasses the Jamesoni–Ibex ammonite zones boundary, has been selected because the marlstone– argillaceous limestone alternations there are remarkably regular. Moreover, microbialitic nodules are relatively rare in this interval (Elmi et al., 1988).
Fig. 1. A: Palaeogeography during the Early Jurassic (Scotese, 2001). B: Zoom showing the location of Peniche within the Lusitanian Basin during the Early Jurassic (modified from Bassoulet et al., 1993). 2.2. Sample preparation
Calcium carbonate (CaCO3) contents were determined using a Dietrich-Frühling calcimeter.
For each sample, the amount of CO2 was measured after the acidification of an aliquot of
about 300 mg of powdered bulk sediment (Fig. 2). The biometric study of coccoliths has been performed on samples from the same stratigraphic level analysed for wt.%CaCO3
contents.
The preparation of slides for coccolith observation was performed using the Random Settling method (Beaufort, 1991; modified in Geisen et al., 1999). This method consists of the decantation of a homogenised suspension of ∼20 mg of powdered rocks in 475 ml of water in a settling device. The suspension was allowed to elutriate for 24 h on a cover microscope slide. The cover slide was then dried and attached with Rhodopass B to a microscope slide. The method allows a homogenous distribution of powdered rock (and of coccoliths) on the slide.
2.3. Biometric study of Crepidolithus crassus
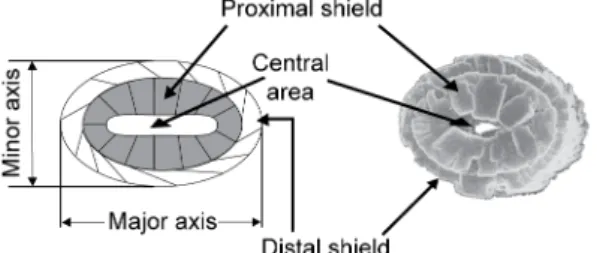
Biometrics were performed on one species of coccolith, namely Crepidolithus crassus. This species of the murolith group (Bown, 1987) consists of a large, thick, elliptical rim composed
of thick distal and smaller proximal cycle. The central area is vacant and is often reduced to a lenticular slit (Fig. 3). Measurements were made using a Zeiss Axioskop40 optical microscope with a magnification 1000×. Thirty specimens of C. crassus per sample were snapped with a Moticam 2000 camera and the biometric measurements were made with Motic Images Plus 2.0 (graphic precision of 1 pixel 0.0833 μm long and 0.0847μm wide). Measurements were performed for proximal and distal cycles and for the central area, along the axis of maximum length (major axis), and orthogonally (minor axis), resulting in six values for each coccolith (Fig. 3). For each of the 64 studied samples, 30 specimens of C. crassus were measured (except for sample PLP 227 where only 20 C. crassus could be measured) for a total of 11,460 measurements. An error of measurement was estimated to be ±0.17 μm (i.e.,±2 pixels) by repetitive (10 times) measurements of 10 coccoliths.
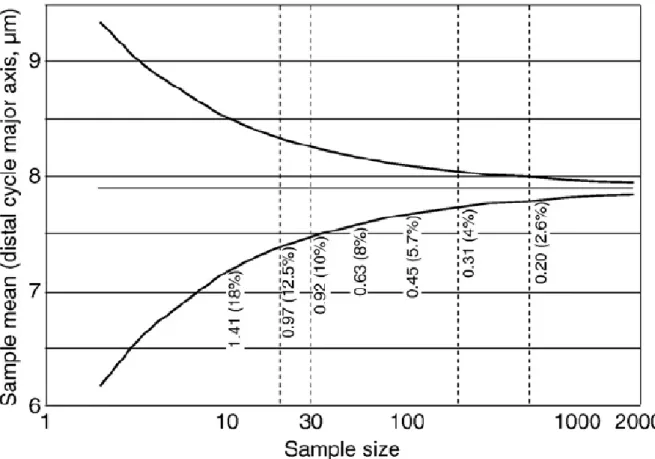
Since the publication of pioneering biometrical works (e.g., Simpson et al., 1960), there has been a long biostatistical tradition that ∼30 specimens randomly sorted from a given, biologically homogeneous population is a sufficient sample size for estimating statistically unbiased and numerically stabilised parametric descriptors of arithmetic or geometric means, including variability (e.g., variance and standard-deviation). This choice of 30 specimens is now largely consensual. This consensual and efficient sample size is corroborated by Monte-Carlo simulations (Fig. 4). These simulations are based on the generation of increasing size samples by random sorting with replacement (nonparametric bootstrap) within the entire measurement pool (64 samples, 1910 specimens). This method allows us to test the impact of the sample size on the obtained average values (i.e., the major axis length). The underlying hypothesis is that a single homogeneous population occurred. The results of the simulation show that with 30 specimens per sample the maximal error (upper value of the simulated 95% confidence interval) is 10% of the average value of the total measurements for the major axis (distal cycle), or 0.82 μm. With an increasing sample size (e.g., 50, 100,…500 measurements), this error percentage of the average value decreases very little (Fig. 4).
Fig. 2. Stratigraphic column of the Lower Pliensbachian part of the Peniche section with high-resolution calcium carbonate values. The part of the section that was selected for the biometric study on coccoliths is enlarged.
2.4. Spectral analysis
Two methods of spectral analysis were used to identify possible cyclicities in the variation of wt.%CaCO3 and coccolith size: the Fourier analysis and the Maximum Entropy method. The
Fourier analysis is a commonly-applied method in cyclostratigraphy, especially for the time interval considered in this work (Weedon and Jenkyns, 1990; Claps et al., 1995; Weedon and Jenkyns, 1999). The Fourier analysis is based on the identification of the different sinusoidal curves that compose the sampled signal. The confidence levels for each estimated frequency were calculated using the test of Mann and Lees (1996). The Maximum Entropy method is known to be the most accurate spectral analysis technique for short-time series (Ulrych and Bishop, 1975; Pardo-Igúzquiza and Rodríguez-Tovar, 2006). This method is based on the comparison between a spectral density from a randomly dataset. With this method, confidence levels were calculated following Pardo-Igúzquiza and Rodríguez-Tovar (2005). We applied the two methods to the percentage of calcium carbonate and the size variations of C. crassus. All analyses were performed using the Strati- Signal free software (Ndiaye, 2007).
Fig. 3. On the left, sketch illustrating the structure of Crepidolithus crassus. This coccolith–murolith is composed of 2 cycles (proximal and distal) formed of little platelets of calcite. A reduced, elliptical central area is present that can be filled by calcite debris. The two axes of measurements (the major and the minor axis) are indicated. On the right, a microphotograph of C. crassus in Scanning Electron Microscopy (Bown, 1987). In both images, the coccolith is in proximal view.
2.5. Mixture analysis
Mixture analysis is a maximum-likelihood method for identifying the existence of two or more distinct distributions in an initially pooled sample and estimating their descriptive parameters (Redner and Walker, 1984; Titterington et al., 1985; Harper, 1999). In this study, we used the Gaussian Mixture analysis algorithm implemented in PAST software (v. 1.81; Hammer et al., 2001). Among the six studied variables, we selected the major axis of the distal cycle as it shows the largest absolute variations simultaneously with the analysed time series (Fig. 5) and the smallest relative values of the measurement error (2–3%). Based on this parameter, we estimated the distribution parameters (mean, standard deviation and sample proportion) related to one or two distinct groups of C. crassus by analysing first the entire dataset, then each sampled assemblage separately. A one- and two-group model comparison was achieved by contrasting their associated Akaike Information Criterion (AIC, Akaike, 1973, 1983). The statistical procedure developed by Favre et al., (2008) allowed the optimised separation of two sets of normally distributed values. This method is based on two a priori defined sets of values, namely A (with the smallest mean) and B (with the largest mean), obtained for a given, normally distributed variable X. The Favre et al., (2008) method allows the identification of the critical value ζ, for which the product of the conditional probabilities of correctly assigning an individual value x to set A, given that x≤z, or to set B, given that x≥z, is maximal. Stated differently, ζ is the critical value for the sets of values A and B, for which the joint-prediction error-risk of incorrectly attributing any single value x to A or B is minimal. Finally, we compared the mixture analysis results along the analysed time series to determine whether stratigraphic fluctuations of a given variable are the consequence of size variations of the entire assemblage, or, in contrast, if they reflect changes in the relative
abundance of two or more groups with distinct, but statistically stable, distributions through time (e.g., Popescu et al., 2009).
Fig. 4.Monte-Carlo simulation based on the generation of increasing size samples by random sorting with nonparametric bootstrap within the entire measurement pool (64 samples, 1910 specimens). Measurements of 30 specimens (major axis) per sample give a maximal error of 10% (95% confidence interval).With an increasing sample size (e.g., 50, 100,…500 measurements), this error percentage of the average value very little decreases.
3. Results
3.1. Calcium carbonate contents
The calcium carbonate contents of the studied samples range between 24% and 85%, and they show a remarkably regular cyclicity throughout the entire studied interval (Figs. 2 and 4). The preliminary data indicate that the absolute abundance of calcareous nannofossils per gram of rock (on average=171×106±1 SD) is relatively low with respect to basal Toarcian
samples of the same section (on average=340×106±1 SD) (Mattioli, in progress). Moreover,
the absolute abundance of calcareous nannofossils is higher in marlstones (on average=185×106±1 SD) than in argillaceous limestones (on average=125×106±1 SD).
3.2. Size variations
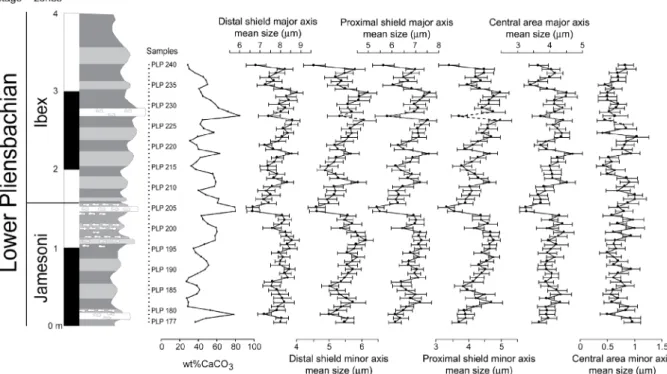
Excepting the minor axis of the central area, which shows rather constant values along the studied stratigraphic interval, the evolution of the different measured parameters through time appear broadly similar and parallel to each other (Fig. 5). The different pattern of the minor axis of the central area is most likely due to the error of the measurements (estimated to be±0.17 μm) being comparable to the observed range of mean variation for this variable
(∼0.50 μm). Moreover, the central area dimensions of C. crassus are often difficult to estimate, especially when central area is filled with fine calcite particles.
A comparison of the general pattern of size variations with the percentage of calcium carbonate shows that these two parameters have opposite trends at least for the lower part (from PLP 177 to PLP 210) and the upper part (from PLP 224 to PLP 240) of the studied interval (Fig. 5; Correlation coefficient of Pearson r=−0.51; p (H0: r=0)=10−4). This anti-phase relationship appears less clearly in the middle part of the studied interval (from PLP 211 to PLP 223) where, in contrast, both parameters appear to fluctuate in phase (Fig. 5; Correlation coefficient of Spearman ρ=0.5989; p (H0: ρ=0)=0.0305). With the exception of this interval, the high calcium carbonate contents correspond to small sized coccoliths of C.
crassus, whereas the larger coccoliths are generally recorded in marlstones.
Fig. 5. Interval where biometric analyses were performed. Calcium carbonate content is compared to the variations in size of C. crassus. Average values of major and minor axes of distal and proximal cycles and of the central area are shown. Error bars correspond to standard deviation. In the sample with the dashed line, only 20 specimens were measured instead of 30 as for the other samples. 3.3. Implications for the Lower Jurassic timescale
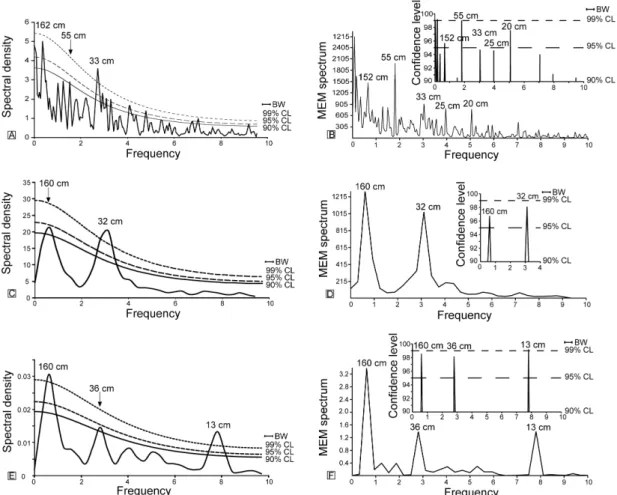
Together, the two applied methods of spectral analysis of the whole CaCO3 dataset indicate
that three main sedimentary cycles (162 cm–152 cm, 55 cm and 33 cm) are statistically significant. Based on the duration of the Pliensbachian (6.6 Ma; Gradstein et al., 2004), and assuming that the sedimentation rates remained relatively constant during the Pliensbachian (for a total accumulation of a ∼100 m-thick succession), the ∼157 cm, 55 cm and 33 cm sedimentary cycles correspond to durations of 104 ky, 36 ky, and 22 ky, respectively.
Using the duration of the Early Pliensbachian (2.6Ma; Gradstein et al., 2004), the ∼157 cm, 55 cm and 33 cm sedimentary cycles correspond to durations of 79 ky, 28 ky and 17 ky, respectively. In this case, the error associated with the assumption of a regular sedimentation rate could be considered reduced because a shorter time interval (the Early Pliensbachian) is considered. However, the duration of this substage is only based on the hypothesis of an equal duration of ammonite subzones (Gradstein et al., 2004), an
assumption that is highly unlikely to be correct. These latter estimated durations should therefore be considered with caution.
Considering the calculated durations of the different cycles obtained from the two spectral analysis methods of the whole CaCO3 dataset and the hierarchy existing between them
(4.7:1.6:1), we attribute the ∼157 cm, 55 cm and 33 cm cycles to the effects of the short eccentricity of the Earth's orbit, obliquity and precession, respectively.
To refine the astronomical timescale for the interval chosen for biometrics, the Fourier and Maximum entropy analyses were also applied to the percentage of calcium carbonate content in the interval from 10.5 m to 14.5 m (Figs. 2 and 6C, D). In both analyses, 2 cycles of 160 cm and 32 cm were identified with a >90% confidence level. According to the wavelength of the significant cyclicities evidenced from the spectral analysis applied to the whole CaCO3 dataset, we attribute these cycles of 160 cm and 32 cm to the short eccentricity and precession of the Earth, respectively.
Fig. 6. Fourier (A) and Maximum entropy (B) analyses of calcium carbonate content measured on 455 samples regularly spaced. Fourier (C) and Maximum entropy (D) analyses of calcium carbonate content measured on the interval studied for biometry analysis (64 samples). Fourier (E) and Maximum entropy (F) analysis of biometric results on measurements of major axis (distal cycle). The confidence levels of Fourier analyses were calculated using the Mann and Lees (1996) test. The confidence levels of Maximum entropy analyses were calculated using a permutation test (Pardo-Igúzquiza and Rodríguez-Tovar, 2005).
3.4. Spectral analyses of Crepidolithus crassus size variations
The Maximum entropy and Fourier analyses applied to the distal cycle major axis of the C.
confidence level (Fig. 6E, F). Cycles close to the Nyquist number (1/2×the sampling step) often occur in spectral analysis but they are artefacts inherent to the method (Weedon, 2003). Therefore, only cycles defined by more than five samples can be considered significant. Such is not the case for a 13 cm cycle defined by 2.5 samples. It is noteworthy that the wavelengths of the significant cyclicities in the C. crassus distal cycle — major axis data are almost identical to those recorded in the calcium carbonate data from the same interval (Fig. 6C, D).
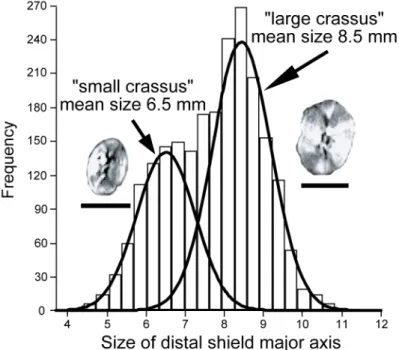
Fig. 7. Histogram describing the frequency of specimens in the different class sizes of the distal cycle major axis (one class=0.33 μm). Two Gaussian distributions have been modelled by mixture analysis. Thus, two size groups are proposed for C. crassus: the “large crassus” and the “small crassus” (scale bar=5 μm).
3.5. Mixture analysis
A mixture analysis of the whole data set (all samples pooled together) reveals two different-sized groups (Fig. 7). Following the nomenclature used for Calcidiscus leptoporus (Knappertsbusch et al., 1997), the first group will be hereafter designated as “small crassus”. The major axis of the “small crassus” distal cycle has a mean size of 6.5±0.75 μm; this group includes ∼37% of the sampled specimens. The major axis of the distal cycle of the second group, hereafter termed “large crassus”, has a mean size of 8.5±0.75 μm; it includes ∼63% of the sampled specimens. Using the statistical procedure developed by Favre et al., (2008), we estimate a between-group cut-off value of ζ=7.5 μm with associated model distribution probabilities Proba(x∈“small crassus” x ≤ ζ)=Proba (x∈“large crassus” x≥ζ)=90.9% — due to the equality of the standard deviations associated with the two groups. Nevertheless, it is worth stressing that this major axis cut-off value of 7.5 μm between the “small crassus” and “large crassus” groups is by no means a clear-cut boundary that can be used, for example, for taxonomical purposes; it is rather a fuzzy limit between these groups.
The mixture analysis was further applied to each sample separately and the resulting solutions were compared to the two biometrical groups obtained from the whole dataset (Fig. 8). In all cases where the mixture analysis provided a two-group solution instead of a single group solution (based on their associated AIC-values), the mean size of the two groups was statistically identical to that of the two groups identified in the whole dataset. In most samples, the “large crassus” group is themost abundant, whereas only a few levels are
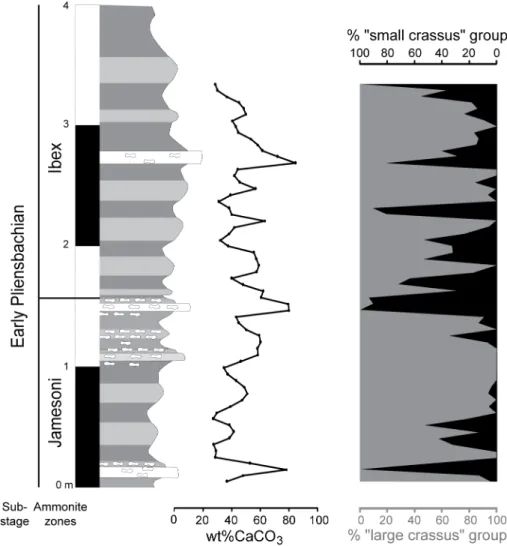
dominated by the “small crassus”. The variation in relative abundance of the two groups appears fairly regular. A negative correlation is observed between the percentage of calcium carbonate and the relative abundance of the “large crassus” coccoliths at least for the lower (PLP 177 to PLP 210) and upper parts of the studied interval (PLP 224 to PLP 240) (Fig. 8; Correlation coefficient of Pearson r=−0.50; p (H0: r=0)=2×10⁻⁴), which represent the majority of the samples. This negative correlation stays significant even when removing the 7 samples from the dataset that correspond to the three carbonate-rich beds (Pearson r=−0.47; p (H0: r=0)=1.4×10⁻³). However, no correlation is observed between the percentage of the “large crassus” and the %CaCO3 between samples PLP 211 to PLP 223 (Fig. 8; Correlation coefficient of Spearman ρ=0.33; p (H0: ρ=0)=0.2643).
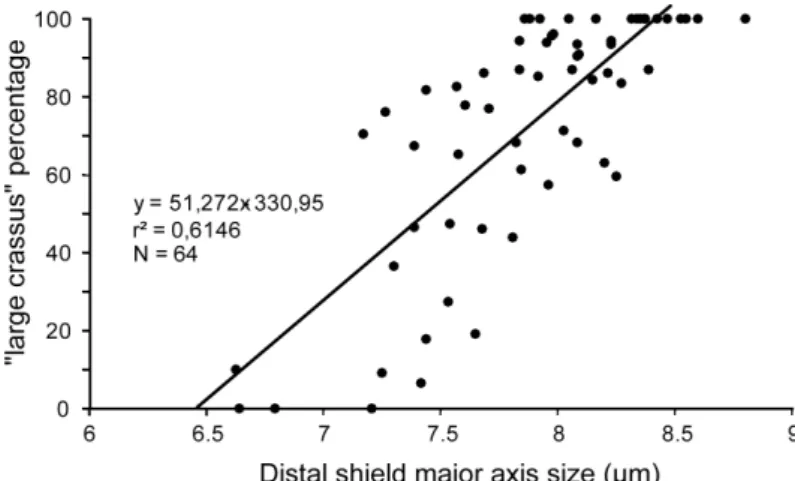
The scatter diagram of the mean distal cycle major axis vs. the relative abundance of the “large crassus” coccolith group illustrates a moderately linear correlation (Pearson r=0.615; Fig. 9). This correlation indicates that ∼61.5% of the observed mean size variations are explained by fluctuations in the relative abundance of the “small” and “large crassus” groups. The remaining (unexplained) part of the size variation is probably due to intra-group size variations, but it cannot be discussed here due to the limited number of specimens (30) measured in each sample.
Fig. 8. Comparison between variations in the calcium carbonate content of the samples and the changes in the percentage of the two groups (“large crassus” in grey and “small crassus” in black). The “large crassus” group is more abundant in marlstones and “small crassus” group is more abundant in argillaceous limestones.
4. Discussion
4.1. Diagenesis and coccolith size
The spectral analyses applied to the coccolith measurements indicate that the variations in the distal cycle major axis record a clear cyclical pattern. The periodicity of this pattern is in the same range as that identified for changes in the calcium carbonate contents (Fig. 6). Based on the cyclostratigraphic timescale developed from the spectral analysis of the wt.%CaCO3 contents, the size variations of C. crassus appear to have been paced by both
precession and short eccentricity. However, eccentricity-related cycles in the coccolith size dataset should be considered with caution because our time series only spans two eccentricity cycles, and it is commonly considered that at least 6 cycles should be analysed to confidently identify the characteristic wavelength of any particular cycle (Weedon, 2003). In contrast, we have good confidence in the precession record because 10 cycles were recorded in the coccolith dataset.
Even if diagenesis is cited as a possible cause for the origin of marlstone/limestone couplets and their cyclicities (e.g., Einsele and Ricken, 1991), most authors disagree with this hypothesis (e.g., Claps et al., 1995; Weedon and Jenkyns, 1999; Hilgen et al., 2003; Weedon, 2003).Despite the overall good preservation of coccoliths in the Peniche samples, some overgrown specimens of C. crassus have been observed in some samples. Coccoliths showing distinctive signs of overgrowth or dissolution were not measured in our biometric study. Observations show that overgrowth mainly affects the distal, outer cycle of the coccoliths, which can therefore be enlarged. An excellent parallel is observed between the different measured parameters of C. crassus (Fig. 5), indicating that the distal (outer) cycle of
C. crassus was relatively unaffected by diagenesis. Moreover, according to the diagenetic
model (e.g., Einsele and Ricken, 1991), a more intense dissolution would be expected in marlstones than in argillaceous limestones, where larger and more overgrown coccoliths of
C. crassus should be recorded accordingly. Conversely, our biometric study indicates that
larger coccoliths (not overgrown or dissolved) are recorded in marlstones throughout the studied interval, suggesting that neither dissolution nor overgrowth can explain the observed size variations of C. crassus.
All of these observations suggest that diagenesis is not the main cause of the observed biometrical trends, and they indicate that our record of C. crassus size variations reflects primary palaeobiological/environmental trends. We thus interpret our results as providing strong evidence that the C. crassus size variations and carbonate contents were both controlled by orbitally-forced changes in environmental parameters during the studied interval (Fig. 6).
Fig. 9. Regression plot between the size of the distal cycle major axis of C. crassus and the percentage of “large crassus” group.
4.2. Size changes of one species or variations in the abundance of differently-sized groups?
The results of the mixture analysis appear to be useful in interpretations of algal size variations because the distal cycle major axis taken into consideration is generally believed to be of fundamental importance to the morphogenesis of coccoliths. Indeed, coccoliths are produced inside the cell (Westbroek et al., 1984) and, according to Henderiks (2008), a linear isometric relation exists between coccoliths and cell sizes. Hence, coccolith lengths offer most of the morphogenetic information because the size of a coccolith is limited by the cell dimension. Consequently, we can confidently interpret variations of the mean size of the distal cycle major axis as reflecting primary changes in the dimension of the entire cell of a coccolithophore.
The mixture analysis clearly indicates the existence of two size groups in the analysed dataset (Fig. 7). The relative abundance of these two groups shows cyclic variations through time (Fig. 8). When comparing the stratigraphic evolution of the coccolith mean size with the percentage of the two groups (Fig. 8), most of the size variations appear to be explained by changes in the relative proportions of the “small crassus” and the “large crassus”. This record strongly suggests that the cyclic pattern of the size of C. crassus actually reflects orbitally-forced changes in the relative dominance of “large crassus” to “small crassus”.
The biodiversity of present-day oceans is largely underestimated (de Vargas et al., 2007). Recent species identifications based on genetics indicate that the existence of numerous cryptic species within coccolithophorids are undistinguishable solely on the basis of coccolith or coccosphere morphology (Sáez and Lozano, 2005). Cryptic species appear to be common in plankton communities, both with coccolithophorids and planktic foraminifers (Geisen et al., 2002; Sáez and Lozano, 2005; de Vargas et al., 2007). Sometimes these cryptic species can be differentiated on the basis of their size or on fine morphological differences, and they are therefore named pseudo-cryptic (Geisen et al., 2002; Sáez and Lozano, 2005; Morard et al., 2009). Pseudo-cryptic species quite often have different ecological preferences and live in various oceanographic settings (de Vargas et al., 2002). Even if we cannot infer at this stage that the “small” and “large crassus” groups were pseudo-cryptic species, our results can be compared to data obtained for Calcidiscus leptoporus. Calcidiscus leptoporus is a complex of three pseudo-cryptic species distinguishable on the basis of coccolith and coccosphere size and fine morphological characteristics (Knappertsbusch et al., 1997; Sáez and Lozano, 2005). Interestingly, these pseudo-cryptic species have different ecological preferences (Renaud and Klaas, 2001). As the “small crassus” generally appears to be more abundant in carbonates and the “large crassus” is more abundant in marlstones, we can reasonably assume that the two groups had different ecological preferences. Accordingly, the clear cyclicity of their relative abundance through time should have been logically driven by orbitally-forced changes in environmental conditions.
4.3. Environmental conditions controlling variations in the abundance of the two groups of
C. crassus
Water temperature, salinity, and nutrient concentration are known to control the assemblage composition of coccolithophores and coccolith size (e.g., Westbroek et al., 1989; Bollmann, 1997; Green et al., 1998; Bollmann and Herrle, 2007; Zondervan, 2007; Bollmann et al., 2009). Numerous studies have related changes in Mesozoic and Cenozoic coccolithophore communities to changes in nutrients fluxes (Beaufort and Aubry, 1990; Erba et al., 1992; Beaufort, 1994; Walsworth-Bell et al., 2000; Pittet and Mattioli, 2002). The distribution and size of coccolithophorid can also be controlled by temperature changes related to latitudinal belts and thermo-haline circulation, as shown for C. leptoporus and Gephyrocapsa spp. (Bollmann, 1997; Knappertsbusch et al., 1997). In addition, salinity strongly influences the morphology of the modern species Emiliania huxleyi (Bollmann and Herrle, 2007; Bollmann et al., 2009). Salinity, through sea-water stratification, may also have exerted a strong
influence on ancient coccolithophore assemblages (Mattioli et al., 2008). Several studies of modern species cultures have suggested that pCO2, through ocean acidification, may also
deeply influence coccolithophorid morphology and calcification (Riebesell et al., 2000; Langer et al., 2006; Iglesias-Rodriguez et al., 2008). Dissolved CO2 in oceanic waters has
been observed to influence coccolith size in modern natural systems (Zondervan, 2007), and is also inferred to influence the size of ancient coccoliths and nannoliths (Bornemann et al., 2003; Mattioli et al., 2004; Tremolada et al., 2008). Nevertheless, the response of coccolithophorid calcification to pCO2 conditions in cultures appears to vary both within and
between species andmay also be greatly dependent on initial experimental conditions (Riebesell et al., 2000; Langer et al., 2006; Iglesias-Rodriguez et al., 2008), thus preventing any generalisation. Lastly, it should be noted that light availability within the photic zone and water transparency are also considered important factors that control the development of photo-autotrophic communities (Hallock, 1987; Ahagon et al., 1993).
Although the depth of the depositional basin in the Peniche area probably did not exceed 200 m during the early Jurassic (Bjerrumet al., 2001), we can reasonably assume that light intensity decreased with increasing depth, as it does in modern oceans (Molfino and McIntyre, 1990). Accordingly, two water masses should have existed in the photic zone of the Jurassic Lusitanian basin: 1) the upper photic zone, corresponding to a water body where light was available but, because of settling, nutrients were scarce; and 2) the lower photic zone, which was probably richer in nutrients but had a limited light intensity. Recent works suggest that C. crassus was a deep-dweller in relation with its large size (in fact it is the largest coccolith of the early Jurassic), and its abundance in distal environments (Bour et al., 2007; Mattioli et al., 2008). Often in Lower Jurassic samples, faecal pellets are observed to be composed solely of C. crassus and Crepidolithus cavus, suggesting these two species should have had a habitat different (deeper) than all the other coccoliths (Mattioli, personal observation). Crepidolithus crassus was therefore likely inhabiting the lower photic zone in a way that is similar to the living species Florisphaera profunda (Molfino and McIntyre, 1990). Other nannoliths seems to have had a similar habitat in the fossil record such as the Cretaceous nannoconids (Erba, 1994). The two limiting factors for the development of F.
profunda and, more generally, of deep-dweller species are the nutricline depth within the
photic zone (Molfino and McIntyre, 1990) and the degree of light penetration dependent on the transparency of the water column (Ahagon et al., 1993).
The size of the coccosphere is generally related to the size of the cell, which in turn controls the size of the coccolith (Westbroek et al., 1984; Henderiks, 2008). Interestingly, Young (1994) proposed a link between both the mass and the size of the coccosphere and the habitat depth of coccolithophorids within the oceanic photic zone related to a ballasting effect. The “small crassus” group, because of its smaller coccolith size, should have formed smaller coccospheres, which in turn should have been characterised by a lighter mass than the “large crassus” group. Thus, it seems likely that the “small crassus” thrived at shallower depths in the lower photic zone than the “large crassus”. As the proportion of the two morphotypes of C. crassus appears to have been controlled by orbital forcing, we can reasonably infer that the recorded size changes correspond to variations in the nutricline depth or the water column transparency. Fluctuations of nutricline depth in tune with orbital cycles have already been recognised on the basis of coccolith assemblages in the Neogene (Beaufort and Aubry, 1990; Beaufort, 1994).
Other environmental parameters potentially controlling coccolith size in the Peniche area cannot be excluded. However, according to oxygen isotope analyses and biomarker evidence, important temperature or salinity fluctuations are not observed in the short time interval studied (Veiga de Oliveira et al., 2006; Suan et al., 2010). Large temperature variations have been observed in the upper photic zone during recent glacial/interglacial fluctuations, but these variations are much reduced at tropical latitudes (Liu et al., 2008). Even though the Late Neogene is probably not a good analogue to the Jurassic system, we can reasonably infer that temperature fluctuations were small on a precessional scale at the
palaeolatitude at which Peniche was situated during the Pliensbachian. Though changes in pCO2 can influence the biocalcification of coccoliths and coccolithophore cell sizes in cultures
(Riebesell et al., 2000; Langer et al., 2006; Iglesias-Rodriguez et al., 2008), the variations in pCO2 recorded in the precession couplet for the last 800,000 years seem to have been very
small (max 100 ppm; Petit et al., 1999; Duplessy et al., 2008). It should be emphasized that the amount of pCO2 variations at the precession timescale during the early Jurassic is
currently poorly-constrained. Nevertheless, it can be reasonably assumed that pCO2
changes at such timescales were in the same order of magnitude as that evidenced for the last 800,000 years, although Jurassic pCO2 levels were much higher than in the Quaternary
(Fletcher et al., 2008). Accordingly, it is unlikely that pCO2 changes were the main factor that
controlled the variations in size of C. crassus.
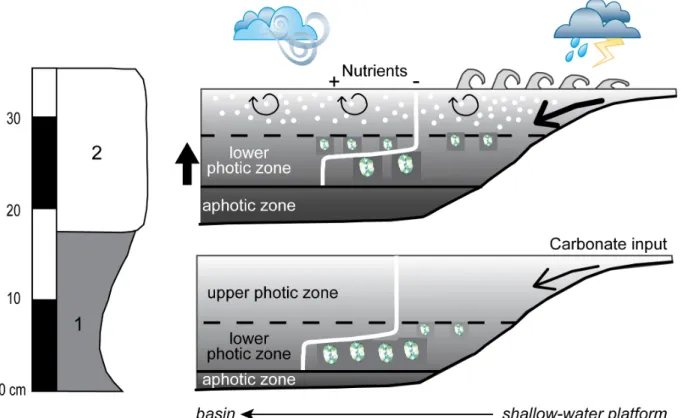
Fig. 10. Changes in the dominance of the different-sized C. crassus groups during a precession cycle. 1. During marlstones deposition: the storm activity was weak, the nutricline was relatively deep and the photic zone was expanded; in these conditions, the “large crassus” group was dominant. 2. During argillaceous limestone deposition: the storm activity was more intense, the turbidity was enhanced in the water column and the light penetration decreased. Mixing in the photic zone favoured nutrient recycling. Such conditions favoured the development of the “small crassus” group.
4.4. Proposed environmental model
Regardless of the precise environmental parameter that controlled the abundance of the two differently-sized groups, any considered explanation should take into account the coeval fluctuations of the carbonate contents observed through the same interval (Fig. 8). Based on these considerations, an environmental model is here proposed (Fig. 10). First, the nannofossil absolute abundance indicates that the carbonate mud in Peniche was probably not produced by nannofossils, and was thus most probably linked to platform production and export, as proposed for the early Toarcian time interval in the same area (Suan et al., 2008a). Analogously to modern systems (e.g., the Bahamas, Hine et al., 1981; Nittrouer and Wright, 1994), the export of carbonate mud from shallow platforms towards the Lusitanian
basin was probably linked to storm activity, intensity and/or frequency. Hence, the average turbidity of surface waters was likely higher during argillaceous limestone deposition because of an increased (micro-) particle export from surrounding platforms. If storms were at the origin of the remobilisation of carbonate mud produced in shallower environments in times of argillaceous limestone deposition, mixing in the water column was probably more intense than during marlstone formation. Due to mixing in the upper photic zone, the nutricline was shallower and because of the micro-particles in suspension, the turbidity was enhanced. In these conditions, light penetration in the lower photic zone was reduced, thus limiting the development of the “large crassus”. Conversely, less carbonate was exported during marlstones formation, probably in relation to decreased storm activity, which may have increased water column transparency and promoted water stratification, favouring a deepening of the nutricline. These conditions in turn allowed the proliferation of the “large crassus”.
If this model holds true, the cause and meaning of the “perturbed” interval (from samples PLP 211 to PLP 223), where the calcium carbonate content, coccolith size and relative abundance of “large crassus” are correlated, still remains unclear. The base of this interval coincides with the boundary of the Jamesoni and Ibex ammonite zones; interestingly, the horizon where the minimum coccolith size was measured is immediately followed by a level enriched in organic matter (just below the Jamesoni/Ibex boundary). Perhaps a local environmental stress at the Jamesoni/Ibex boundary could explain the breakdown of the regular variations observed before and after this interval. In Italy, the positive δ13C excursion starting at the Jamesoni/Ibex limit has been interpreted as representing stressful eutrophic conditions but without any evidence of global extension (Morettini et al., 2002). Further geochemical analyses (e.g., Total Organic Carbon and bulk carbonate oxygen isotope values) may help in understanding the nature of environmental stress around the Jamesoni/Ibex boundary in Peniche.
5. Conclusion
• High-resolution biometrics performed on the coccolith Crepidolithus crassus in the early Pliensbachian of Peniche, Portugal, provides clear evidence that orbital cycles exerted an important influence on the variations in algae size over a ∼200 kyr time interval. The size of
C. crassus is inversely correlated with calcium carbonate content, indicating that both
parameters were likely controlled by similar, orbitally-paced changes in environmental conditions.
• Mixture analyses applied to the whole dataset and to each stratigraphic sample indicate that the size variations of C. crassus through time likely reflect changes in the relative abundance of two differently-sized groups: “small crassus”, with a mean major axis size of 6.5±0.75 μm, and “large crassus”, with a mean size of 8.5±0.75 μm. We thus propose that these two groups were both characterised by ecological affinities for the lower photic zone habitat, and they could regulate their buoyancy and habitat depth in the water column through their coccolith masses.
• As the two differently-sized groups recorded in our study likely inhabited slightly different water-depth habitats, they may have corresponded with pseudo-cryptic species whose alternating dominance likely reflects a fluctuating nutricline and photic zone depth, under the control of the orbital cycles of eccentricity and precession. Biometrics on coccoliths, therefore, seems to be a promising tool for reconstructing nutricline fluctuations and cryptic biodiversity in deep geological times.
• In the last decade, considerable research efforts have focused on the physiological response of coccolithophore algae to anthropogenic CO2 emissions and their influence on
ocean acidification (Riebesell et al., 2000; Langer et al., 2006; Iglesias-Rodriguez et al., 2008). Also, large changes in coccolith and nannolith size reported during major events of environmental changes, like the Mesozoic anoxic events or the Palaeocene-Eocene Thermal
Maximum, have been generally interpreted in terms of CO2-induced perturbations (Mattioli et
al., 2004; Bornemann and Mutterlose, 2006; Suan et al., 2008a; Tremolada et al., 2008). In contrast, our study demonstrates that regular, orbitally-driven algal size (and mass) changes, which are in the same range of mass reduction observed in cultures under increased pCO2, can occur in response to non-catastrophic environmental fluctuations. Although increasing evidence suggests that ocean acidification represents a major threat to marine biodiversity (Feely et al., 2004; Orr et al., 2005), our results suggest that coccolithophore bio-calcification may be also deeply influenced by orbitally-controlled environmental factors. These factors, therefore, should also be taken into consideration by future investigations.
Acknowledgements
The contribution of Luís V. Duarte during our fieldtrip in Portugal was very helpful. Discussions on biometric techniques with Jorijntje Henderiks and Mario Cachão were much appreciated. The remarks and comments of an anonymous reviewer and Mario Cachão greatly improved the overall quality this manuscript. We also would like to thank the Editor Finn Surlyk for his constructive criticisms. This paper is a contribution of the team PROMES of the UMR 5125 CNRS.
Appendix A. Supplementary data
Supplementary data associated with this article can be found at doi:10.1016/j.palaeo.2010.06.006.
References
Ahagon, N., Tanaka, Y., Ujiié, H., 1993. Florisphaera profunda, a possible nannoplankton indicator of late Quaternary changes in sea-water turbidity at the northwestern margin of the Pacific. Mar. Micropaleontol. 22 (3), 255–274.
Akaike, H., 1973. Information theory and an extension of the Maximum Likelihood principle. In: Petrov, B.N., Csaki, F. (Eds.), 2nd International Symposium on Information Theory. Akademia Kiado, Budapest, pp. 267–281.
Akaike, H., 1983. Information measures and model selection, Proceedings of the 44th session of the International Statistical Institute, pp. 277–291.
Bassoulet, J.P., Elmi, S., Poisson, A., Cecca, F., Bellion, Y., Guiraud, R., Baudin, F., 1993. Mid Toarcian. In: Dercourt, J., Ricou, L.E., Vrielynck, B. (Eds.), Atlas of Tethys Paleoenvironmental Maps, pp. 63–80. Beicip-Franlab, Rueil-Malmaison, France.
Baumann, K.-H., 2004. Importance of size measurements for coccolith carbonate flux estimates. Micropaleontology 50 (Suppl_1), 35–43.
Beaufort, L., 1991. Adaptation of the random settling method for quantitative studies of calcareous nannofossils. Micropaleontology 37, 415–418.
Beaufort, L., 1994. Climatic importance of the modulation of the 100 kyr cycle inferred from 16 m.y. long Miocene records. Paleoceanography 9 (6), 821–834.
Beaufort, L., Aubry, M.-P., 1990. Fluctuations in the composition of late Miocene calcareous nannofossil assemblages as a response to orbital forcing. Paleoceanography 5 (6), 845– 865.
Beaufort, L., Lancelot, Y., Camberlin, P., Cayre, O., Vincent, E., Bassinot, F., Labeyrie, L., 1997. Insolation cycles as a major control of equatorial Indian ocean primary production. Science 278, 1451–1454.
Berger, A.L., 1978. Long-term variations of daily insolation and Quaternary climatic changes. J. Atmos. Sci. 35, 2362–2367.
Bjerrum, D.J., Surlyk, F., Callomon, J.H., Slingerland, R.L., 2001. Numerical paleoceanography study of the Early Jurassic transcontinental Laurasian seaway. Paleoceanography 16, 390–404.
Bollmann, J., 1997. Morphology and biogeography of Gephyrocapsa coccoliths in Holocene sediments. Mar. Micropaleontol. 29, 319–350.
Bollmann, J., Herrle, J.O., 2007. Morphological variation of Emiliania huxleyi and sea surface salinity. Earth Planet. Sci. Lett. 255, 273–288.
Bollmann, J., Herrle, J.O., Cortés, M.Y., Fielding, S.R., 2009. The effect of sea water salinity on the morphology of Emiliania huxleyi in plankton and sediment samples. Earth Planet. Sci. Lett. 284, 320–328.
Bornemann, A.,Mutterlose, J., 2006. Size analyses of the coccolith species Biscutum constans and Watznaueria barnesiae from the Late Albian “Niveau Breistroffer” (SE France): taxonomic and palaeoecological implications. Geobios 39, 599–615.
Bornemann, A., Aschwer, U., Mutterlose, J., 2003. The impact of calcareous nannofossils on the pelagic carbonate accumulation across the Jurassic–Cretaceous boundary. Palaeogeogr. Palaeoclimatol. Palaeoecol. 199, 187–228.
Bornemann, A., Pross, J., Reichelt, K., Herrle, J.O., Hemleben, C., Mutterlose, J., 2005. Reconstruction of short-term palaeoceanographic changes during the formation of the Late Albian ‘Niveau Breistroffer’ black shales (Oceanic Anoxic Event 1d, SE France). J. Geol. Soc. Lond. 162, 623–639.
Bour, I., Mattioli, E., Pittet, B., 2007. Nannofacies analysis as a tool to reconstruct paleoenvironmental changes during the Early Toarcian anoxic event. Palaeogeogr. Palaeoclimatol. Palaeoecol. 249 (1–2), 58–79.
Bown, P.R., 1987. Taxonomy, evolution, and biostratigraphy of the late Triassic–early Jurassic calcareous nannofossils. Special papers in paleontology. The Palaeontological Association, London.
Bralower, T.J., Parrow, M., 1996. Morphometrics of the Paleocene coccolith genera Cruciplacolithus, Chiasmolithus, and Sullivania: a complex evolutionary history. Paleobiology 22 (3), 352–385.
Claps, M., Erba, E., Masetti, D., Melchiorri, F., 1995. Milankovitch-type cycles recorded in Toarcian black shales from the Belluno Through (Southern Alps, Italy). Memoire di Scienze Geologiche 47, 179–188.
Colmenero-Hidalgo, E., Flores, J.-A., Sierro, F.J., 2002. Biometry of Emiliania huxleyi and its biostratigraphic significance in the Eastern North Atlantic Ocean and Western Mediterranean Sea in the last 20.000 years. Mar. Micropaleontol. 46 (3–4), 247–263. de Vargas, C., Bonzon, M., Rees, N.W., Pawlowski, J., Zaninetti, L., 2002. A molecular
approach to biodiversity and biogeography in the planktonic foraminifer Globigerinella siphonifera (d'Orbigny). Mar. Micropaleontol. 45 (2), 101–116.
de Vargas, C., Aubry, M.-P., Probert, I., Young, J.R., 2007. Origin and evolution of coccolithophores: from coastal hunters to oceanic farmers. In: Falkowski, P.G., Knoll, A. (Eds.), Evolution of primary producers in the sea. Academic Press, pp. 251–286.
Deflandre, G., 1954. In: Deflandre, G., Fert, C. (Eds.), Observations sur les coccolithophoridés actuels et fossiles en microscopie ordinaire et électronique: Annales Paleontologie, pp. 115–176.
Duarte, L.V., Wright, V.P., Fernandez-Lopez, S., Elmi, S., Krautter, M., Azerêdo, A., Henriques, M.H., Rodrigues, R., Perilli, N., 2004. Early Jurassic carbonate evolution in the Lusitanian Basin: facies, sequence stratigraphy and cyclicity. In: Duarte, L.V., Henriques,
M.H. (Eds.), Carboniferous and Jurassic Carbonate Platforms of Iberia. 23 rd IAS Meeting of Sedimentology, Coimbra. Field Trip Guidebook vol. 1, pp. 73–91.
Duplessy, J.-C., Charbit, S., Kageyama, M.,Masson-Delmotte, V., 2008. Insolation and sea level variations during Quaternary interglacial periods: a review of recent results with special emphasis on the last interglaciation. C. R. Geosci. 340 (11), 701–710.
Einsele, G., 1982. Limestone-Marl cycles (periodites): Diagnosis, significance, causes — a review. In: Einsele, G., Seilacher, A. (Eds.), Cyclic and event stratification. Springer, Berlin.
Einsele, G., Ricken, W., 1991. Limestone-Marl alternation — an overview. In: Einsele, G., Ricken, W., Seilacher, A. (Eds.), Cycles and events in stratigraphy. Springer-Verlag, Berlin Heidelberg.
Elmi, S., 2006. Pliensbachian/Toarcian boundary: the proposedGSSP of Peniche (Portugal). Volumina Jurassica, Institute of GeologyWarsow University IV, pp. 5–16.
Elmi, S., Rocha, R.B., Mouterde, R., 1988. Sédimentation pélagique et encroûtements cryptalgaires: les calcaires grumeleuxduCarixienportugais. Ciènciasda Terra 9, 69–90. Elrick, M., Hinnov, L.A., 1996. Millenial-scale climate origins for stratification in Cambrian and
Devonian deep-water rhythmites, western USA. Palaeogeogr. Palaeoclimatol. Palaeoecol. 123, 353–372.
Erba, E., 1994. Nannofossils and superplumes: the early Aptian “nannoconid crisis”. Paleoceanography 9 (3), 483–501.
Erba, E., 2006. The first 150 million years history of calcareous nannoplankton: biosphere– geosphere interactions. Palaeogeogr. Palaeoclimatol. Palaeoecol. 232, 237–250.
Erba, E., Castradori,D., Guasti,G., Ripepe,M., 1992. Calcareous nannofossils and Milankovitch cycles: the example of the Albian Gault Clay Formation (southern England). Palaeogeogr. Palaeoclimatol. Palaeoecol. 93, 47–69.
Favre, E., Escarguel, G., Suc, J.-P., Vidal, G., Thévenod, L., 2008. A contribution to deciphering the meaning of AP/NAP with respect to vegetation cover. Rev. Palaeobot. Palynol. 148, 13–35.
Feely, R.A., Sabine, h.L., Lee,K., Berelson,W., Kleypas, J., Fabry,V.J., Millero, F.J., 2004. Impact of anthropogenic CO2 on the CaCO3 system in the Oceans. Science 305, 362– 366.
Fletcher, W.J., Brentnall, S.J., Anderson, C.W., Berner, R.A., Beerling, D.J., 2008. Atmospheric carbon dioxide linked with Mesozoic and early Cenozoic climate changes. Nat. Geosci. 1, 43–48.
Geisen, M., Bollmann, J., Herrle, J.O., Mutterlose, J., Young, J.R., 1999. Calibration of the random settling technique for calculation of absolute abundances of calcareous nannoplankton. Micropaleontology 45 (4), 437–442.
Geisen, M., Billard, C., Broerse, A.T.C., Cros, L., Probert, I., Young, J.R., 2002. Life-cycle associations involving pairs of holococcolithophorid species: intraspecific variation or cryptic speciation? Eur. J. Phycol. 37, 531–550.
Gradstein, F., Ogg, J., Smith, A., 2004. A geologic time scale. Cambridge University Press, Cambridge.
Green, J.C., Heimdal, B.R., Paasche, E., Moate, R., 1998. Changes in calcification and the dimensions of coccoliths of Emiliania huxleyi (Haptophyta) grown at reduced salinities. Phycologia 37, 121–131.
Hallock, P., 1987. Fluctuation in the trophic resource continuum: a factor in global diversity cycles? Paleoceanography 2 (5), 457–471.
Hammer, Ø., Harper, D.A.T., Ryan, P.D., 2001. PAST: paleontological statistics software package for education and data analysis. Palaeontologia Electronica 4, 1–9.
Harper, D.A.T., 1999. Numerical Palaeobiology. John Wiley & Sons, Chichester.
Henderiks, J., 2008. Coccolithophore size rules — reconstructing ancient cell geometry and cellular calcite quota from fossil coccoliths. Mar. Micropaleontol. 67, 143–154.
Henderiks, J., Pagani, M., 2008. Coccolithophore cell size and the Paleogene decline in atmospheric CO2. Earth Planet. Sci. Lett. 269 (3–4), 575–583.
Herrle, J.O., Pross, J., Friedrich, O., Hemleben, C., 2003. Short-term environmental changes in the Cretaceous Tethyan Ocean: micropaleontological evidence from the Early Albian Oceanic Anoxic Event 1b. Terra Nova 15, 14–19.
Hilgen, F.J., Abdul Aziz, H., Krijgsman, W., Raffi, I., Turco, E., 2003. Integrated stratigraphy and astronomical tuning of the Serravallian and lower Tortonian at Monte dei Corvi (Middle-Upper Miocene, northern Italy). Palaeogeogr. Palaeoclimatol. Palaeoecol. 199 (3– 4), 229–264.
Hine, A.C., Wilber, R.J., Bane, J.M., Neumann, A.C., Lorenson, K.R., 1981. Offbank transport of carbonate sands along open, leeward bank margins: Northern Bahamas. Mar. Geol. 42 (1–4), 327–348.
Hinnov, L.A., Park, J.J., 1999. Strategies for assessing Early-Middle (Pliensbachian– Aalenian) Jurassic cyclochronologies. Philos. Trans. R. Soc. Lond. 357, 1831–1859. Iglesias-Rodriguez, M.D., Halloran, P.R., Rickaby, R.E.M., Hall, I.R., Comenero-Hidalgo, E.,
Gittins, J.R., Green, D.R.H., Tyrrell, T., Gibbs, S.J., Dassow, P.v., Rehm, E., Armbrust, E.V., Boessenkool, K.P., 2008. Phytoplankton calcification in a high-CO2 world. Science 320, 336–340.
Knappertsbusch, M., Cortes, M.Y., Thierstein, H.R., 1997. Morphologic variability of the coccolithophorid Calcidiscus leptoporus in the plankton, surface sediments and from the Early Pleistocene. Mar. Micropaleontol. 30, 293–317.
Langer, G., Geisen, M., Baumann, K.-H., Kläs, J., Riebesell, U., Thoms, S., Young, J.R., 2006. Species-specific responses of calcifying algae to changing seawater carbonate chemistry. Geochemistry, Geophysics, Geosystems 7, Q09006. doi:10.1029/2005GC001227.
Liu, Z., Cleaveland, L.C., Herbert, T.D., 2008. Early onset and origin of 100-kyr cycles in Pleistocene tropical SST records. Earth Planet. Sci. Lett. 265, 703–715.
Mann, M.E., Lees, J.M., 1996. Robust estimations of background noise and signal detection in climatic time series. Climate Change 33, 409–445.
Mattioli, E., 1997. Nannoplankton productivity and diagenesis in the rhythmically bedded Toarcian–Aalenian Fiuminata sequence (Umbria–Marche Apennine, Central Italy). Paleogeogeography, Paleoclimatology, Paleoecology 130, 113–134.
Mattioli, E., Pittet, B., Palliani, R., Rohl, H.-J., Schmid-Rohl, A., Morettini, E., 2004. Phytoplankton evidence for the timing and correlation of palaeoceanographical changes during the early Toarcian oceanic anoxic event (Early Jurassic). J. Geol. Soc. 161 (4), 685–693.
Mattioli, E., Pittet, B., Suan, G., Mailliot, S., 2008. Calcareous nannoplankton changes across the early Toarcian oceanic anoxic event in the Western Tethys. Paleoceanography 23, PA3208. doi:10.1029/2007PA001435.
McIntyre, A., 1967. Coccoliths as paleoclimatic indicators of Pleistocene glaciation. Science 158, 1314–1317.
McIntyre, A., Bé, A.W.H., Roche, M.B., 1970. Modern Pacific Coccolithophorida: a paleontological thermometer. Trans. NY Acad. Sci. 32, 720–731.
Milankovitch, M., 1941. Kanon der erdbestahlung und seine anwendung auf das eiszeitproblem, 133. Königlich Serbische Academie, Belgrade.
Molfino, B., McIntyre, A., 1990. Precessional forcing of nutricline dynamics in the equatorial Atlantic. Science 249, 766–769.
Morard, R., Quillévéré, F., Escarguel, G., Ujiee, Y., De Garidel-Thoron, T., Norris, R.D., De Vargas, C., 2009. A model for morphological recognition in cryptic species of Orbulina universa (planktonic foraminifera). Mar. Micropaleontol. 71, 148–165.
Morettini, E., Santantonio, M., Bartolini, A., Cecca, F., Baumgartner, P.O., Hunziker, J.C., 2002. Carbon isotope stratigraphy and carbonate production during the Early-Middle Jurassic: examples from the Umbria–Marche–Sabina Apennines (central Italy). Palaeogeogr. Palaeoclimatol. Palaeoecol. 184, 251–273.
Mouterde, R., 1955. Le Lias de Peniche. Comunicacoes dos Servicos Geologicos de Portugal 36, 1–33.
Mutterlose, J., Ruffel, A., 1999. Milankovitch-scale palaeoclimatic changes in pale-dark bedding rhythms from the Early Cretaceous (Hauterivian and Barremian) of eastern Englandand northernGermany.Palaeogeogr. Palaeoclimatol.Palaeoecol. 154, 133–160. Narciso, A., Cachão, M., de Abreu, L., 2006. Coccolithus pelagicus subsp. pelagicus versus
Coccolithus pelagicus subsp. braarudii (Coccolithophore, Haptophyta): A proxy for surface subarctic Atlanticwaters off Iberia during the last 200 kyr. Mar. Micropaleontol. 59, 15–34. Ndiaye, M., 2007. A multipurpose software for Stratigraphic Signal Analysis.
http://home.etu.unige.ch/~ndiayma8/.
Nittrouer, C.A., Wright, L.D., 1994. Transport of particles across continental shelves. Rev. Geophys. 32 (1), 85–113.
Noël, D. (Ed.), 1965. Sur les coccolithes du Jurassique européen et d'Afrique du Nord. Essai de classification des coccolithes fossiles. Editions du CNRS, Paris. 209 pp.
Olivier, N., Pittet, B., Mattioli, E., 2004. Palaeoenvironmental control on sponge-microbialite reefs and contemporaneous deep-shelf marl-limestone deposition (Late Oxfordian, southern Germany). Palaeogeogr. Palaeoclimatol. Palaeoecol. 212, 233–263.
Orr, J.C., Fabry, V.J., Aumont, O., Bopp, L., Doney, S.C., Feely, R.A., Gnanadesikan, A., Gruber, N., Ishida, A., Joos, F., Key, R.M., Lindsay, K., Maier-Reimer, E., Matear, R., Monfray, P., Mouchet, A., Najjar, R.G., Plattner, G.-K., Rodgers, K.B., Sabine, C.L., Sarmiento, J.L., Schlitzer, R., Slater, R.D., Totterdell, I.J., Weirig, M.-F., Yamanaka, Y., Yool, A., 2005. Anthropogenic ocean acidification over the twenty-first century and its impact on calcifying organisms. Nature 437, 681–686.
Pardo-Igúzquiza, E., Rodríguez-Tovar, F.J., 2005. MAXENPER: a program for maximum entropy spectral estimation with assessment of statistical significance by the permutation test. Comput. Geosci. 31 (5), 555–567.
Pardo-Igúzquiza, E., Rodríguez-Tovar, F.J., 2006. Maximum entropy spectral analysis of climatic time series revisited: assessing the statistical significance of estimated spectral peaks. J. Geophys. Res. 111, D10102. doi:10.1029/2005JD006293.
Parente, A., Cachão, M., Baumann, K.-H., de Abreu, L., Ferreira, J., 2004. Morphometry of Coccolithus pelagicus s.l. (Coccolithophore, Haptophyta) from offshore Portugal, during the last 200 kyr. Micropaleontology 50, 107–120.
Petit, J.R., Jouzel, J., Raynaud, D., Barkov, N.I., Barnola, J.-M., Basile, I., Bender, M., Chappellaz, J., Davis, M., Delaygue, G., Delmotte, M., Kotlyakov, V.M., Legrand, M.,
Lipenkov, V.Y., Lorius, C., Pépin, L., Ritz, C., Saltzman, E., Stievenard, M., 1999. Climate and atmospheric history of the past 420,000 years from the Vostok ice core, Antartica. Nature 399, 429–436.
Pittet, B., Mattioli, E., 2002. The carbonate signal and calcareous nannofossil distribution in an Upper Jurassic section (Balingen-Tieringen, Late Oxfordian, southern Germany). Palaeogeogr. Palaeoclimatol. Palaeoecol. 179 (1–2), 71–96.
Popescu, S.-M.,Dalesme, F., Jouannic,G., Escarguel, G.,Head, M.J.,Melinte-Dobrinescu,M.C., Suto-Szentai, M., Bakrac, K., Clauzon, G., Suc, J.-P., 2009. Galeacysta etrusca complex, dinoflagellate cyst marker of Paratéthyan influxes into the Mediterranean sea before and after the peak of the Messinian salinity crisis. Palynology 33, 105–134. Redner, R.A., Walker, H.F., 1984. Mixture densities, maximum likelihood and the EM
algorithm. SIAM Rev. 26 (2), 195–239.
Renaud, S., Klaas, C., 2001. Seasonal variations in the morphology of the coccolithophore Calcidiscus leptoporus off Bermuda (N. Atlantic). J. Plankton Res. 23 (8), 779–795.
Rickaby, R.E.M., Bard, E., Sonzogni, C., Rostek, F., Beaufort, L., Barker, S., Rees, G., Schrag, D.P., 2007. Coccolith chemistry reveals secular variations in the global ocean carbon cycle? Earth Planet. Sci. Lett. 253 (1–2), 83–95.
Riebesell, U., Zondervan, I., Rost, B., Tortell, P.D., Zeebe, R.E., Morel, F.M.M., 2000. Reduced calcification of marine plankton in response to increase atmospheric CO2. Nature 407, 364–367.
Rost, B., Riebesell, U., 2004. Coccolithophore calcification and the biological pump: response to environmental changes. In: Thierstein, H.R., Young, J.R. (Eds.), Coccolithophores: From molecular processes to global impact. Springer.
Sáez, A.G., Lozano, E., 2005. Body doubles. Science 433, 111.
Scotese, C.R., 2001. Paleomap Project. http://www.scotese.com/jurassic.htm.
Simpson, G.G., Roe, A., Lewontin, R.C., 1960. Quantitative Zoology. Harcourt & Brace, New-York.
Suan, G., Pittet, B., Bour, I., Mattioli, E., Duarte, L.V., Mailliot, S., 2008a. Duration of the Early Toarcian carbon isotope excursion deduced from spectral analysis: consequence for its possible causes. Earth Planet. Sci. Lett. 267 (3–4), 666–679.
Suan, G., Mattioli, E., Pittet, B., Mailliot, S., Lécuyer, C., 2008b. Evidence for major environmental perturbation prior to and during the Toarcian (Early Jurassic) oceanic anoxic event from the Lusitanian Basin, Portugal. Paleoceanography 23.
Suan, G., Mattioli, E., Pittet, B., Lécuyer, C., Suchéras-Marx, B., Duarte, L.V., Philippe, M., Reggiani, L., Martineau, F., 2010. Secular environmental precursors to Early Toarcian (Jurassic) extreme climate changes. Earth Planet. Sci. Lett. 290, 448–458.
Titterington, D., Smith, A., Makov, U., 1985. Statistical analysis of finite mixture distributions. John Wiley & Sons, Chichester, U.K.
Tremolada, F., De Bernardi, B., Erba, E., 2008. Size variations of the calcareous nannofossil taxon Discoaster multiradiatus (Incertae sedis) across the Paleocene– Eocene thermal maximum in ocean drilling program holes 690B and 1209B. Mar. Micropaleontol. 67 (3–4), 239–254.
Ulrych, T.J., Bishop, T.N., 1975. Maximum entropy spectral analysis and autoregressive decomposition. Rev. Geophys. Space Phys. 13, 183–200.
Veiga de Oliveira, L.C., Rodrigues, R., Duarte, L.V., Brasil Lemos, V., 2006. Avaliação do potencial gerador de petroleo e interpretação paleoambiental com base em biomarcadores e isotopos estaveis de carbono da seção Pliensbaquiano-Toarciano
inferior (Jurassico Inferior) da região de Peniche (Bacia Lusitânica, Portugal). Bull. Geociencia Petrobras 14 (2), 207–234.
Walsworth-Bell, E.B., Bown, P.R., Weedon, G.P., 2000. Calcareous nannofossil cyclostratigraphy of the belemnite marls (Pliensbachian, UK), 8th International Nannoplankton Association. Journal of Nannoplankton Reasearch, Bremen. pp. 150–151. Weedon, G.P., 2003. Time-series analysis and cyclostratigraphy: examining stratigraphic
records of environmental cycles. Cambridge University Press, Cambridge.
Weedon, G.P., Jenkyns, H.C., 1990. Regular and irregular climatic cycles and the Belemnite Marls (Pliensbachian, Lower Jurassic, Wessex Basin). J. Geol. Soc. Lond. 147, 915–918. Weedon, G.P., Jenkyns, H.C., 1999. Cyclostratigraphy and the Early Jurassic timescale;
data from the Belemnite Marls, Dorset, southern England. Geol. Soc. Am. Bull. 111 (12), 1823–1840.
Westbroek, P., De Jong, E.W., Van Der Wal, P., Borman, A.H., De Vrind, J.P.M., Kok, D., De Bruijn, W.C., Parker, S.B., 1984. Mechanism of calcification in the marine alga Emiliania huxleyi. Philos. Trans. R. Soc. Ser. B 304, 435–444.
Westbroek, P., Young, J., Linschoooten, K., 1989. Coccolith production (biomineralization) in the marine alga Emiliania huxleyi. J. Protozool. 34, 368–373.
Westbroek, P., Brown, C.W., Bleijswijk, J.v., Brownlee, C., Brummer, G.J., Conte, M., Egge, J., Fernández, E., Jordan, R., Knappertsbusch, M., Stefels, J., Veldhuis, M., van der Wal, P., Young, J., 1993. A model system approach to biological climate forcing. The example of Emiliania huxleyi. Glob. Planet. Change 8 (1-2), 27–46.
Wright, V.P., Wilson, R.C.L., 1984. A carbonate submarine-fan sequence from the Jurassic of Portugal. J. Sed. Petrol. 54, 394–412.
Young, J.R., 1994. Functions of coccoliths. In: Winter, A., Siesser, W.G. (Eds.), Coccolithophores. Cambridge University Press, Cambridge, pp. 63–82.
Young, J.R., Ziveri, P., 2000. Calculation of coccolith volume and its use in calibration of carbonateflux estimates.Deep-Sea ResearchPart II Trop. Stud.Oceanogr. 47, 1679–1700. Zondervan, I., 2007. The effects of light, macronutrients, trace metals and CO2 on the
production of calcium carbonate and organic carbon in coccolithophores—a review. Deep-Sea Research Part II Trop. Stud. Oceanogr. 54, 521–537.