HAL Id: in2p3-00097830
http://hal.in2p3.fr/in2p3-00097830
Submitted on 22 Sep 2006HAL is a multi-disciplinary open access archive for the deposit and dissemination of sci-entific research documents, whether they are pub-lished or not. The documents may come from teaching and research institutions in France or abroad, or from public or private research centers.
L’archive ouverte pluridisciplinaire HAL, est destinée au dépôt et à la diffusion de documents scientifiques de niveau recherche, publiés ou non, émanant des établissements d’enseignement et de recherche français ou étrangers, des laboratoires publics ou privés.
SPIRAL2 RFQ prototype - First results
R. Ferdinand, R. Beunard, M. Di Giacomo, V. Desmezieres, P. Robillard, S.
Cazaux, M. Desmons, A. France, D. Leboeuf, O. Piquet, et al.
To cite this version:
R. Ferdinand, R. Beunard, M. Di Giacomo, V. Desmezieres, P. Robillard, et al.. SPIRAL2 RFQ prototype - First results. European Particle Accelerator Conference (EPAC’06), Jun 2006, Edinburgh, United Kingdom. Joint Accelerator Conferences Website, EPAC 2006, pp.282-284, 2006. �in2p3-00097830�
SPIRAL 2 RFQ PROTOTYPE – FIRST RESULTS
R. Ferdinand
#, R. Beunard, M. Di Giacomo, V. Desmezieres, P. Robillard, GANIL, France
S. Cazaux, M. Desmons, A. France, D. Leboeuf, O. Piquet, J-C. Toussaint CEA-Saclay, France
Y. Gómez-Martínez, M. Fruneau, CNRS-IN2P3 LPSC Grenoble France
A. Caruso, INFN-LNS, 95123 Catania ITALY.
Abstract
The SPIRAL2 RFQ is designed to accelerate either 5 mA deuteron beam (Q/A=1/2) or a 1 mA of q/A=1/3 particle up to 0.75 MeV/A at 88 MHz. It is a CW machine which has to show stable operation, provide the required availability and reduce losses to a minimum in order to minimize the activation constraints. Extensive modelisation was done to ensure a good vane position under RF. The prototype of this 4-vane RFQ was built and tested in INFN-LNS Catania and then in IN2P3-LPSC Grenoble. It allowed us to measure the vacuum quality, the RF field by X-ray measurements, the cavity displacement and the real vane displacement during the RF injection. Different techniques were used, including an innovative CCD measurement with a 0.8 µm precision. This paper outlines the different results.
INTRODUCTION
The SPIRAL 2 extension of the existing GANIL facilities is under construction. It will extend the exotic particle productions of the present GANIL complex towards heavier elements [1].
The driver is required to accelerate in CW mode, proton beam (5mA, 33MeV), deuteron beam (5mA, 40MeV) or heavy ions (1mA, 14.5MeV/nucleons). It will be made of two dedicated ion sources, a single RFQ, and 2 families of superconducting quarterwave resonators. This paper describes the first results achieved with the RFQ prototype tested in INFN-LNS Catania, Italy, and twice in LPSC-Grenoble, France.
RFQ EXPERIMENTAL SETUP
The RFQ was fully described elsewhere [2,3]. The reader is invited to refer to theses references to understand the mechanical choices leading to this 5-m long design.
The dynamics was calculated by the SPIRAL 2 beam dynamics team in end-to-end Linac simulations. The calculations [4] show beam transmission higher than 99%. With all combined errors (mechanical and RF) it has to be higher than 97% in order to allow hands-on maintenance on the cavity (deuteron acceleration). End-to-end simulations showed very good result for the RFQ. It is not the limitative accelerator component.
A 1-m long prototype was decided to verify its feasibility and control the construction cost. Under RF power, we had to prove the operation with RF joints between the vanes and the external tube, and to be able to tune it with the 2 water cooling circuits (no moveable tuner in the cavity). The final objectives are to verify the
vanes displacement under operation (requirements
±0.1 mm), crosschecked the 3D codes used for the design
with online measurement (temperature elevation, deformation, water cooling etc…) and to qualify the vacuum needed for heavy ion acceleration. The tests were planned to be conducted in different steps: The first one, already achieved was to test and tune the cavity at low level in Saclay. The second one, already achieved, was to send the prototype to INFN-LNS Catania for high power test with the idea of stressing the RF joins and verifying our ability to power the cavity. The third step, under analysis, was to measure the vane deformations under RF, to check the RF tuning range, measure the temperature elevation in different locations and compare them with the 3D codes in use.
Figure 1: RFQ experimental setup
Figure 2: RFQ in LNS-Catania
The difficulty was to work under a flow of X-Rays, and to measure displacement in the range of a few to tens of micrometers without being able to physically touch the moveable pieces. At the same time about 40 kW of RF power was injected in the prototype, with a huge flow of water cooling (which induces vibrations).
The 4-vanes and the external tube are water cooled with two separate water circuits. The cavity frequency is adapted using the two water temperatures. The vane
CCD analyses Thermocouples
Mechanical movement measurement (linear gages) 8 External tube water circuits (160l/mn total) Theodolite
113 kV
X-Ray analyses
8 Vanes plunger water circuits (240l/mn total)
ΔT (c)
ΔT (e)
____________________________________________
circuit uses simple and cheap water plungers. In the following, the global reference position is obtained with the prototype being regulated at 20°C.
Vanes displacement – mechanical measurement
Two Mitutoyo linear gages 542-121 were in use to measure the end plate dilatation under operation. They provide a (1.5+L/50)µm accuracy. They were located on the horizontal plane, diametrically opposed, on the end plate. This allows de-correlating the support table movement from the RFQ movement, one global movement being seen on both gages. In presence of the
water flow, random vibration of ±6.75 µm (p-p) was
observed (standard deviation of 2.1).
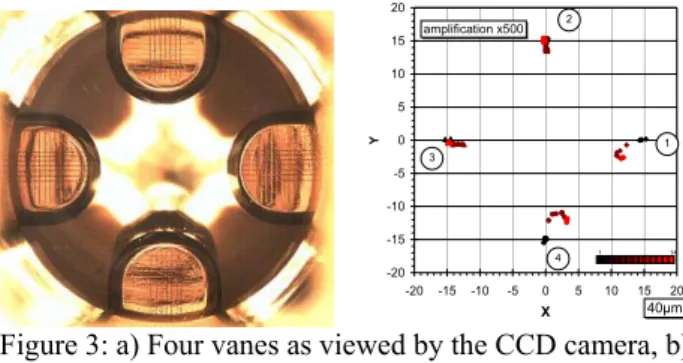
Vanes displacement – CCD measurements
This novel method is fully developed in reference [5]. It is based on observations with a Ligthwise LW-1.3-S-1394 CCD camera of a grid on the vane extremities, through a vacuum window. -20 -15 -10 -5 0 5 10 15 20 -20 -15 -10 -5 0 5 10 15 20 X Y amplification x500 1 14 1 2 3 4 40µm
Figure 3: a) Four vanes as viewed by the CCD camera, b) Reconstructed vanes displacement with RF (20kW with
huge dipolar effects – see end of the text)
On each individual vane extremity, the motion detection is transformed into RFQ coordinates with 0.8 µm accuracy (1 pixel = 28.7 µm).
Vanes displacement – Theodolite measurements
Classical theodolite measurements were tempted in order to cross-checked the above CCD measurements. The measurement was complicated with the X-Rays emitted from the beam axis. Two successive mirrors were used to allow human observation in safe conditions. More easy, is the observation of the external tube dilatation under RF and temperature increase.
Temperature measurements - thermocouples
32 classical thermocouples were used to record and compare temperature elevation on various parts of the RFQ and water circuits. The absolute temperature measurement accuracy was very poor, while the
temperature elevation was obtained with ±0.1°C accuracy.
Four were set on each end-plate, in front of each vane, in order to observe abnormal temperature elevation. One was set in a dedicate hole drilled in the middle of the north vane, down to 4 mm of the copper surface close to the beam axis. This measurement is marked "ΔT (c)" in this paper. One thermocouple was located in the vane hot spot, were the magnetic flux turns. It is named "ΔT (e)",
see figure 1 for locations.
EXPERIMENTAL RESULTS
The experiments were conducted under various conditions: RF power ranged from 0 to 39 kW (50 kW at INFN-LNS), vanes water temperature was fixed at 20°C and water temperature of the external tube varied from 20°C to 30.8°C.
The last experiment took place from May 23 to June 2, 2006 at LPSC Grenoble, and not all data were available for the paper. Only small parts of the collected data were cross-checked with codes.
Vacuum measurements.
The cavity was pumped with a cryogenic pump. The vacuum result was globally coherent with the estimated values based on a desorption rate equal to 4.5 10-7 Pa.m.s-1. The static pressure at the end of the tests
was better than expected. The value of 2 10-8 Pa
(uncorrected) was reached. The dynamic pressure is about
3 to 5 10-6 Pa mostly resulting in H
2 desorption. This is
less important for the beam losses in operation (light gas).
Because of the H2 desorption, a mix between 1 turbo and
3 cryo pumps is the reference solution for the final RFQ.
X-Rays measurements.
The X-rays measurements allowed correlating the injected RF power and the expected vane voltage. The results were similar, and proved the 113 kV achievement for 38.5 kW of RF power with the metallic vacuum joint.
Radiations were also measured for safety purpose on the final RFQ. Almost nothing could be measured through the 5 cm thick copper wall. Despite the 4 mm thick lead pieces up to 560 µSv/h was measured close to the vacuum port (stainless steel manifold) and 3900 µSv/h 10cm from the beam axis.
Vanes displacement
The different measurements were applied on both ends of the RFQ prototype.
We made first a classical expansion of the cavity with the external tube temperature increased (up to +12.8°C), and without injected RF power. The observed expansion of the tube (with the linear gage : 75.8 µm) and vane displacement (+40 µm on all vanes) allowed determining the thermal exchange coefficient in the water circuits.
They were found to be equal to 7000 W/m2.°C (6000
theoretical). This essential input data being established, we are able to correlate the observed data with the 3D code estimate. Calculations were obtained using CATIA as the 3D mesh generator, SOPRANO-Vector Fields for the power deposition and then with CASTEM for the cavity deformation.
The next table shows some values, first lines gives the theoretical value, the second one, in italic, the measured data. The first 2 sets of data are absolute numbers, referenced to “no RF” and “no external tube water temperature variation”. The last 2 sets of data are variations compared to the (39 kW, +0°C) just above. A
negative value on displacement means a movement toward the beam axis.
inputs results RF
(kW) Water temp variat. (°C) Δ(°C) T (e) Δ(°C) T (c) displ (µm) Vane expan (µmTube 0 +12.8 5.5 2.4 51.8 77.9 0 +12.8 5.66 2.41 ≈57.8 75.7 39 +0 16.3 14.8 -48.8 90.6 39 +0 16.7 16.9 +12.8 54.6 38.5 +4.6 +1.9 (18.3) +0.8 (15.6) +18.6 (-30.8) +28 (118.6) 38.5 +4.6 +1.7 (18.4) +0.5 (17.4) +21.5 (34.3) +23.4 (78) 38.5 +11.1 +4.8 (21.1) +2.1 (16.9) +45 (-3.8) +67.6 (158.2) 38.5 +11.1 +4.3 (21.1) +1.8 (18.7) +52.2 (65.1) +62.4 (117) We observe a big difference with the RF switched on, while the water temperature variations give good results. Other data, added to those, let us believe that the power deposition field is wrong, while the CASTEM results are right. As we observe also small dipolar effects, two possibilities are under investigation: either the code SOPRANO gives wrong 3D results, or the cavity field tuning is wrong (due to the end plates or transportation).
-15 -10 -5 0 5 10 15 20 25 30 35 40 45 Transmitted Power (kW) δ x ( µ m) RFQ entrance - vane 1 RFQ exit - vane 1 RFQ entrance - vane 3 RFQ exit - vane 3
Figure 4: Example of horizontal displacement of the 2 horizontal vanes versus the RF power – in entrance of the
RFQ (red colours) and exit of the RFQ (green)
Experiment difficulties and results
We observed problems at first. The end plate of the RFQ was about 10°C hotter at the exit of the RFQ compared to the input of the RFQ. Temperature difference of 2°C was also observed on the exit end plate in front of vanes 1 and 2 compared to vanes 3 and 4. In parallel, the CCD observation showed that vanes 1 and 4 were twisted during the first 10 min of RF injection (see figure 3b). We finally concluded that the thermal contact between the end-plate and the RFQ body was poor, inducing non symmetrical dilatation and dipolar effects. Tighten screws allowed us to recover greatly from this strange behaviour. We still see small dipolar effect in the cavity, and input/exit difference. We plan to study the effects on the RFQ voltage law. The dissymmetrical vanes displacement and temperature elevation is now small enough to avoid effect on the transverse beam dynamics. It may have
consequences on the longitudinal voltage law.
RF variation
The cavity frequency is shifted down by 166 kHz with the 38 kW RF injection. A 10.8°C temperature elevation was needed on the input water circuit of the external tube to come back to the original cavity frequency. We observed a perfectly linear dependence of the stabilized cavity frequency with the water temperature. The +15.62 kHz/°C is close to the +16 kHz/°C calculation. If the variation is too rough for the final RFQ, keeping the tube water temperature fixed, the slope becomes
-18 kHz/°C with the vane water cooling circuit
(unchecked yet). Driving the 2 temperatures together allows gaining a factor 10 on the sensitivity (2 kHz/°C).
CONCLUSION
The mechanical assembly allows easily the injection of 50 kW, CW, while only 40 kW is needed to power the 1-m long prototype cavity (RF loop and RF joins are OK) in order to obtain the requested 113 kV on the vanes.
The possibility to tune the cavity with the water temperature has been validated, with a linear dependence across the frequency range, close to the calculate one.
The vanes extremity displacement was measured with a novel technique allowing to measure movements as small as 0.8 µm with RF in the cavity. The measurements are still under analysis, but they show that the displacements are within +0/+60µm, below the allowed ±100µm. This test technique allows crosschecking the 3D codes commonly used in accelerator business, highlighting discrepancies with the power deposition and difficulties in thermal conduction between 2 tight copper pieces.
The next step will be to verify that the observed dilatations and vanes movements will not impact the longitudinal RFQ voltage law, the transverse field errors being already verified with the RFQ code TOUTATIS.
ACKNOWLEDGEMENTS
We would like to thanks INFN-LNS in Catania for their wonderful welcome, and their great help.
Many thanks also to the IN2P3-LPSC team for their invaluable help, especially during the problems we had.
REFERENCES
[1] T. Junquera et al., "Superconducting Driver Linac for the New Spiral 2 Radioactive Ion Beam Facility GANIL", this conference
[2] R. Ferdinand et al, “SPIRAL 2 RFQ Design”, page 2026-2028, Proc. EPAC 2004, Lucerne, Switzerland [3] RFQ Final Report, technical note SPIRAL2
EDMS-I-004532.
[4] R. Duperrier et al. "Status report on the beam dynamics developments for the SPIRAL2 project”, Proc. EPAC 2004, Lucerne, Switzerland, 2023-2025 [5] Alain France, et al “An Innovative Method to
Observe RFQ Vanes Motion with Full-scale RF Power and Water Cooling”, this conference.