Design of Cost-Optimized Village-Scale
Electrodialysis Systems for Brackish Water
Desalination
by
Natasha C. Wright
B.S., University of St. Thomas (2012)
S.M., Massachusetts Institute of Technology (2014)
Submitted to the Department of Mechanical Engineering
in partial fulfillment of the requirements for the degree of
Doctor of Philosophy in Mechanical Engineering
at the
MASSACHUSETTS INSTITUTE OF TECHNOLOGY
June 2018
@
Massachusetts Institute of Technology 2018. All rights reserved.
Author...Signature
redacted
Department of Mechanical Erdephing
May 18, 2018
Certified by...Signature
redacted-,-rios
. Winter, V
Associate Professor of Me'canical Engineering
Thesis Supervisor
Accepted by
...
Signature redacted
MASSACHUSETT INSTITUTE
Rohan 7beyaratne
Professor of Mechanical Engineering
JUN
2
5
2018
Graduate Officer
Design of Cost-Optimized Village-Scale Electrodialysis
Systems for Brackish Water Desalination
by
Natasha C. Wright
Submitted to the Department of Mechanical Engineering on May 18, 2018, in partial fulfillment of the
requirements for the degree of
Doctor of Philosophy in Mechanical Engineering
Abstract
This thesis proposes methods of reducing the cost of electrodialysis brackish water desalination systems, specifically for use in rural India, where 60% of the groundwater is too saline to drink. Convergence of socioeconomic and technical factors led to the insight that photovoltaic (PV) powered electrodialysis (ED) has the potential for impact in rural water treatment. In order to design a system that can meet the necessary production requirements, a robust parametric model was created to predict the desalination rate, limiting current density, and total energy use in an ED system. The model agrees with experimental measurements across two diverse ED stack designs, differing in total membrane area, membrane manufacturers, and flow channel spacers. A commercial-scale ED stack was additionally tested in Chelluru, India, building confidence that the model is predictive for real groundwater, and that
ED systems are feasible to operate in the rural Indian context.
The ED model was used within an optimization routine to determine the lowest cost operating mode and stack design, assuming existing, flat-stack architectures. Common operating modes including constant-voltage batch and multi-stage contin-uous systems were considered alongside novel operation modes including voltage-regulated batch and hybrid batch-continuous systems. For the production and de-salination rates required for a village-scale application, a voltage-regulated hybrid system that is fully optimized for membrane width, length, and channel thickness reduces the 10-year total cost and capital cost of the system by 37% and 47%, re-spectively, in comparison to a commercially available stack optimized under the same operation modes.
While matching of applied and limiting current densities can be achieved using a voltage-regulated batch operation (minimizing stack cost), this requires a potentially costly DC power supply and control system. The final part of the thesis proposes a spiral ED stack architecture that allows for matching through the geometry of the stack alone. Both a standard Archimedean spiral and an ideal irregular spiral shape are presented. The ideal spiral shape would reduce the 10-year total cost and capital cost by 21% and 39%, respectively, in comparison to the Archimedean spiral, and is cost-competitive with a hybrid voltage-regulated flat-stack design.
Thesis Supervisor: Amos G. Winter, V
Title: Associate Professor of Mechanical Engineering
Acknowledgments
I would like to thank the following people and organizations for their contributions
to my work:
e My family, immediate and extended, for their continuous support and
encour-agement.
* Amos, for his guidance and feedback on my work and life in general, as well
as his constant enthusiasm for research and design with impact in developing
economies.
e My friends, especially Dan, for helping me to maintain balance in my life.
e My labmates in the Global Engineering and Research (GEAR) Lab, for their
fun-loving spirit and for making our working and learning environment a
pos-itive one. Particularly to David Bian, Sterling Watson, Sahil Shah, Wei He,
Anne-Claire Lenaff, and Dev Ramanujan who collectively make up Team Desal
(and the best global travel buddies one could ask for). And to Susan Amrose,
Marius Peters, Elizabeth Brownell, and Jeff Costello for the their guidance and
assistance in moving this research forward.
e Georgia, Cathy, Fiona, Moti, Rosa, Hannah, Matt, and Sandra, my
under-graduate research assistants, for their commitment to the project, inquisitive
nature, creativity, and independent work ethic.
* Mr. Tenny Cherian, Mr. Anil Kumar, Mr. Sree Rama Murthy, and their team
at Tata Projects, for their unsurpassed support during field work, vision for
the potential impact of desalination in India, and hospitality during my field
work in Hyderabad, India.
e Dr. Jarah Meador and everyone involved in the USAID Desal Prize, for forcing
me to question my assumptions early and providing the opportunity to interact
and brainstorm with experts in field, both on other teams and within the group
of judges and organizers.
e Dr. Gregor von Medeazza (UNICEF, Jerusalem) and his partners for their
support and vision for safe water access in Israel and Gaza.
o Mr. R.B. Jain, Mr. Abhijit Joshi and Mr. Abhishek Nirakhe, of Jain Irrigation
Systems, Ltd., for the opportunity to work on this project and their hospitality
during my field work in Jalgaon, India.
" Drs. Rob Stoner, Chintan Vaishnav, and Nevan Hanumara from the Tata
Center at MIT, for their feedback on my work and efforts to bring valuable
speakers to the Fellows at the Tata Center.
" Drs. Amy Bilton, Ronan McGovern, and Karim Chehayeb for their willingness
to answer my questions and for demonstrating impactful PhD theses in the
area of desalination.
" Jamie Vinsant of Suez Water Technologies, for providing invaluable guidance
from the real-world of electrodialysis (ED), specifically on the design limitations
and freedoms surrounding the manufacturing of ED stacks.
" And last but certainly not least, all of the people I have met during my field
research in India and Israel. Thank you for taking the time to help me
under-stand and for all the meals we shared together.
I am also grateful to the following sources who have provided financial support
for this work:
Tata Projects
USAID and Securing Water for Food: A Grand Challenge for Development
UNICEF
Tata Center for Technology and Design at MIT
Jain Irrigation Systems, Ltd.
MIT Undergraduate Research Opportunities Program
Contents
1 Introduction
11
1.1
The Need for Brackish Water Desalination in Rural India . . . .
11
1.1.1
Most Existing Purification Technologies Target
Biological Contaminants . . . .
12
1.1.2
The Importance of Aesthetic Water Quality . . . .
13
1.1.3
Brackish Groundwater as the Primary Drinking Water Source
15
1.2
Design Requirements for a Village-Scale
Water-Treatment Plant . . . .
16
1.3
Merits of Electrodialysis (ED) Desalination . . . .
18
1.4
Partner Organization: Tata Projects . . . .
21
1.5
O utline of thesis . . . .
22
2 Robust Analytical Model of Electrodialysis with Experimental
Val-idation
29
2.1 Introduction: Limitation of Existing Models . . . .
30
2.2
M odel description . . . .
31
2.2.1
Variables and setup . . . .
32
2.2.2
Circuit analogy and current calculation . . . .
33
2.2.3
Mass transfer model . . . .
2.2.4
Water transport . . . .
2.2.5
Limiting current density . . . .
2.2.6 Coupling mass transfer to flow . . . .
2.2.7
Pressure drop . . . .
2.2.8
Energy consumption . . . .
2.3
Experimental setup and procedures . . . . .
2.3.1
Bench-scale system . . . .
2.3.2
Commercial-scale system . . . .
2.3.3
Membrane and spacer properties
2.3.4
Feed and rinse solutions . . . .
2.3.5
Limiting current density experiments
2.3.6 Desalination rate experiments . . . .
2.3.7
Entrance pressure drop experiments .
2.3.8
Error calculations . . . .
2.4 Results and model validation . . . .
2.4.1
Limiting current density validation .
2.4.2
Desalination rate validation . . . . .
2.4.3
Pressure drop validation . . . .
2.5 Discussion on model sensitivity . . . .
2.5.1
Sensitivity to area porosity . . . .
2.5.2
Sensitivity to void fraction . . . .
2.5.3
Sensitivity to model discretization
2.5.4
Sensitivity to membrane diffusion
2.5.5
2.5.6
Sensitivity to membrane and boundary layer resistances .
Sensitivity to water transport . . . .
. . . .
39
. . . .
43
. . . .
44
. . . .
44
. . . .
46
. . . .
52
. . . .
53
. . . .
53
. . . .
54
. . . .
55
. . . .
57
. . . .
57
. . . .
58
. . . .
58
. . . .
61
. . . .
61
. . . .
61
. . . .
63
. . . .
65
. . . .
68
. . . .
68
. . . .
69
. . . .
70
. . . .
72
72
74
2.5.7
Validity for multi-ion solutions . . . .
75
2.6
Conclusions . . . .
77
3 Cost-Optimal Design and Operation
87
3.1
Introduction . . . .
88
3.2
Operating Modes Considered
. . . .
89
3.2.1
Batch Operation . . . .
90
3.2.2
Continuous Operation . . . .
90
3.2.3
Hybrid Operation . . . .
91
3.2.4
Constant-Voltage vs. Voltage-Regulated
. . . .
92
3.3
Description of Staging Options in Continuous Operation . . . .
93
3.4
Cost Model . . . .
95
3.4.1
Capital Cost . . . .
96
3.4.2
10-Year Total Cost . . . .
98
3.5
Optimization . . . .
99
3.5.1
Problem Formulation . . . .
99
3.5.2
Objective Function . . . 100
3.5.3
Variables and Bounds . . . 100
3.5.4
Parameters . . . 101
3.5.5
Constraints . . . 102
3.5.6
Simulation and Optimizer . . . 104
3.6
Results and Discussion . . . 105
3.7
Sensitivity Analysis . . . 112
3.8
Conclusions . . . 113
4 Design of Spiral-Wound Electrodialysis Modules
123
4.1 Introduction . . . .
4.2 Analytical Model . . . .
4.2.1
Defining the Archimedean spiral .
4.2.2
Mass Transfer . . . .
4.2.3
Limiting Current . . . .
4.2.4
Voltage potential . . . .
4.2.5
Specific energy . . . .
4.3 Experimental validation of spiral model .
4.3.1
Prototype stack design . . . .
4.3.2
Experimental setup . . . .
4.3.3
Results and Discussion . . . .
4.4 Optimization of Spiral Design . . . .
4.4.1
Optimization of the Archimedean
4.4.2
Limitations of the Archimedean S
4.4.3
Description and Optimization of th
4.4.4
Discussion . . . .
4.5
Conclusions . . . .
. . . 126
. . . 127
. . . 129
. . . 129
. . . 130
. . . 131
. . . 132
. . . 132
. . . 133
. . . 134
. . . 139
)esign . . . 139
iral . . . 141
e Ideal Spiral . . . 143
. . . 146
. . . 150
1535 Conclusions
. 124Chapter 1
Introduction
This thesis proposes methods of reducing the cost of small-scale electrodialysis (ED)
brackish water desalination systems, specifically for use in rural India. The chapters
move from the development of a robust analytical model of ED, to the
implemen-tation of an optimization routine to determine the most cost-effective scheme of
implementing ED within the current flat-stack configuration, to the design of novel
spiral architectures. The socioeconomic and technical analysis that drove the
re-quirement for desalination in the rural Indian context and the reasons that ED was
chosen as the desalination technology to investigate is summarized here.
1.1
The Need for Brackish Water Desalination in
Rural India
India has nearly 600,000 villages that collectively house 800 million people [1]. This
rural population accounts for approximately 75% of India's total population. In
2010 the WHO UNICEF Joint Programme for Water Supply and Sanitation (JMP)
reported that 15% of the rural population was without access to an improved water
source [2]. The JMP defines an improved water source as a household connection,
public standpipe, borehole, protected dug well, protected spring or rainwater, where
as an unimproved source would include an unprotected spring, unprotected dug
well, tanker-truck, surface water, or bottled water. Even if a source is listed as
"improved" it may still be contaminated [2]. There are three primary categories of
water contaminants: biological, chemical, and physical. Proper selection of a water
purification technology depends on the contaminants present in the feed water source.
1.1.1
Most Existing Purification Technologies Target
Biological Contaminants
Approximately 71% of the rural population in India does not treat their drinking
water, and those that do typical strain the water through a piece of cloth (Fig.
1-1). While successful at removing large suspended particles and making the water
appear more clean, the mesh size of this cloth is around 100-150 Am, too large to be
an effective filter for most biological contaminants. Due to the cost of boiling and
ineffectiveness of traditional cloth filtering, many household treatment devices have
been developed with the goal of providing clean water in this context. Figure 1-2
shows four such technologies, all gravity fed filters that, when well maintained, are
successful at purifying water of biological contaminants to a safe level.
A few organizations, including Tata Projects and Safe Water Network, have
started to target other contaminants, including salinity. The following section will
look at why this transition is important.
Other
S Add alum powder, bleach, or chlorine
Strain Through Cloth Water Filter/Purifier No Treatment 71.3%
Figure 1-1: Percent distribution of rural households by method of water treatment.
Figure 1-2: Household filters that remove biological contaminants.
1.1.2
The Importance of Aesthetic Water Quality
In an attempt to better understand the issues surrounding water quality and
treat-ment options, a series of nine interviews with residents in five different villages in
Maharashtra State were completed in January 2013. While the goal of the interviews
was exploratory in nature (users were asked about the source of their drinking water,
water purification habits, and knowledge of household water purification devices sold
in India), in seven of the nine interviews, interviewees mentioned the high salinity
of their water, with statements such as the water source "tastes salty," the salinity
in the bore well made "coughing increase and it harder to digest," and that
off-the-shelf household water treatment options were undesirable since they didn't remove
the salty taste. The number of times that salinity was mentioned as an issue by
these end users without prompt was surprising, and led to further investigation of
the importance of desalination in water purification for rural villages in India.
The interview findings were substantiated through literature review. In a user
study of water treatment and storage products completed in India by PATH Safe
Water Project, the most common reason for selecting a water source was the source's
perceived water quality, which is given by color, smell, taste, and temperature
[3].
Echenique and Seshagiri
[4]
surveyed 400 households in Hyderabad, India, asking
each to choose between five different options of water supply. Each option included a
different mixture of features (quality of water, quantity of water, duration of supply,
and flow rate) at different costs. The study found that users prioritize
improve-ments in water quality over other features and thus are more willing to pay for such
improvements.
TDS plays an important role in aesthetic (physical) quality. The taste quality
of water in regards to salt content was first described by W.H. Bruvold in 1969
(Table 1.1) where water with TDS less than 200 mg/L is rated as excellent
[5].
In
addition to causing poor taste, a study by Singh et. al.
[6]
showed that users in
India find saline water ineffective in quenching thirst and unsuitable for cooking.
It is because of both the potential health effects and acceptability concerns that
the Indian Standard for Drinking Water sets two limits in regards to salinity: the
acceptable limit for total dissolved solids is 500 mg/L because palatability decreases
and gastrointestinal irritation may occur in higher concentrations; the permissible
limit if no other source is available is 2000 mg/L
[7].
Potability
Excellent
Good
Fair
Poor
Unacceptable
TDS Value ( mg/L)
<
200
201-600 601-1000
1001-1300
>
1300
Table 1.1: Taste quality as a function of TDS
[5].
1.1.3
Brackish Groundwater as the Primary Drinking Water
Source
The National Drinking Water Supply Programme and the Accelerated Rural Water
Supply Programme (ARWSP) were launched in 1969 and 1971, respectively. Both
programs led to rapid expansion of water supply in rural areas. Over the course
of the next two decades, 1.2 million bore wells were dug and 17,000 piped water
supply schemes were provided
[8].
Groundwater wells were considered the least
expensive and easiest to replicate method of providing rural water supplies, while
avoiding the most important biological quality concerns. During the 1980s, India
joined the International Drinking Water Supply and Sanitation Decade with the
goal of providing safe drinking water to all villages
[9].
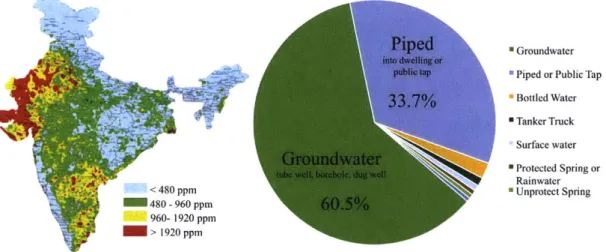
According to the 2015-2016 National Family Health Survey [10], over 60% of the
rural population in India uses some form of groundwater as their drinking water
source (Fig. 1-3, right). The percentage could be as high as 94%, given that some
portion of piped water also comes from a groundwater source, which is not tracked in
the survey. While the rapid expansion of wells in Indian villages brought about safer
drinking water sources in terms of biological quality, water quality testing received
little attention until the 1990s when issues of chemical contamination including
ar-senic, fluoride, nitrates, and brackishness (salinity) started to appear around the
country [9]. Analyzing maps created by the Central Groundwater Board of India
(Fig. 1-3, left), we see that salinity levels above the taste threshold (>500 mg/L)
underlie 60% of the land in India [11]. Along with the health effects associated with
high sodium intake, saline water is undesirable to users because of its poor taste, as
discussed in Section 1.1.2.
*-A <480 ppm 480 - 960 ppm 960- 1920 ppm C- > >1920 ppmPiped
into dwelling or public tap33.7%
Groundwater
tube well, borehole, dug well N
60.5%
" Groundwater * Piped or Public Tap
m Bottled Water m Tanker Truck Surface water * Protected Spring or Rainwater 0 Unprotect Spring
Figure 1-3: Percent distribution of rural households by primary source of drinking
water.
1.2
Design Requirements for a Village-Scale
Water-Treatment Plant
With the prevalence of groundwater salinity across India (>60% of the land area),
number of people using groundwater as their primary drinking water sources (>60%
of the rural population), and the effect that saline water appeared to have on
con-sumers' use of water treatment devices, it was prudent to look at desalination, in
additional to removal of biological contaminants.
The following system design requirements were elucidated though a combination
of technical literature review and engagement with end users, NGOs, manufacturers,
government officials, and industry leaders working directly in the Indian market.
Justification for each requirement is explored in greater depth in previous work [12].
1. Contaminant Removal: Biological and chemical contaminants reduced to levels
recommended by the WHO. Total dissolved salts (TDS) reduced to less than
500 mg/L.'
2. Daily Water Output: 6-15 m
3/day.
This range was based on an average water
requirement for adults in developing countries of 3 liters per person per day
[13, 141 and data from the Indian Census which revealed that the median
villager lives in a vilage of 2,000-4,999 people [1].
3. Recovery Ratio: Maximized. The recovery ratio of a desalination system is
defined as the ratio of product water volume to feed water volume. Having
15% of the world's population but only 6% of the world's water resources,
India is designated as a water-stressed country
[15].
In the regions of India that
require desalination, groundwater supply is also limited, and a high recovery
ratio means more efficient use of that limited water resource [12].
4. Energy Source: Grid and/or solar. During interviews with NGOs that have
installed rural water purification plants, it was discovered that the capacity of
the system has historically been sized from the number of hours of available
power each day
[16,
17]. For example, if a village needs a total of 6,000 liters per
day and power is available for 6 hours, then a 1,000 liter per hour (LPH) plant is
acceptable. However, if that same village only has access to power for 2 hours,
then a 3,000 liter per hour system is needed, greatly increasing the capital
cost-cost of installation. If grid power is not available, studies have shown that solar
power is the most cost-effective alternative in a village-scale system [18, 19].
The average solar irradiance received in India is 4-6 kWh/m
2/day,
where areas
of high solar resource tend to correspond to areas of high groundwater salinity
[12].
5. Maintenance: System able to be maintained in the field by a village operator
with limited technical training.
'Feedback from recent field pilots has suggested that the desired product TDS could be as low as 100 mg/L in some communities, especially where RO product water is already available.
6. Capital Cost: Desalination skid less than Rs 355,000 (~
$5,900). Reverse
os-mosis (RO) desalination plants designed and implemented by Tata Projects
were studied due to their history of economic sustainability on-grid. The
re-quirement given here is based on the cost of their 1,000 L/h on-grid RO plant
[16, 12].
This thesis focuses primarily on the final requirement by determining the
cost-optimal operating modes and stack architectures for electrodialysis, an existing
de-salination technology with the potential to be more effective than the existing
village-scale RO plants installed by Tata Projects in rural India.
1.3
Merits of Electrodialysis (ED) Desalination
ED is a membrane-based desalination technology used to treat approximately 425,000
m
3of brackish water (salinity <3,000 mg/L) daily [20]. While this accounts for only
6% of the total brackish water desalination capacity (86% is completed using reverse
osmosis (RO)) [20], the growing demand for low cost, low energy consuming,
high-recovery brackish water desalination solutions has created a renewed interest in ED
[12, 21, 22, 23, 24, 25].
In the ED process, saline water is circulated through a stack (Fig.1-4)
contain-ing a series of alternatcontain-ing anion exchange membranes (AEM) and cation exchange
membranes (CEM) between two electrodes. When an electric potential difference is
applied across the stack, anions are drawn towards the anode, and cations towards
the cathode. AEMs only pass anions, while the CEMs only pass cations, therefore
generating alternating channels of diluate and concentrate.
Our previous work compared ED to other potential desalination technologies
including reverse osmosis (RO) [12]. Reverse osmosis is a technology that uses an
applied pressure greater than the osmotic pressure of the feed stream to move water
Feed Water
4
4e
e
*
/
1
Cathode Anode\
I
Diluate Concentrate One Cell Pair "Product" "Waste""Brine"
Figure 1-4: Electrodialysis (ED) is the process of drawing ions out of a feed solution
by applying an electric potential across a series of alternating anion (AEM) and
cation (CEM) exchange membranes.
through a semi-permeable membrane. The applied pressure forces water to move in
the opposite direction of the natural flow that occurs in osmosis. Strathmann (1981)
compared the process costs ($/m
3) of installed large-scale ED and RO plants and
found that ED is more cost effective than RO for feed water salinities less than 5,000
mg/L [26]. As changing component costs, operation modes, production rates, and
installation locations (among other factors) all affect the specific process cost, it is
difficult to pinpoint an exact cross-over salinity. Instead, we hypothesize that ED may
have a lower specific cost for the village-scale (6-15 m
3/day) systems of interest here,
considering the specific energy consumption, recovery, and maintenance, relative to
the village-scale RO plants currently installed in India, and thus is worthy of further
investigation.
An initial analysis showed that throughout the range of groundwater salinity
found in India, and at the 1000 L/h size scale, ED was expected to require anywhere
from 25-70% less specific energy (kWh/m
3) than the RO systems currently operating
in rural India [12]. For the village-scale RO plants we visited, the applied pressure
was 5-13 bar above the osmotic pressure of the brine stream. Although the brine
stream leaves the membrane at a pressure over the osmotic pressure, which could be
recovered using an energy recovery device (ERD), the stream has a flow rate and
pressure that are too small for the energy savings to make up for the capital
invest-ment of currently available ERDs [161. This, in combination with the low efficiency
(0.20<rlpump<0.40)
of small pumps in general, and the local pumps in particular,
increases the specific energy consumption of RO for small-scale brackish water
de-salination in comparison to larger-scale systems. While ED systems also require
pumps to circulate the diluate and concentration streams (and thus are affected by
the poor pump efficiency at this size scale), ED systems operate at lower pressures.
Additionally, pumping is only part of the energy consumption in ED, as ion transfer
is driven by the application of current.
In addition, the RO membrane modules are currently being replaced every 3-5
years, whereas ED membranes used for brackish water desalination typically last
10+ years in the field, resulting in fewer visits by highly trained technicians.
Pre-treatment costs are also typically lower for an ED system than an RO system, as ED
can run successfully with higher levels of chlorine and turbidity in the feed water.
Finally, ED systems typically operate at higher recoveries than that observed at the
rural RO plants we visited (60-95% vs. 30-60%) with the exact value dependent on
the composition of the feed water in both cases.
2All of these considerations led to
the hypothesis that ED has the potential to reduce the cost, energy, and water waste
2
Note that a recovery of 30-60% is atypical for larger scale brackish water RO plants which frequently operate with a recovery between 70 and 90%.
as compared to the existing village-scale RO plants.
Finally, we note that a desalination system could include multiple technologies,
for example ED could be used in combination with RO or nanofiltration (NF). As
described in Section 1.2, the desired product water concentration of our system
lies between 100 and 500 mg/L, depending on the local conditions and customer
demands. In an ED system, as the product water concentration decreases, it becomes
more expensive (both in terms of capital cost and energetic cost) to remove each
additional mole of salt, a relationship discussed further in Section 2.2.2. As a result,
it may be beneficial to design a hybrid ED-RO system in which the RO acts to
bring the product water to its final concentration and ED acts to concentrate the
brine, such as proposed by McGovern et al. [21, 27]. In this work we determine
the cost-optimal design of a desalination system that utilizes ED technology alone
and discuss the capital and operational cost ramifications of reducing the product
water salinity beyond 500 mg/L, saving both the optimization of village-scale RO
and hybridization of ED with RO or NF for future consideration.
1.4
Partner Organization: Tata Projects
In 2015, the Global Engineering and Research (GEAR) Lab at the Massachusetts
Institute of Technology (MIT) and Tata Projects (Tata) initiated a collaboration to
design village-scale, solar-powered desalination system for use in rural India. Tata's
Utility Services arm already provides a range of reverse osmosis (RO) and
ultrafiltra-tion (UF) water treatment plants in the same producultrafiltra-tion range of interest (typically
500-2000 L/h). As of May 2018, approximately 3000 plants had been installed across
India. Their most common plant is the 1000 L/h RO plant shown in Fig. 1-5.
Due to their capabilities as a large scale manufacturer and experience in the
Figure 1-5: Tata Projects, based in Hyderabad India, has installed approximately
3000 reverse osmosis system (shown here) and ultrafiltration plants across India.
keting, financing, distributing, and servicing of rural desalination plants, Tata serves
as a valuable partner for the further development of village-scale desalination systems
in India. It is through conversation with Tata that the baseline cost and desalination
targets (feed water of 2000 mg/L, product water of 200 mg/L) discussed
through-out this thesis were implemented. Additionally, Tata engineers have maintained and
operated the ED plant in Chelluru, India installed as part of this work.
1.5
Outline of thesis
Due to the prevalence of high salinity groundwater across the country, the proportion
of people using groundwater as their primary drinking water source, and the affect
that saline water has on consumers' use of water treatment devices, it was prudent to
look at desalination, in additional to removal of biological contaminants for
village-scale water treatment in India. ED was hypothesized to have a number of merits
over the existing village-scale RO plants in terms of specific energy consumption,
total cost, water recovery, and maintenance and was thus chosen as the desalination
strategy with which to move forward.
This thesis proposes methods of reducing the cost of electrodialysis brackish water
desalination systems. An outline of the thesis is as follows:
" Chapter 2: Robust Analytical Model of Electrodialysis with
Exper-imental Validation
A model with prediction of the desalination rate, limiting current density, and
total energy use including pumping energy is presented and validated against
experimental data collected on ED stacks at two different size scales in a
lab-oratory and in an Indian village.
" Chapter 3: Cost-Optimal Design and Operation
The Pareto-optimal design of ED systems targeting a production rate of 1000
L/h, feed concentration of 2000 mg/L and product concentration of 200 mg/L
are explored for five different operating modes.
" Chapter 4: Design of Spiral-Wound Electrodialysis Modules
Learnings from the optimization study are used to develop a new stack
archi-tecture that would allow for local matching of the applied and limiting current
densities in a continuous, constant voltage system.
" Chapter 5: Conclusions
The results of the thesis are summarized and connected, and suggestions for
future work are outlined.
Bibliography
[1]
Datanet India Pvt. Ltd. Indiastat.com: Revealing India-Statistically: State-wise
Distribution of Inhabited Villages According to Population of India (Accessed
11/10/13).
[2] United Nations. The Millenium Development Goals Report 2013. Technical
report, 2013.
[3] User Testing of Household Water Treatment and Storage Products in Andhra
Pradesh, India. Technical report, Program for Appropriate Technology in Health
(PATH), 2011.
[4]
Marcial Echenique and Raghavendra Seshagiri. Attribute-based willingness to
pay for improved water services: a developing country application. Environment
and Planning B: Planning and Design, 36(3):384-397, 2009.
[5]
William H. Bruvold. Mineral taste and the potability of domestic water. Water
Research, 4(5):331-340, May 1970.
[6]
Nandita Singh, Prosun Bhattacharya, Gunnar Jacks, and Jan-Erik Gustafsson.
Women and Modern Domestic Water Supply Systems: Need for a Holistic
Per-spective. Water Resources Management, 18(3):237-248, June 2004.
[71
Bureau of Indian Standards. Drinking Water
-
Specification (Second Revision:
IS 10500). ISO 10500, 2012.
[8] Indira Khurana and Romit Sen. Drinking water quality in rural India : Issues
[9] R. V. Rama Mohan. Rural Water Supply in India: Trends in Institutionalizing
People's Participation. Water International, 28(4):442-453, December 2003.
[10]
International Institute for Population Sciences (IIPS) and ICF. National Family
Health Survey (NFHS-4), 2015-2016: India. Mumbai: IIPS. Technical report,
2017.
[11]
Central Ground Water Board. Ground Water Quality in Shallow Aquifers of
India. Technical report, Government of India, 2010.
[12] Natasha C. Wright and Amos G. Winter V. Justification for community-scale
photovoltaic-powered electrodialysis desalination systems for inland rural
vil-lages in India. Desalination, 352:82-91, 2014.
[13]
Peter H. Gleick. Basic Water Requirements for Human Activities: Meeting
Basic Needs. Water International, 21(2):83-92, June 1996.
[14] Guy Howard and Jamie Bartram. Domestic Water Quantity, Service Level and
Health. Technical report, World Health Organization, Geneva, 2003.
[15] Igor S. Zektser and Everett G. Lorne. Groundwater Resources Of The World
and Their Use. Technical report, UNESCO, Paris, 2004.
[16] Anand Kumar. Personal Conversation with Mr. Anand Kumar, Tata Projects
Water Purification Plant Development Center, Secunderabad, India. January
2014.
117]
Sumantra Mitra. Personal Conversation with Mr. Sumanta Mitra, Safe Water
Network Head of Operations, Warangal, India. August 2013.
[18] Tinu Abraham and Amit Luthra. Socio-economic & Technical Assessment of
Photovoltaic Powered Membrane Desalination Processes for India. Desalination,
268(1-3):238-248, 2011.
[191 Amy M. Bilton, Richard Wiesman, A.F.M. Arif, Syed M. Zubair, and Steven
Dubowsky.
On the feasibility of community-scale photovoltaic-powered
re-verse osmosis desalination systems for remote locations. Renewable Energy,
36(12):3246-3256, December 2011.
[201 Desaldata. Analysis, 2017.
[21] Ronan K. McGovern, Syed M. Zubair, and John H. Lienhard V. The cost
effectiveness of electrodialysis for diverse salinity applications. Desalination,
348:57-65, 2014.
[22] Karim M. Chehayeb, Daniel M. Farhat, Kishor G. Nayar, and John H. Lienhard
V. Optimal design and operation of electrodialysis for brackish-water
desalina-tion and for high-salinity brine concentradesalina-tion. Desalinadesalina-tion, 420:167-182, 2017.
[231
Kishor G. Nayar, P. Sundararaman, J. D. Schacherl, C. L. O'Connor, Michael L.
Heath, Mario 0. Gabriel, Sahil R. Shah, Natasha C. Wright, and Amos G
Winter V. Feasibility Study of an Electrodialysis System for In-Home Water
Desalination in Urban India. Development Engineering, 2:38-46, 2016.
[24] REvivED Water Consortium. Low energy solutions for drinking water
produc-tion by a revival of electrodialysis systems, 2016.
[25]
H. Strathmann. Electrodialysis, a mature technology with a multitude of new
applications. Desalination, 264(3):268-288, 2010.
[261 H. Strathmann. Membrane Separation Processes. Journal of Membrane Science,
9:121-189, 1981.
[27] Ronan K. McGovern, Syed M. Zubair, and John H. Lienhard V. The benefits of
hybridising electrodialysis with reverse osmosis. Journal of Membrane Science,
469:326-335, 2014.
Chapter 2
Robust Analytical Model of
Electrodialysis with Experimental
Validation
Contributors
This chapter was co-authored by Sahil R. Shah, Susan E. Amrose, and Amos G.
Winter V.
Abstract
This chapter presents a robust analytical model for brackish water desalination
us-ing electrodialysis (ED), with prediction of the desalination rate, limitus-ing current
density, and total energy use including pumping energy. Several simplifying
approxi-mations make the model easier to implement for simulation and design optimization
purposes. The predicted desalination rate, limiting current density, and total
en-ergy usage agree with measurements across two diverse ED stack designs, differing
in total membrane area (0.18 m
2,37.1 m
2),
membrane manufacturers (GE Water,
PCA GmbH), and flow channel spacers, thus demonstrating the model's
flexibil-ity. The commercial-scale stack was additionally tested with real groundwater in
Chelluru, India, demonstrating that brackish groundwater may be modeled as an
equivalent concentration NaCl solution. Sensitivity to the membrane diffusion
coef-ficient, area available for ion transport, level of discretization along the flow channel
length, boundary layer and membrane resistances, and water transport are analyzed
to guide empirical characterization when higher accuracy is required. No single
ex-isting model for pressure drop in the membrane spacers could accurately predict
pumping power in both stacks. One model for each stack was found to
reason-ably approximate pressure drop, however experimental validation of specific spacer
designs is recommended. The fully quantitative, parametric description of
electro-dialysis behavior presented here forms a useful tool to design, evaluate, and optimize
ED systems, as required in Chapters 3 and 4.
2.1
Introduction: Limitation of Existing Models
There are several approaches to modeling ED systems that span from simple
polyno-mial correlations [1] and analytic derivations [2, 3] to computational fluid dynamics
(CFD) simulations [4, 5J. Simple correlations do not maintain fidelity over a broad
range of system configurations while CFD solutions have a high computational cost.
There is a need to predict desalination performance and pressure losses across the
wide variety of ED systems used in water treatment using models that are less
com-putationally intensive, in order to facilitate parametric design studies.
Several authors separately model the mass transfer [2, 6], limiting current density
[7,
8,
9], and pressure losses throughout the ED membrane stack
[10, 11, 12, 13, 14].
However, few authors have united all of these aspects into a single model. A combined
model is critical to develop a complete understanding of the behavior of an ED
system. For example, while increased linear flow velocity (obtained by increased flow
rate, thinner channels, or lower spacer void fractions) increases mass transfer rates
and raises the limiting current density, it also increases the pressure drop over the
stack, thereby increasing total energy consumption. Including these types of coupled
interactions improves the accuracy of the model as well as its usefulness as a tool to
design and optimize ED systems for performance, cost, and energy consumption.
Of the few models that do consider combined effects [15, 6, 3, 16], all rely on
em-pirically derived parameters that require experimental characterization of a specific
ED system prior to use of the model. In this chapter, I present further
experimen-tal validation of their work, and simplifying approximations that predict, with good
accuracy, the performance of stack configurations that deviate from those tested by
other authors.
2.2
Model description
This section describes three interdependent models to predict the desalination rate
and total energy consumption for the ED process described above. First, we use a
circuit analogy to model the rate of ion transfer (in the form of current) as a function
of the applied voltage and given diluate and concentrate concentrations, in Section
2.2.2. Next, Section 2.2.3 provides a mass transfer model to predict the concentration
along the ED stack as a function of current and time. The current and concentration
in the channels are interdependent, and therefore solved simultaneously. Lastly,
section 2.2.7 models the pressure drop over the ED stack as a function of geometric
properties and the flow rate in the channels. While this third model can be solved
independently, the desalination rate and maximum applied current depend on the
flow rate through the system. In order to estimate the flow rate for a given
stack-pump combination, or the pressure drop at a desired flow rate, and subsequently
understand the resulting energetic and desalination rate repercussions, it is prudent
to consider all three models simultaneously.
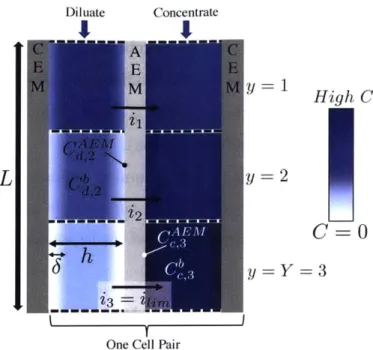
2.2.1
Variables and setup
We begin by considering the geometric and concentration variables for a single cell
pair (Fig. 2-1). Molar concentration is denoted by C, where the superscript denotes
the bulk,
Cb,the AEM surface,
CAEM,or the CEM surface,
CCEM.The first
sub-script defines the concentration as being either in the diluate or concentrate channel
(Cd
and Cc, respectively), and the second subscript denotes the lengthwise segment
of the channel, y. The segment of the channel provides discretization for modeling
purposes only; ED stacks are not physically segmented in this manner.
Cd
decreases in the direction of flow until the final segment, y
=
Y. The opposite
is true for Cc. Within any given segment (for example, y
=
2), the volume is
con-sidered small enough such that both the bulk and membrane surface concentrations
are assumed to be length-wise constant. When a voltage is applied, a
concentra-tion boundary layer of thickness 6 extends from the membrane surfaces, where the
concentration is CAEM/CEM, to the bulk, where the concentration is Cb
(Fig.
2-1).This model assumes that the same flow conditions exist in the diluate and
con-centrate channels. This is standard practice in commercial ED stacks to ensure that
the pressure difference across the membranes is negligible and does not contribute
Diluate
L
C
E M ConcentrateI
A E M i-C E My= High C y=Y=One Cell Pair
Figure 2-1: Description of key dimensions and notation.
to water transport. Both channels are the same dimensions and utilize the same
turbulence-promoting spacer. This model assumes that the feed water contains a
single 1:1 electrolyte. The extent to which it can be applied to solutions containing
divalent ions is discussed in 2.5.7.
2.2.2
Circuit analogy and current calculation
The ED stack is modeled as an analogous DC circuit whereby the voltage applied at
the electrodes
(Etotai),and the resulting current are related by
Etotai = Eei + NEmem + Ni
(R,
+ R, + R L + R AEM + RCEM), (2.1)where N is the number of cell pairs in the stack, and i is the per-segment current
density (A/M2). The area resistances RhY, R ,,, RBL, RAEM, and RCEM are
asso-C b
i2
h
i3
ciated with the bulk diluate and concentrate streams, the concentration boundary
layers lumped together, and the exchange membranes (AEM, CEM), respectively
(Q m
2).
Finally, Ei is the electrode potential difference and Eymem is the potential
across each membrane-pair (V). The subscript y refers to the segment of the stack
in all cases (Section 2.5.3 discusses discretization).
The total instantaneous current
(Itotai),
assuming uniform segmentation, is thesum of all current densities (iy), multiplied by the product of the segment length
(L/Y), width (W), and the open-area porosity of the turbulence-promoting channel
spacer
(OA)as given in Eq. 2.2.
WL L
total = OA ( y ) iy (2.2)
y==1
The area resistances in Eq. 3.16, and thus
Itotal,vary with concentration along
the length of the stack, and may also vary with time for unsteady operation, as is
the case for batch processes.
For desalination of pure sodium chloride, the reduction of hydrogen ions at the
cathode and the oxidation of chloride ions at the anode maintain a standard cell
potential of 1.4 V for the electrodes. The actual potential, which can be estimated
using the Nernst equation, is dependent on temperature and ion concentration. For a
standard ED stack, which typically contains more than 300 cell-pairs with each
con-tributing -1 V per cell pair, the electrode potential Ei is negligible. The remaining
terms in Eq. 3.16 are evaluated in the following sections.
Area resistances
The area resistances of the bulk and boundary layers
(R
,R
,,R
BL)can be found
relationship for the specific aqueous solution. The Onsager/Falkenhagen equation
for 1-1 electrolytes (Eq. 2.3) presents good agreement with experimental data over
a temperature range of 5-65
0C, and for solutions up to 30 g/L (Fig. 2-2)
[171.
Since we are specifically interested in modeling brackish water desalination, use of
the Onsager/Falkenhagen equation is justified for modeling the resistances of both
the diluate and brine channel. The equivalent conductance at the concentration of
interest is given by
AC = AO - (B1AO
2)+
B
V *O
(2.3)
1
+
Boav/C *10--3where C is the concentration of the solution (mol/m
3); a, B, B
1, and B
2are
unit-less empirically-determined coefficients dependent on the temperature of the solution
(Table 2.1), and Ao is the equivalent conductance at infinite dilution (temperature
and electrolyte dependent, Scm
2/mol).
For models in which the diluate channel
concentration is above 0.1 mol/L, we recommend the review of conductivity models
and their range of application prepared by De Diego et al. [18]. The resistivity, p (Q
m), of the solution at a concentration C is then
p =
.
(2.4)
The dominant resistance in brackish water desalination using ED is the resistance
of the diluate channels because resistivity increases sharply at low concentrations
(Fig. 2-3).
Resistivity is also temperature dependent; the resistivity at 30'C is
20% less than at 20
0C over the concentration range 0.5
-
50 mol/m
3. Therefore,
groundwater temperature variation with location or time may produce non-negligible
variation in resistivity.
130
- Onsager / Falkenhagen Equation -. 120 e Postler Experimental Data
110 100 90 80 70 0 20 40 60 80 100 120 Concentration, C [g/L]
Figure 2-2: The Onsager/Falkenhagen equation for predicting the molar conductivity
of aqueous NaCl at 25'C plotted with experimental measurements made by Postler
[19].
Good agreement is achieved at concentrations below 30 g/L. Light and dark
blue regions represent the typical concentration ranges seen in the diluate channel
(Cd
< 3 g/L) and concentrate channel (3
<
C, < 30 g/L), respectively.
50 -15 C 25'C 40 35*C 30 -4 20 10 0 0 0.5 1 1.5 2 2.5 3 Concentration, C [g/L]
Figure 2-3: Resistivity of an aqueous NaCl solution at varying concentrations and
temperatures. The resistivity of a fluid at 35'C is approximately 20% less than
that of a solution at the same concentration but at 25 C. Because groundwater
temperature varies significantly based on well location and depth to water table, it
may be necessary to account for site-specific temperature.
Table 2.1: Constants of the Onsager/Falkenhagen equation (Eq. 2.3) for the
equiva-lent conductance of electrolytes in water at various temperatures
[17].
Ao and a are
for NaCl specifically, while all other parameters are valid for all 1-1 electrolytes.
20
0C
25
0C
30
0C
40
0C
Bo
0.3276
0.3286
0.3297
0.3318
B
10.2269
0.2289
0.2311
0.2357
B253.48
60.32
67.54
82.97
Ao
113.76
126.45
140.11
168.2
a(A)
4
4
4
4
resistances in
R = p, (h -26),
(2.5)
R P ,(h
-26),
(2.6)
RBL = RdEM + RdEM - RAEM + RCEM, and
(2.7)
b, AEM)
R M dly
2
' 6.(2.8)
All four boundary layer resistances in Eq. 2.7 are evaluated as shown in Eq. 2.8,
which is specified for the diluate-AEM interface. The resistances are calculated using
a mean concentration, and approximate resistivity as varying linearly over small
concentration changes. Although the boundary layer resistance could be resolved
more accurately, a linear approximation is sufficient because the contributions of
the boundary layer resistances to the total resistance are small since 3 is small with
respect to the flow channel height (see Section 2.5.5).
Membrane resistances (RAEM,
RCEM)are often provided by the manufacturer.
However, these values are typically given at a single concentration while the effective
membrane resistance is known to change with concentration of the solution
contact-ing either side of the membrane [20]. The membrane resistance can be experimentally
determined as a function of concentration. Here, we make the simplification that it
is constant, provided that the diluate and concentrate concentrations being tested
are near the concentration at which the membrane was characterized.
Membrane potential
The potential associated with the concentration difference across the exchange
mem-branes
(Emm)
is the sum of contributions from the AEM (E
AEM)and the CEM
(E
CEM)given by
A (2tAEM - 1)RT cc0 AEM
EA = F log(YcAE
),
and
(2.9)
d,y
CEM (2tCEM - 1)RT ,cCEM
E - F l yoCCyEM)l