HAL Id: inserm-01155197
https://www.hal.inserm.fr/inserm-01155197
Submitted on 26 May 2015HAL is a multi-disciplinary open access
archive for the deposit and dissemination of sci-entific research documents, whether they are pub-lished or not. The documents may come from teaching and research institutions in France or
L’archive ouverte pluridisciplinaire HAL, est destinée au dépôt et à la diffusion de documents scientifiques de niveau recherche, publiés ou non, émanant des établissements d’enseignement et de recherche français ou étrangers, des laboratoires
Socioeconomic position across the lifecourse: how does
it relate to cognitive function in mid-life?
Archana Singh-Manoux, Marcus Richards, Michael Marmot
To cite this version:
Archana Singh-Manoux, Marcus Richards, Michael Marmot. Socioeconomic position across the life-course: how does it relate to cognitive function in mid-life?. Annals of Epidemiology, Elsevier Masson, 2005, 15 (8), pp.572-8. �10.1016/j.annepidem.2004.10.007�. �inserm-01155197�
Socioeconomic position across the lifecourse: How does it relate to cognitive function in mid-life? Archana Singh-Manoux*1,2 PhD Marcus Richards2 PhD Michael Marmot1 FRCP 1
International Centre for Health and Society Department of Epidemiology and Public Health University College London
1-19 Torrington Place; London WC1E 6BT, U. K.
*2
INSERM, Unit 88
National Institute of Health and Medical Research HNSM, 14 rue du Val d’Osne
94415 Saint-Maurice Cedex, France
3
MRC National Survey of Health and Development
Department of Epidemiology and Public Health, University College London *Corresponding author & address
Email: [email protected]
Email: [email protected]
Tel : 33-(0)1- 45 18 38 63 Fax : 33-(0)1- 45 18 38 89
ABSTRACT
Purpose: To examine the association between socioeconomic position (SEP) over the lifecourse
and cognitive function in middle age. Two alternative models were assessed: the ‘direct effects model, where temporally distinct measures of SEP have only direct effects on adult cognition, and the ‘indirect effects’ model where the effect of early life SEP are mediated through later life measures of SEP.
Methods: Data are from the Whitehall II study (N=10,308 at baseline), a longitudinal cohort
study of British civil servants, aged between 46 to 68 years at the time of cognitive testing. Structural equation models were used to compare the fit of direct and indirect effects models, and quantify the effects of different measures of SEP on cognition. Childhood SEP, education and adult SEP were used to model SEP across the lifecourse. Cognitive function was assessed as a latent construct composed of the following: verbal memory, AH 4-I, Mill Hill, phonemic and semantic fluency.
Results: The indirect effects model provided a better fit to the data. Childhood SEP had no direct
effect on cognitive function but had a substantial ‘indirect effect’, mediated through education and adult SEP. 78.4% of the effect of education in men and 100% in women was indirect. Conclusions: Socioeconomic differences in adult cognition are a result of the socioeconomic
trajectory of individuals throughout their lifecourse. Early measures of SEP influence cognition indirectly, through their influence on later measures of SEP.
Key words: lifecourse, childhood SEP, direct and indirect effects, cognitive function, health
List of abbreviations
SEP: socioeconomic position AH 4-I: Alice Heim 4-I
SEM: structural equation modeling
RMSEA: root mean square error of approximation CFI: comparative fit index
Investigation into the impact of socioeconomic factors on cognitive function is crucial for two reasons. First, research suggests that the social environment moderates the expression of genetic dispositions, with heritability ceasing to be important in poor environmental conditions.1 Moreover, adverse biological factors like low birth weight are more important for cognition under adverse socioeconomic circumstances.2,3 Second, low socioeconomic position (SEP) is related to cognitive impairment/dementia in old age,4,5 making it, along with age and pathology, one of the key predictors of age-related cognitive decline.4
Epidemiological research has widely linked SEP to various health and disease outcomes,6,7 showing measures of SEP from childhood and adulthood to make unique
contributions to health outcomes.8,9 The same holds for adult cognitive ability.10,11,12 However, the true association between socioeconomic factors and cognition, or any other health outcome, is likely to be underestimated in regression-type analyses which model different measures of SEP as being independent of each other. We estimate the extent of this underestimation, using structural equation models, by comparing two alternate models: the ‘direct effects’ and the ‘indirect effects’ model. A ‘direct effects’ model provides estimates of the effect of each measure of SEP
independently of other measures of SEP. The ‘indirect effects’ model also estimates effects of different measures of SEP that arise out of the interrelationship between these variables.13 In effect, the ‘indirect effects’ model suggests that the influence of early life measures of SEP on adult cognitive function is mediated through later life measures of SEP.
METHOD
Study Population
The Whitehall II study was established in 1985 as a longitudinal study to examine the socioeconomic gradient in health and disease among 10,308 civil servants (6,895 men and 3,413 women).14 All civil servants aged 35-55 years in 20 London based departments were invited to
participate by letter. In total, 73 % of those invited agreed to take part in Phase 1. Baseline examination (Phase 1) took place during 1985-1988, and involved a clinical examination and a self-administered questionnaire containing sections on demographic characteristics, health, lifestyle factors, work characteristics, social support and life events. Clinical examination
included measures of blood pressure, anthropometry, biochemical measurements, neuroendocrine function, and subclinical markers of cardiovascular disease. Subsequent phases of data collection have alternated between postal questionnaire alone and postal questionnaire accompanied by a screening examination. Since baseline screening five phases of data collection rounds have been completed, with the most recent phase of data collection (Phase 6) completed in 2001. A battery of cognitive tests was administered at Phase 5 (1997-1999), with 7,830 individuals participating. Measurement of Socioeconomic position
SEP in childhood was conceptualized as a latent variable measured via four indicators. These were: Mother’s education, assessed through the question – “How old was your mother when she finished full-time education?” Father’s education, assessed through the question – “How old was your father when he finished full-time education?” Father’s social class, assessed through registrar general social class which was recoded on a 6 point scale, 1 denoting low SEP and 6 denoting high SEP. Finally, an indicator of Financial circumstances in childhood was composed out of four items: father/mother unemployed when they wanted to be working, family had continuing financial problems, family did not have an inside toilet, and family did not have a car. Participants responded on a yes/no scale and the “NO” responses were summed so that a high score indicated good financial circumstances in childhood.
SEP in early adulthood was assessed via education. Education was measured as the highest level of education achieved, with the respondent choosing one of 11 categories in the questionnaire. This was regrouped into five standard hierarchic levels: (1) no formal education,
(2) lower secondary education, (3) higher secondary education, (4) university degree, (5) higher university degree.
Adult SEP was conceptualized as a latent construct assessed through measures of occupation and income. Occupation: Occupational position was assessed via civil service employment grade. All jobs in the civil service have a grade of employment. Employment grade of participants included in this study ranges from grade 1 to grade 6, with grade 1 representing the highest level and grade 6 the lowest. People in different grades differ with respect to salary, social status and level of responsibility. For analyses presented in this paper employment grade has been recoded so that 6 represents high grade and 1 represents low grade. Income was
assessed via a question that asked respondents to pick a category that corresponded most closely with their annual personal income (“amount received annually from salary or wages, or pensions, benefits and allowances before deduction of tax”). There were 8 categories, ranging from “less than £9,999” to “more than £70,000”. For the purposes of analysis the two highest and the two lowest personal income categories were collapsed to leave 6 categories. These categories are as follows, 6 = ≥ £50,000; 5 = £35,000 - £49,999; 4 = £25,000 - £34,999; 3 = £20,000 - £24,999; 2 = £15,000 - £19,999; and 1 = ≤£14,999.
Cognitive function in middle age
Cognitive function was conceptualized as a latent construct, composed of the following five standard tests.
Verbal memory test was assessed by a 20-word free recall test of short term memory. Participants were presented a list of 20 one or two syllable words at two-second intervals and were then asked to recall in writing as many of the words in any order within two minutes to do so.
The AH 4-I15 is composed of a series of 65 items – 32 verbal and 33 mathematical reasoning items of increasing difficulty. This is a test of inductive reasoning that measures the ability to identify patterns and infer principles and rules. Participants had 10 minutes to complete this section.
The Mill Hill Vocabulary test16 assesses knowledge of verbal meaning and encompasses the ability to recognize and comprehend words. We used the test in its multiple format, which consists of a list of 33 stimulus words ordered by increasing difficulty, and six response choices per word.
Two measures of verbal fluency: phonemic and semantic.17 Phonemic fluency was
assessed via "S" words and semantic fluency via "animal" words. Subjects were asked to recall in writing as many words beginning with “S” and as many animal names as they could. One minute was allowed for each test.
Statistical methods
Structural equation modeling (SEM) was used to analyze data as it allows the modeling of both direct and indirect effects (Figure 1). All observed variables are enclosed in boxes, and unobserved variables in ellipses. The unobserved variables are latent constructs and error terms. Error terms are associated with all endogenous variables and represent measurement error along with effects of variables not measured in the study. The elaboration of latent variables involves setting up measurement models, by specifying the indicators of the latent constructs and
assessing their reliability. Specification of the measurement model resembles confirmatory factor analysis in that the indicators used to define the latent construct are theoretically driven. The appropriateness of the measurement model involves examination of the statistical significance of each factor loading and calculation of the composite reliability. Composite reliability is a
measure of the internal consistency of the indicators, depicting the extent to which they indicate the common latent construct.18 Composite reliability of around 0.70 is seen to be an acceptable.
Childhood SEP (Figure 1) is earliest measure of lifecourse SEP in our model. It is modeled as having a direct effect on cognitive function through the path d and an indirect effect through the following paths: eh, egi, and fi (Figure 1). Education has a direct effect h, and an indirect effect gi on cognitive function. Adult SEP, the last measure of SEP in the lifecourse, is modeled as having only a direct effect i. The correlations between age and different measures of SEP are represented by x, y, and z. The effect of age on cognitive ability was modeled through k.
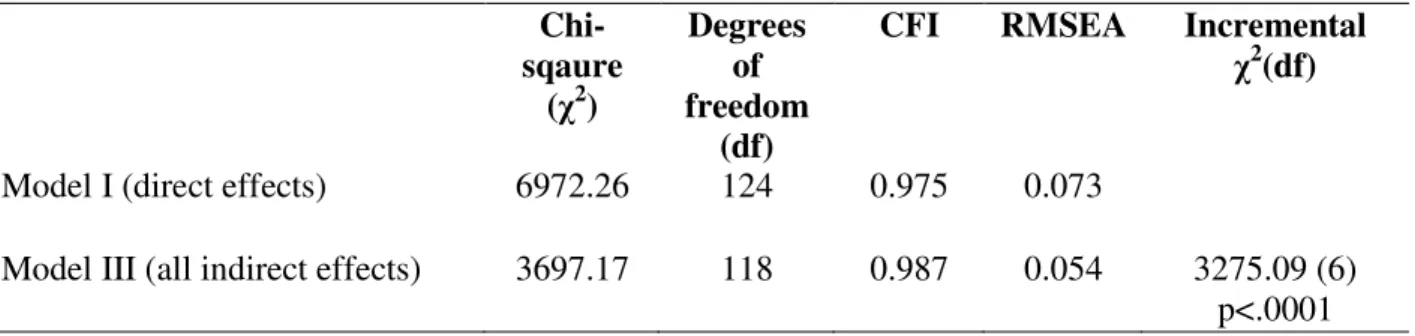
The first step of the analysis consisted of examining two alternative models: all indirect paths (e, f and g) were constrained to be 0 in Model I (direct effects model) while Model II (indirect effects model) had no constraints. The χ2 test was used to assess whether Model II provided a better fit compared to Model I. The next step involved quantification of the effects and testing sex differences using multigroup analysis in a two step procedure. First, the models were estimated separately for men and women and then the analysis was repeated with the pathways in the two groups constrained to be equal in men and women. Post-hoc comparisons in model fit were used to identify which parameters differed significantly between men and women.
The analysis was carried out using AMOS version 4.01.19 Model fit was assessed using multiple criteria as the χ2 statistic is overly sensitive to model misspecification when the sample sizes large. We used root mean square error of approximation (RMSEA) and comparative fit index (CFI) to assess model fit. An RMSEA value close to zero and a CFI value close to 1 indicates a good fitting model (Mueller, 1996).20 The AMOS program allows maximum
likelihood estimation based on incomplete data, known as full-information maximum likelihood (FIML). This approach is based on the direct maximization of the likelihood of all observed data, not just from cases with complete data. FIML is preferable to estimation based on complete data
(the listwise deletion approach) as FIML estimates will show less bias and be more reliable than the listwise deletion approach even when data deviate from missing at random and are non-ignorable (Arbuckle, 1996).21 The results were checked using asymptotically distribution free methods (as some of the data are not normally distributed) and similar results to FIML were found.
RESULTS
66% of the original sample, excluding deaths, were seen for the clinical examination at Phase 5. The loss to follow-up is not influenced by age (p=0.44) or sex (p=0.43), but is
influenced by employment grade (p<0.01), with the attrition rate being significantly higher in the lower socioeconomic group.
Factor loadings for the latent construct childhood SEP were as follows - mother’s education: 0.55 (p<.001), father’s education: 0.74 (p<.001), father’s social class: 0.46 (p<.001), and financial circumstances in childhood: 0.36 (p<.001). The internal consistency was 0.61. Adult SEP had an internal consistency of 0.82, the factor loadings were 0.92 (p<.001) for occupation and .72 (p<.001) for income. The latent construct cognitive function had an internal consistency of 0.73; factor loadings were as follows: memory: 0.54 (p<.001), AH 4-I: 0.84 (p<.001), Mill Hill: 0.77 (p<.001), phonemic fluency: 0.75 (p<.001), semantic fluency: 0.82 (p<.001).
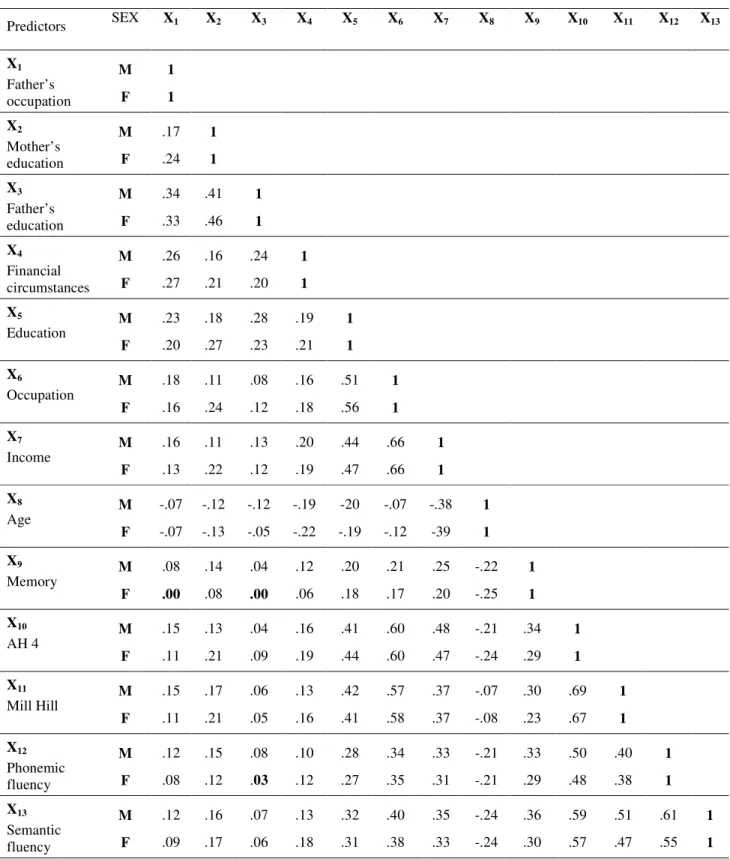
The bivariate correlations between the different measures of SEP and cognitive ability are shown in Table 1. Mother’s education (among the measures of childhood SEP) and occupational position (among the measures of adult SEP) show stronger associations with cognitive ability in midlife. The measures of SEP were all significantly related to each other. Table 2 shows the goodness of fit statistics associated with Models I and II. Results show Model II, the indirect effects model, to be a better fitting model.
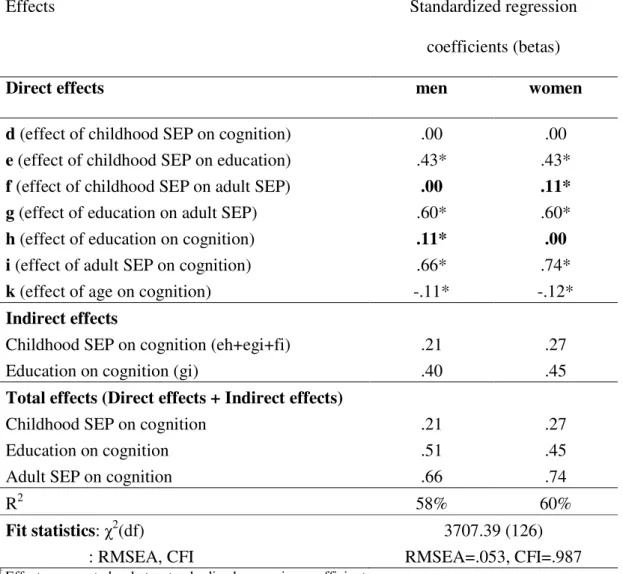
Table 3 presents direct, indirect and total effects of the different measures of SEP. All effects are reported using standardized regression coefficients, also known as “betas”. These coefficients are calculated from standardized data and reflect the impact on the outcome variable of a change of 1 standard deviation in the predictor variables. For example, an increase of one standard deviation in adult SEP is associated with an increase of 0.66 standard deviation in cognition in men (path i, Table 3). The advantage of standardized regression coefficient is that it allows assessment of the relative importance of different predictor variables. Following the power primer by Cohen (1992) the effect sizes of the parameter estimates can be seen to be small (β = .10), medium (β = .30), and large (β = .50).22
As is clear from Table 3 there were no direct effects of childhood SEP on cognition (path d, Table 3). However there were important indirect effects (eh + egi + fi). Good childhood socioeconomic circumstances were associated with better performance on cognitive tests, with 100% of this relationship in our data evident through the effect of childhood SEP on later measures of SEP. Education had significant, albeit small, direct effect on cognition only in men (path h, Table 3). The indirect effect (path gi, Table 3) are substantial in both men (β = .40) and women (β = .45). In fact, indirect effects of education account for 78.43% of the total effects in men and 100% in women. Adult SEP (path i, Table 3) had a large effect on cognition (men: β = .66; women: β = .74).
Table 3 also reveals gender differences in the relationship between childhood SEP and adult SEP (path f) and between education and cognitive function (path h). The impact of lifetime socioeconomic circumstances on cognitive abilities in adults was assessed with the R2
(percentage of variance explained) statistic. Table 3 shows this figure to be 58% in men and 60% in women.
DISCUSSION
The primary goal of this paper was to examine alternative models of the relationship between temporally distinct measures of SEP across the lifecourse and cognitive ability in middle age. Using alternative structural equation models we examined the ‘direct’ and ‘indirect’ effects models and found support for the ‘indirect effects’ model. Previous studies have shown measures of SEP from different time points in the lifecourse to have independent effects, or direct effects, on adult cognitive function.10,11,12. However, direct effects are meaningless when different measures of SEP are correlated with each other.23 Conclusions drawn from regression-type analyses attempting to identify the impact of different measures of SEP on cognition are likely to be biased as they do not take into account the interrelationship between the predictors.13
Results here suggest that socioeconomic circumstances in childhood have no ‘direct effect’ on adult cognitive function. However, this does not imply that socioeconomic
circumstances during a person’s childhood years are not important determinants of their cognitive ability. As the analyses show, social factors in childhood shape and circumscribe socioeconomic circumstances in adult life and their influence on cognitive function is mediated through later measures of SEP. Our results differ from earlier reports of the existence of independent effects of childhood socioeconomic factors on adult cognitive function.11,12 The papers reporting
independent effects of childhood SEP on adult cognitive abilities draw data from the same Finnish study - Kuopio Ischaemic Heart Disease Risk Factor Study. More research is required to understand whether there are cultural, cohort specific, or methodological explanations for these differing results, particularly as another paper using path analysis on the British 1946 birth cohort study also did not find a direct effect of childhood socioeconomic circumstances on adult
cognition.24 It is also possible that individual measures of childhood SEP, mother’s education for example, have effects on cognition that persist into adulthood. None of our individual measures
of childhood SEP, measures that are retrospective and self-reported, had a direct effecton adult cognition (results not shown) but better measures could show different results.
A major part of the effect of education on cognition in men and all of it in women is also indirect. In these data the influence of education on cognition is mostly through its influence on adult SEP, measured using occupation and income. The total impact of socioeconomic
circumstances on cognitive abilities, assessed by % of variance explained, is substantial. However, this does not question some genetic basis for adult cognition. In fact, there is some evidence to suggest that a quarter of the association between home environment and achievement could be explained by genetic factors.25 A summary of 140 familial studies found genetic
influences to account for approximately 50% of the total variance in cognition.26 The focus of this paper is the way in which the impact of socioeconomic factors on cognition is modelled. This has particular relevance for the health inequalities research. Socioeconomic position is a proxy for a range of factors that influence cognition: complexity of the work environment, social network, leisure pursuits, health behaviors, etc. The assumption underlying the investigation into the environmental determinants of cognition is that of neuronal plasticity, even in adulthood.27 This merits appropriate modeling of the impact of socioeconomic circumstances.
There are some caveats to the conclusions drawn in this study. First, the measures of childhood socioeconomic circumstances reported in this paper are retrospective, and are subject to a degree of recall bias. We have attempted to address this concern by using a range of variables to assess childhood SEP. Second, our results need to be interpreted in light of the fact that
Whitehall II is a study of white-collar workers and does not represent the whole socioeconomic spectrum. Furthermore, our analysis on missing data shows attrition rate to be higher amongst the disadvantaged groups in the study. As there appears to be an interaction between heritability of cognition and socioeconomic circumstances,1 restricting our analyses to cases with complete data
would perhaps have led to an overestimation of the effects assessed in this study. Our use of FIML approach to data analyses was guided by the non-randomness of missing data in the study, allowing us to represent fully low SEP within the Whitehall II study. Finally, it is likely that SEP influences different aspects of cognitive functioning differently, something that hasn’t been explored in this paper.
In conclusion, this study examined the impact of socioeconomic circumstances over the lifecourse on adult cognitive function. We used a logical, temporal model to reflect the influence of childhood SEP, education and adult SEP on cognition. Education and adult SEP were modeled separately as not only do they occupy different temporal space in the lifecourse,13 but also
represent different aspects of social circumstances.28,29 Our results suggest that socioeconomic circumstances influence adult cognitive ability through an indirect effects model rather than a direct effects model. The indirect effects model is viewed as being particularly important when the different predictors are correlated with each other. We conclude that interpretations based on direct effects models alone, particularly in terms of the influence of early life measures of SEP, are likely to underestimate their importance.
Acknowledgements
The Whitehall II study has been supported by grants from the Medical Research Council; British Heart Foundation; Health and Safety Executive; Department of Health; National Heart Lung and Blood Institute (HL36310), US, NIH: National Institute on Aging (AG13196), US, NIH; Agency for Health Care Policy Research (HS06516); and the John D and Catherine T MacArthur Foundation Research Networks on Successful Midlife Development and Socio-economic Status and Health. MM is supported by an MRC Research Professorship.
We also thank all participating civil service departments and their welfare, personnel, and establishment officers; the Occupational Health and Safety Agency; the Council of Civil Service Unions; all participating civil servants in the Whitehall II study; and all members of the Whitehall II study team.
References
1
Rowe DC, Jacobson KC, Van den Oord JCG. Genetic and environmental influences on vocabulary IQ: parental education as a moderator. Child Dev 1999; 70: 1151-1162. 2
Jefferies BJMH, Power C, Hertzman C. Birth weight, childhood socioeconomic environment, and cognitive development in the 1958 British birth cohort. BMJ 2000; 235: 305-308.
3
Sommerfelt K, Andersson HW, Sonnander K, Ahlsten G, Ellertsen B, Markestad T, et al. Cognitive development of term small for gestational age children at five years of age. Arch Dis Child 2000; 83: 25-30.
4
Holland CA, Rabbitt P. The course and causes of cognitive change with advancing age. Rev Clin Gerontol 1991; 1: 81-96.
5
Katzman, R. Education and the prevalence of dementia and Alzheimer's disease. Neurology 1993; 43: 13-20.
6
Davey Smith G, Bartley M, Blane D. The Black Report on socioeconomic inequalities 10 years on. BMJ 1990; 301: 373-377.
7
Townsend P, Davidson N, Whitehead M. Inequalities in health: The Black report and the health divide. London, UK: Penguin Books, 1992.
8
Kaplan GA, Salonen JT. Socioeconomic conditions in childhood and ischaemic heart disease during middle age. BMJ 1990; 301, 1121-1123.
9
van de Mheen H, Stronks K, Looman CWN, Mackenbach JP. Does childhood socioeconomic status influence adult health through behavioural factors? Int J Epidemiol 1998; 27: 431-437. 10
Alvarado BE, Zunzunegui M-V, Del Ser T, Beland F. Cognitive decline is related to education and occupation in a Spanish elderly cohort. Aging 2002; 14: 132-142.
11
Kaplan GA, Turrell G, Lynch JW, Everson SA, Helkala E-L, Salonen JT. Childhood
socioeconomic position and cognitive function in adulthood. Int J Epidemiol 2001; 30: 256-263. 12
Turrell G, Lynch JW, Kaplan GA, Everson SA, Helkala E-L, Kauhanen J, Salonen JT. Socioeconomic position across the lifecourse and cognitive function in late middle age. J Gerontol B Psychol Sci Soc Sci 2002; 57: 43-51.
13
Singh-Manoux A, Clarke P, Marmot M. Multiple Measures of Socioeconomic Position and Psychosocial Health: Proximal and Distal Effects. Int J Epidemiol 2002; 31: 1192-1199. 14
Marmot MG, Davey Smith G, Stansfeld S, Patel C, North F, Head J, et al. Health inequalities among British civil servants: the Whitehall II study. Lancet 1991; 337: 1387-1393.
15
Heim AW. AH 4 group test of general intelligence. Windsor, UK: NFER-Nelson Publishing Company Ltd, 1970.
16
Raven JC. Guide to using the Mill Hill vocabulary scale with progressive matrices. London, UK: H. K. Lewis, 1965.
17
Borkowski JG, Benton AL, Spreen O. Word fluency and brain damage. Neuropsychologia 1967; 5: 135-140.
18
Hair JF, Anderson RE, Tatham RL, Black WC. Multivariate data analysis. Upper Saddle River, NJ: Prentice-Hall, Inc., 1998.
19
Arbuckle JL, Wothke W. Amos 4.0 user's guide. Chicago: Small Waters Corp., 1995. 20
Mueller RO. Basic principles of structural equation modeling. New York: Springer Verlag, 1996.
21
Arbuckle JL Full-information estimation in the presence of incomplete data. In GA
Marcoulides, RE Schumacker (Eds.) Advances Structural equation modeling techniques (pp. 243-277). Mahwah, NJ: Lawrence Erlbaum Associates. 1996.
22
Cohen J. A power primer. Psychol Bull 1992; 112, 155-159. 23
Kaufman JS, Cooper RS. Seeking causal explanations in social epidemiology. Am J Epidemiol 1999; 150: 113-120.
24
Richards M, Sacker A. Lifetime antecedents of cognitive reserve. J Clin Exp Neuropsychol 2003; 25, 614-24.
25
Cleveland HH, Jacobson KC, Lipinski JJ, Rowe DC. Genetic and shared environmental contributions to the relationship between the home environment and child and adolescent achievement. Intelligence 2000; 28: 69-86.
26
Bouchard TJ Jr, McGue M. Familial studies of intelligence: a review. Science 1981; 212: 1055-1059.
27
Maguire EA, Gadian DG, Johnsrude IS, Good CD, Ashburner J, Frackowiak RS, Firth CD. Navigation-related structural change in the hippocampi of taxi drivers. Proc Natl Acad Sci USA. 2000; 97: 4398-4403.
28
Bartley M, Sacker A, Firth D, Fitzpatrick R. Understanding social variation in cardiovascular risk factors in women and men: the advantage of theoretically based measures. Soc Sci Med 1999; 49: 831-845
29
Gallacher JEJ, Elwood PC, Hopkinson C, Rabbitt PMA, Stollery BT, Sweetman PM, et al. Cognitive function in the Caerphilly study: Associations with age, social class, education and mood. Eur J Epidemiol 1999; 15: 161-169.
Table 1. Correlation matrix for relationship between life course SEP variables and cognitive
function in middle age.†
Predictors SEX X1 X2 X3 X4 X5 X6 X7 X8 X9 X10 X11 X12 X13 X1 Father’s occupation M F 1 1 X2 Mother’s education M F .17 .24 1 1 X3 Father’s education M F .34 .33 .41 .46 1 1 X4 Financial circumstances M F .26 .27 .16 .21 .24 .20 1 1 X5 Education M F .23 .20 .18 .27 .28 .23 .19 .21 1 1 X6 Occupation M F .18 .16 .11 .24 .08 .12 .16 .18 .51 .56 1 1 X7 Income M F .16 .13 .11 .22 .13 .12 .20 .19 .44 .47 .66 .66 1 1 X8 Age M F -.07 -.07 -.12 -.13 -.12 -.05 -.19 -.22 -20 -.19 -.07 -.12 -.38 -39 1 1 X9 Memory M F .08 .00 .14 .08 .04 .00 .12 .06 .20 .18 .21 .17 .25 .20 -.22 -.25 1 1 X10 AH 4 M F .15 .11 .13 .21 .04 .09 .16 .19 .41 .44 .60 .60 .48 .47 -.21 -.24 .34 .29 1 1 X11 Mill Hill M F .15 .11 .17 .21 .06 .05 .13 .16 .42 .41 .57 .58 .37 .37 -.07 -.08 .30 .23 .69 .67 1 1 X12 Phonemic fluency M F .12 .08 .15 .12 .08 .03 .10 .12 .28 .27 .34 .35 .33 .31 -.21 -.21 .33 .29 .50 .48 .40 .38 1 1 X13 Semantic fluency M F .12 .09 .16 .17 .07 .06 .13 .18 .32 .31 .40 .38 .35 .33 -.24 -.24 .36 .30 .59 .57 .51 .47 .61 .55 1 1
Table 2. Goodness of fit of nested structural equation models examining the influence of lifecourse SEP on adult cognition.
Chi-sqaure (χ2) Degrees of freedom (df)
CFI RMSEA Incremental
χ2(df)
Model I (direct effects) 6972.26 124 0.975 0.073
Model III (all indirect effects) 3697.17 118 0.987 0.054 3275.09 (6)
Table 3. The effect† of socioeconomic circumstances across the lifecourse on cognitive function.
Effects Standardized regression
coefficients (betas)
Direct effects men women
d (effect of childhood SEP on cognition) .00 .00
e (effect of childhood SEP on education) .43* .43*
f (effect of childhood SEP on adult SEP) .00 .11*
g (effect of education on adult SEP) .60* .60*
h (effect of education on cognition) .11* .00
i (effect of adult SEP on cognition) .66* .74*
k (effect of age on cognition) -.11* -.12*
Indirect effects
Childhood SEP on cognition (eh+egi+fi) .21 .27
Education on cognition (gi) .40 .45
Total effects (Direct effects + Indirect effects)
Childhood SEP on cognition .21 .27
Education on cognition .51 .45
Adult SEP on cognition .66 .74
R2 58% 60%
Fit statistics: χ2(df) : RMSEA, CFI
3707.39 (126) RMSEA=.053, CFI=.987
† Effect represented as beta, standardized regression coefficient.
*p<.0001 (Significance levels for direct effects alone). Significant sex differences are in bold.
Figure 1. Modeling socioeconomic circumstances over the lifecourse and cognitive function. Mother's education Education Adult SEP Occupation e7 Income e8 g e5 1 e6 Age Father's SEP Childhood SEP f e e2 e1 Financial difficulties in childhood Father's education e3 e4 Note
1. All observed variables are in boxes, unobserved variables and error terms (e1-e14) are in ellipses. 2. d, e, f, g, h and i represent standardized regression coefficients; x, y and z are correlation coefficients.
y z Cognition in middle age i AH 4-I Mill Hill e11 e12 e9 Memory Phonemic fluency Semantic fluency e10 e14 e13 k h d x