Design and Applications of a Soft X-Ray Detector using
GaAs Multiple Quantum Wells
by
Sumanth Kaushik
Submitted to the Department of Electrical Engineering and Computer Science
in partial fulfillment of the requirements for the degree of
Doctor of Philosophy
at the
MASSACHUSETTS INSTITUTE OF TECHNOLOGY
May 1994
©
Sumanth Kaushik, MCMXCIV. All rights reserved.
The author hereby grants to MIT permission to reproduce and to distribute copies
of this thesis document in whole or in part, and to grant others the right to do so.
Author ... ...
...
...
...
:...
Department of Electrical Engineering and Computer Science
March 10, 1994
Certified by
.
.
...
/...
...
Peter L. Hagelstein
Associate Professor
Thesis Supervisor
(-**I\I.
AAAccepted by...
.... . v , .. • -., h ,.v . ... , .. ... ...Frederic R. Morgenthaler
Chai man, Depart ental Committee on Graduate Students
WHDRAV-VN
FROM
r 0,0
ES
Design and Applications of a Soft X-Ray Detector using GaAs Multiple
Quantum Wells
by
Sumanth Kaushik
Submitted to the Department of Electrical Engineering and Computer Science on March 10, 1994, in partial fulfillment of the
requirements for the degree of Doctor of Philosophy
Abstract
This thesis focuses on two separate, but related problems. These are: (1) the design and applications of a novel quantum well based soft x-ray detector; (2) the study of absorption lineshapes in quantum confined systems.
Described in this thesis is a detector in the 70-500 eV range with spatial resolution of lpm - 5pm, temporal resolution of 20 ps, energy resolution of 85 eV and a sensitivity of 25 photons/pm2. The detector design is based on observing a change in the optical susceptibility in semiconductor multiple quantum well structures induced by the absorption of x-ray photons. Such a detector can play a potentially important role in plasma diagnostics and x-ray microscopy. The latter application is explored in depth.
The high resolution and sensitivity is achieved by adjusting the optical impedance of the detector to the optical probe beam so that the transmission in the absence of x-rays is negligible. The presence of free-carriers from the absorbed x-rays modifies the optical susceptibility in the vicinity of the exciton absorption lines causing the transmission to be significantly modified (over 10%), which is readily detectable.
The detector described in this thesis is optimized with respect to temperature and quantum well parameters using a semi-empirical lineshape model. The lineshape model is based on a conventional line-broadening analysis similar in spirit to that used in atomic and plasma physics in which line positions, oscillator strengths, energy and continuum shifts and broadening are described using a combination of theory and experiments. The lineshape model accurately describes absorption and optical nonlinearity as a function of temperature, free carrier density and quantum well quality.
Complementing this investigation of lineshapes using semi-empirical models, this thesis also investigates lineshapes from a theoretical viewpoint as well. Presented here are: (1) new analytical results and asymptotic scaling for the renormalization of the band gap in the presence of free carriers, (2) new analytical expressions for the exciton-phonon matrix element and (3) a new lineshape function that accurately describes both the Lorentzian and
non-Lorentzian features in the absorption lineshape such as the Urbach's rule. Thesis Supervisor: Peter L. Hagelstein
cle- aml cdriil
ýorw
qtrlo
Irr
ar
ýCNIC711
oitTm
my fo
ami
uly
Y
-tl
Acknowledgements
One might consider this thesis to be the written document summarizing my doctoral research here at MIT. However, to me, this thesis represents far more than a mere technical document. To me, this thesis represents the sum total of all that I have learned during my last 11 years at MIT. In this regard, I owe gratitude to a large number of inviduals for all their help and advice during the past decade.
I wish to thank a number of professors who have helped me in my studies. The foremost of them is of course Peter Hagelstein. He has has been more than merely my advisor, but has also been a good friend. He has taught me my most valuable lessons here at MIT. He has taught me the way to think. It is this, more than anything else, that I will carry with me for rest of my academic life.
I also wish to thank Profs. Hermann Haus and Louis Smullin. I am deeply indebted to Prof. Haus for assisting me in the admission to the graduate program, and for him and Prof. Smullin for keeping a watch over me during these last seven years. Finally, I wish to thank my readers Profs.
Q. Hu and M. Dresselhaus, who despite the short notice, critically read my thesis and provided
valuable suggestions and corrections.
My education here at MIT has of course been more than merely numbers, formulas and science. I have been blessed with the most interesting and amusing set of acquaintances - one might even call them friends - who have made these last ten years a most pleasant experience.
In this regard I wish to thank Robert Durie for "C"ing me through all the hard times. I wish him well in his medical resreach. I also wish to thank all those at [email protected] for all the good times. I hope they will not end upon my graduation.
I wish to thank my ex-roomies Gopalakrishna Rajagopal and Dinesh Gopinath. As they have helped me in my "path breaking" research, so will I try to help them in theirs.
I wish to thank my colleagues and friends Drs. Kevin Delin and John Moores who are both enjoying the rewards of an MIT Ph.D. I hope to be joining your ranks shortly. Kevin, as you have always advised, I have indeed graduated, but unfortunately, the balmy clime of Northern California doesn't appear in my cards. Additionally, members of the x-ray laser group: James G. Goodberlet, Mark Fleury, M. Muendel and Tim Savas have all provided useful insights and technical input at various stages in the thesis.
Three characters have produced me much food - both for the belly, as well as for the mind. They are of course Sankar Sunder, Saligrama R. Venkatesh and Pradeep Sreekanthan. I wish Sankar well in his collaborative investigations of economics and Carnatic music. I hope to win all my bets in the near future. I wish SRV well in his effort to build his cherished hamlet. I hope Pradeep is successful in his mastery of plucked string instruments.
I of course cannot forget Drs. Coimbatore S. Venkatrishnan and Suresh "Taxman" Jagannathan. I thank them for all their "pondification" (as they would say in Konga-land) over the years. For SJ, I bid him a fond "Aloha" and wish him well in engineering various exemptions for his future tax returns. For CSV, I wish him all the best in his own quest for a fulfilling tax experience.
Contents
1 Introduction
1.1 Description of Problem ... 1.1.1 Nature of X-Ray Source ... 1.1.2 Detection Problem ... 1.1.3 Quantum Well Detectors ... 1.2 Principal Results in this Thesis ...
1.2.1 Lineshape Theory ...
1.2.1.1 Semi-Empirical Lineshape Theory 1.2.1.2 Theoretical Lineshape Studies .. 1.3 Organization of Thesis ...
2 Properties of Soft X-Rays
2.1 Soft X-Ray Spectrum ... 2.2 Soft X-Ray Sources ...
2.3 Propagation of Soft X-Rays in Media . . . .
2.4 Soft X-Ray Optics ...
3 X-Ray Detector Technology
3.1 Physics of X-Ray Detection ... 3.2 Resume of Detector Performance ...
3.2.1 Proportional Counter ... 3.2.2 Microchannei Plates ...
3.2.3 Semiconductor Detectors and CCD Arrays 3.3 Sum m ary ...
4 Semi-Empirical Lineshape Model for GaAs Quani 4.1 Introduction ... 4.2 Absorption Model ... 4.2.1 Oscillator Strengths . ... 14 . . . . 15 . . . . 15 . . . . 16 . . . . 17 . . . . 19 . . . . 20 . . . . . 2 1 . . . . . 2 1 . . . . 2 1 23 . . . . 23 . . . . 24 . . . . . 26 . . . . 27 32 . . . . 32 . . . . 33 . . . . 33 . . . . 36 . . . . . 38 . . . . 39
4.2.1.1 Oscillator Strength Model . ... 4.2.1.2 Density Dependence of Oscillator Strengths ... 4.2.2 Exciton and Confinement Energies . ... 4.2.3 Lineshape Function ...
4.2.3.1 Homogeneous Broadening: Phenomenological Treatment 4.2.3.2 Fluctuations in Quantum Well Widths ...
4.2.4 Energy Shifts in Electron-Hole Plasma: Basic Phenomenology . 4.2.4.1 Band Gap Renormalization . . ...
4.2.4.2 Renormalization of Exciton Energies ... 4.3 R esults . . . .
5 Optical Nonlinearity in Quantum Wells
5.1 Optical Nonlinearity and Temperature . . ...
5.2 Optical Nonlinearity and Linewidths . . . ...
6 Quantum Well Soft X-Ray Detector
6.1 Introduction ... ...
6.2 D esign Issues . . . . .... . . . .
6.2.1 Carrier Generation and Dynamics . . . .
6.2.2 Modeling of Optical Susceptibility . . . .
6.2.3 Beam Propagation in Quantum Well Stack . . . .
6.3 Results and Discussion ...
6.3.1 Sensitivity .. ... . .. .... .. .. .. ... .
6.3.2 Temporal Resolution . . . ... ... . ...
6.3.3 Energy Resolution ... 6.4 Discussion and Summary ...
7 Beyond the Semi-Empirical Lineshape Theory
7.1 Introduction . . . . 7.2 Bandgap Renormalization in Quantum Wells . . . .
7.2.1 Introduction ...
7.2.2 Electron Self-Energy in the SPP model . . . . 7.2.3 Algebraic Approximation to the SPP Integral . . .
7.2.4 Physical Content of Scaling Variables . . . . 7.2.5 Approximate Asymptotic Behavior of Self Energy 7.2.6 Possible Extension to Quasi-2D Systems ... 7.3 Lineshape Theory ...
7.3.1 Theoretical Lineshape Theory for Quantum Wells
92 . . . . 92 . . . . . 93 . . . . 93 . . . . . 95 . . . . . 96 . . . . . 98 . . . . . 100 . . . . . 101 . . . . 103 . . . . 104 70 70 71 74 75 79 80
7.3.1.1 Electron-Phonon Hamiltonian . . . .. 7.3.2 An Analytical Solution of the 2D Exciton-Phonon Matrix Element
7.3.2.1 Derivation ... ...
7.3.2.2 Specialization to 2D Phonon Matrix Element Problem . 7.3.3 New Lineshape Function ...
7.3.3.1 Evaluation of Green's Function: Cluster Expansion . . .
7.3.3.2 Key Observation ...
7.3.3.3 Factorization of G(t) . . . . . 7.3.3.4 Approximate Solution of fi(E)
7.3.3.5 Asymptotic Behavior of fl(E)
7.3.3.6 Solution for f2(E) ...
7.3.4 Discussion and Summary ...
. . . . 114 . . . . . 115 . . . . . 116 . . . . . 116 . . . . 118 . . . . 118
8 Future Research Directions 8.1 Soft X-Ray Detector ... 8.1.1 Detector Fabrication ... 8.1.2 X-Ray M icroscopy ... 8.1.2.1 Introduction ... 8.1.2.2 A New Scanning Microscope . . . . 8.2 Lineshape Theory . . . . 8.3 Opto-Electronic Memory . . . . 8.3.1 M etastability . . . .. . . . . 8.3.2 Metastable States in Semiconductor Heterostructures . . . . 8.3.2.1 Metastability in One Dimension . . . . 8.3.2.2 Application of Quantum Well Technology . . . . 8.3.3 Principal Issues and Challenges . . . . 8.3.3.1 Calculation of Energy Levels and Matrix Elements . 8.3.3.2 Lineshape and Linewidths . . . . 8.3.3.3 Quantum Yield ... 8.3.3.4 Device Application ... 8.3.4 Sum m ary . . . .. . . . .. . . . . 9 Conclusions 9.1 Soft X-Ray Detector ... 9.2 Lineshape Studies ... 9.2.1 Semi-Empirical Lineshape Model . . . 9.2.2 Theoretical Lineshape Studies ... 136 . . . . 136 . . . . 136 . . . . 137 . . . . . 138 104 105 106 108 110 113 121 . . . . 121 . . . . 121 .... 122 ... . 122 ... . 123 ... . 126 . . . . 127 .... 128 . . . . 130 ... . 130 ... . 132 ... . 133 ... . 133 ... . 134 .... 134 ... . 135 .... 135
9.2.2.1 Bandgap Renormalization . . ... .. .. . 138 9.2.2.2 Non-Lorenztian Lineshapes of Excitons in Quantum Wells 139
A Approximation of Exchange and Correlation Energy Integrals 140
B Model of Plasma Expansion 142
C Evaluation of la 145
D Derivation of Equation (C.3) 148
List of Figures
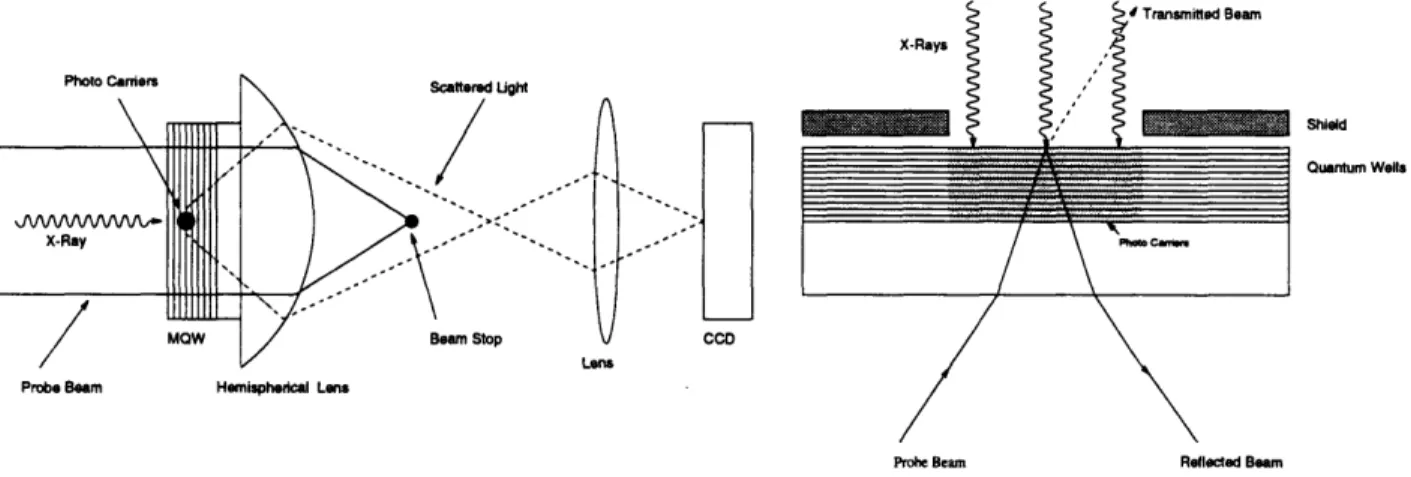
1-1 Schematics of quantum well based x-ray detectors. A planar detection scheme (a) was originally proposed by'Eugster et al. and subsequently modified by
a direct imaging scheme by Basu (b) ... 18
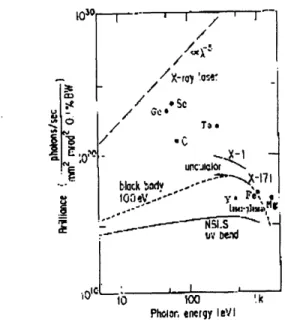
2-1 Peak brilliance as a function of photon energy of various soft x-ray sources
(from Ref. [tom ie92] )... ... 24
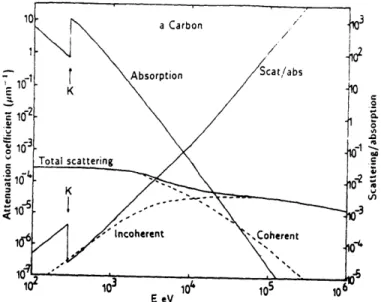
2-2 Linear absorption coefficients and scattering factors of Carbon as a function
of energy (from Ref. [michette86] ... 26
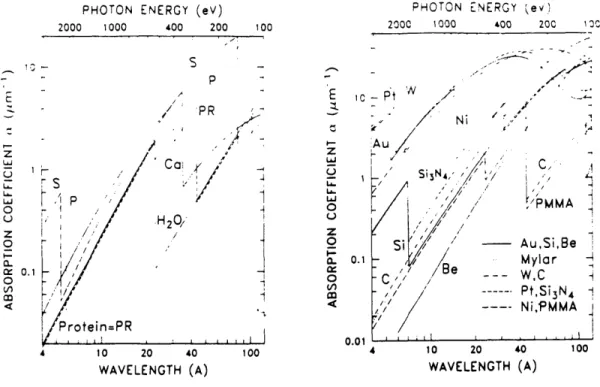
2-3 Linear absorption coefficient as a function of wavelength in the soft x-ray region for important materials (from Ref. [spiller83] ). In (a), the materials are important biological materials. Notice the difference in absorption of protein in water in the 20A - 44A range. In (b), the materials are some typical semiconductors and metals that are used for detector windows. . . 27 2-4 Measured maximum reflectivity versus photon energy for different multilayer
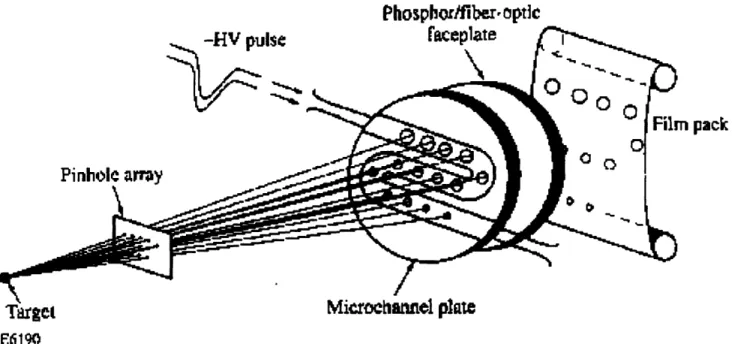
systems. The periods are between 35A and 78A.(from Ref. [spiller83] ). .. 28 2-5 Schematic diagram for a zone plate . ... . ... . 29 2-6 Schematic diagram for a Schwarzchild objective. . ... 30 3-1 Schematic of microchannel plate (from Ref. [elton90] ) . ... 36 3-2 Multiframe imaging based on single-meander microstrip design (from Ref.
[11e92] ). . . . .. . . ... .. . .. . . .. . ... . . . .... 37 4-1 Sommerfeld factor g(,f) a a function of non-dimensional parameter 0 defined
in text. Solid line represent numerical solution. Dashed line represents fit to
f(,3) = 1 + exp(-(47rp,)l/ 2). The function f(0) 0 2 for reasons discussed in
text . ... . ... ... 48
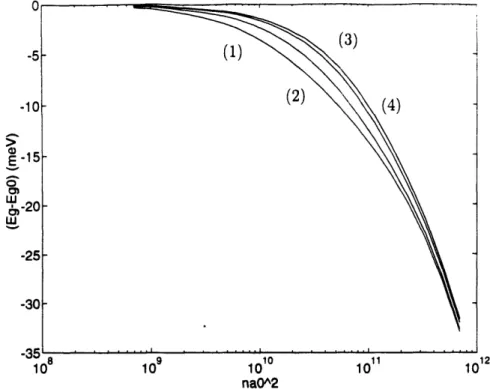
4-2 Comparison of fractional band gap shift from (D2) (dashed line) with full numerical result [schmitt85a] (solid line) at different temperatures (1) T=.1B
4-3 Renormalized band gap Eg(ne) in GaAs MQWs as a function of carrier den-sity at different temperature. (1) T=77 (2) T=150 (3) T=250 (4) T=300 57 4-4 Plot of nonlinearity in GaAs MQW. The variable a is defined in (4.26)
Dashed Line: Full Model, Solid Line: Without redshift of excitonic lines. .. 58 4-5 Plot of absorption curves in GaAs MQW at for two different carrier
den-sities. Solid Line: ne = 1014cm- 3 Dashed Line: Without redshift nT =
2.5 x 1016cm-3, Dotted Line: Full Model ne = 2.5 x 1016cm- 3
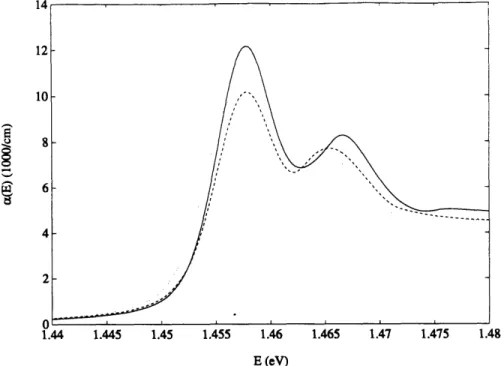
. . . . 59 4-6 Room temperature absorption curves for GaAs MQW (units of 1000cm-1).
Solid Line: Experiment, Dashed Line: Theory. . ... 60
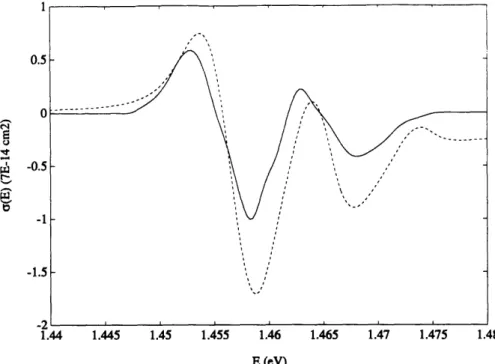
4-7 Plot of nonlinearity in GaAs MQW. Solid Line: Experiment, Dashed Line:
Present Model. ... .. 61
4-8 Plot of absorption curves in GaAs MQW at the two different carrier densities. Solid Line: ne = 101 4 cm- 3 Dashed Line: ne = 2.5 x
1016 . ... 62 4-9 Comparison of DFWM spectra predicted by model with experimental spectra
of Chemla et al.. [chemla84] . Dashed Line: Empirical fit of Chemla et al.,
Solid Line: Present M odel ... 62
5-1 Plots of the absorption spectra as a function of energy at five different tem-peratures: (1) T=77 K, (2) T = 150 K, (3) T=200 K (4) T=250 K, (5) T= 300 K. Energies, at each temperature T, have been adjusted to account for
the variation in band gap. ... 66
5-2 Plots of the nonlinearity spectra as a function of energy at five different temperatures: (1) T=77 K, (2) T = 150 K, (3) T=200 K (4) T=250 K, (5) T= 300 K. Energies, at each temperature T, have been adjusted to account
for the variation in band gap. ... 67
5-3 Plots of nonlinear coefficient as a function of temperature at two different en-ergies. (1) E=1.453 eV, (2) E=1.4575 eV. The energies, at each temperature T, have been adjusted to account for the variation in band gap. ... 67 5-4 Plots of absorption curves at two different carrier densities (solid lines: ne =
1014cm-3, dashed lines: ne = 2.5 x 1016cm - 3) at two different temperatures (Left: 120 K, Right: 77 K). Note the large shift of the absorption curve from Fig. 5-3 due to change in band gap energy. . ... . . 68 5-5 Plots of maximum nonlinear coefficient as a function o FGc/FL at different
temperatures. (1) T=77 K, (2) T=300 K. The lower set of curves corre-spond to resonant transitions (E = 1.475eV) and the upper to nonresonant
6-1 Schematics of quantum well based x-ray detectors. A planar detection scheme (a) was originally proposed by Eugster et al. and subsequently modified by a direct imaging scheme by Basu (b). Details of these schemes can be found
in the text. . ... ... .. 71
6-2 Schematic of the multi-layer stack. With each interface and layer is associated a transmission matrix. The overall transmission matrix is expressed as a product of individual matrices. The cap layers are usually GaAs. They prevent the oxidation of the surface and are typically very thin (- 1001)
and do not affect the optical properties of the quantum wells significantly.
Details are in the text and Appendix B. . ... . 72
6-3 Plot of the reflectivities as a function of different probe energies for three different substrate thicknesses: (1) L,= 190A, (2) L,= 410A, and (3) L,= 490A. The other parameters for the quantum well stack are: L,= 170k,
Lb=50A, and N = 30 Layers. ... 74
6-4 Temporal evolution of the free carrier density at the origin. The avalanching caused by the primary carrier is assumed to stop within 1 ps subsequent to which the plasma expands hydrodynamically as given in Appendix A. (1)
E. = 70eV and (2) E. = 500eV The horizontal solid line corresponds to the background density undetected by the probe beam. . ... 76 6-5 Width of e-h plasma in the direction perpendicular to the quantum wells as
a function of time. After about 35 ps, the plasma cools to energies below Eoffset and no further expansion perpendicular to the wells is possible. . . 76 6-6 Absorption lineshapes calculated using the semi-empirical model of Chapter
3. for different carrier densities at T=300 K. (1) ne = 1011cm- 3 (2) Ex =
70eV 4- ne = 2.5 x 1015cm- 3 (3) Ex = 500eV
-+
ne = 2.0 x 1016cm-3 (4) Same as (3) but from using the experimental non-linear coefficient of Chemlaet al measured at ne
-
8
X 1015cm- 3. . . 77 6-7 Plot of the substrate length L, as a function of probe wavelength Ap. Thesubstrate length L, minimizes the the reflection R at Ap. The dashed lines correspond to principle wavelength of interest in Sec. 6.3 at A,p=818.55 nm and Ap=821 nm. The other relevant parameters are N = 30 layers, L,=170A,
6-8 Plot of the reflection coefficient Ro and AR = (Rx - Ro)MaxSignal as a func-tion of angle for layer in Fig. 6-2 (Layers = 20, Lb=50A, L,= 175A, T=150 K, Ex= 500 eV). Ro and Rx are the reflection coefficient with and with-out a single absorbed x-ray photon. Here Max Signal corresponds to the wavelength where the change in the reflected signal is the largest. This is
described in text in Sec. 6.3. ... 81
6-9 Plot of AE = (.Fpr(nx)-Fpr(no))A vs the contrast ratio CR = AE/(Fpr(no)A) where A = 1lLm2 is the area of a pixel on the MQW to be imaged on the
CCD array. The individual points correspond to different probe energies. The
modeling condition here corresponds to t= 1 ps, Layers = 30, Lb= 50A, L,= 175A, T=150 K, Ex= 70 eV. The dashed line corresponds to the minimum energy required to be deposited on a 19pm x 19pm pixel for detectability. 84 6-10 Plot of the change in the reflected energy AE as function of quantum well
width L, at different temperatures: (1) T=150 K, (2) T=225 K, (3) T=300 K. The incident photon is Ex= 70 eV. The signal is measured at Ep where
AE is maximum and where CR > 5%. ... 85 6-11 Plot of the change in reflected energy AE as function of quantum well
fluctu-ation parameter a. The dashed horizontal line corresponds to the minimum detectable CCD signal. The probe energy Ep is selected where AE is maxi-mized such that the contrast ratio is 5-10%. . ... 86 6-12 Plot of the AE as defined by (6.4) as a function of incident x-ray energy Ex.
The dashed lines corresponds to a least squares fit of the data. The specific design is for L, = 170A, T = 150K and o= 2.4A. The signals are measured
at Ep=1.5067 eV = 821 nm. ... 87
6-13 Plot of the AE as defined by (6.4) as a function of incident x-ray energy Ex. The dashed lines corresponds to a least squares fit of the data. The specific design is for L, = 170A, T = 150K and a= 2.4A. The signals are measured
at Ep= 1.5112 eV = 818.55 nm. ... 88
6-14 Plot of the time history of AE(t) for two different probe energies. The dashed lines correspond to Ex = 500eV and the solid lines correspond to E,= 70 eV. The specific design is for L,= 170A, T = 150K and a = 2.4A. ... 89 7-1 Comparison of fractional band gap shift from (22) (dashed line) with full
numerical result [schmitt84] (solid line) at different temperatures (1) T=.1B
7-2 Plot of parameter y defined in (7.6) as a function of the coupling constant rs
at different temperatures (1) T=0 , (2) T=.05Eo, (3) T=.1Eo, (4) T=.5Eo,
(5) T=Eo , (6) T=2Eo, (7) T=4Eo. The approximation (2) is most accurate
for - > 1 (- 5%) but gives reasonable estimates for .1 <
-y
< 1 (- 15%). .. 997-3 Plot of screened-exchange energy Ex" as a function of r, at different temper-atures (1) T=Eo, (2) T=2Eo, (3) T=4Eo. The dotted and dashed lines are from the asymptotic scaling relations given in Table 7.1 . ... 102
7-4 Plot of coulomb-hole energy Ex" as a function of r, at different temperatures (1) T = Eo, (2) T=2Eo, (3) T=4Eo. The dotted and dashed lines are from0 the asymptotic scaling relations given in Table 1. ... 102
7-5 Variation of the lineshape steepness parameter as a function of free carrier density (from Ref. [liebler90] ). The parameter is defined in the text and is dim ensionless .. . . . .. . . .. . . . ... 104
7-6 Comparison of the Lorentzian lineshape with the new lineshape given by (7.46) ... 117
7-7 Plot of function f2(E) using the function for E(t) given in (7.47) ... 119
7-8 The ratio of the (7.31) to the Lorentzian function at E = 0 at different tem peratures . . . . 120
8-1 Schematic of the proposed. scanning x-ray microscope. ... 124
8-2 Schematic of the rotating pinhole disks. ... . 125
8-3 A typical Nipkow disk (from Ref. [xiao88] ). ... 125
8-4 Schematic of a one dimensional potential with a metastable transition be-tween the first excited state (n=2) and the ground state (n=1l). See text for discussion . . . ... 131
8-5 Plot of decay time r of the metastable state vs. width of barrier layer LB. The barrier height is EB = 300 meV and the offset energy Eo = 60 meV. A simple one dimensional Schroedinger solver is evaluated to calculate eq. (8.4) numerically. ... 132
List of Tables
2.1 Values of typical photon flux from a source-spectrometer system subtending a solid angle of 10-1 and a imaging bandwidth of AA/A = 0.01%. The values for source brightness are given in Fig. 2-1 . ... 25 2.2 Values of typical photon flux from a source-lens system a numerical aperture
of 10-1 and a imaging bandwidth of AA/A = 0.1%. The values for source
brightness are given in Fig. 2-1 ... 25
2.3 Typical parameters for condenser zone plates (CZP) and micro-zone plates
(MZP) (from Ref. [schmahl84] ). ...
29
2.4 Typical performance of Schwarzchild two-mirror focusing optics. . ... 30
3.1 Detectors for Soft X Rays ... 34
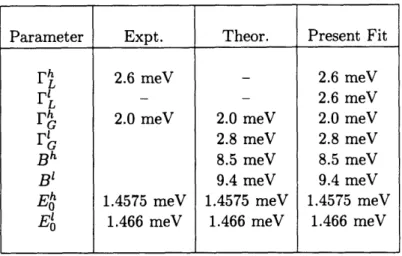
4.1 Comparison of fitting parameters used with experimental and theoretical values. The quantitity Eol = E-h - Bh,l = Eg + E- Bh,i . . . . 44 4.2 Table of oscillator strengths used for the light hole exciton transition. Best
fit values are values that give the best agreement with the experiment. . . . 44 4.3 Table of confinement energies and exciton energies, in meV, as a function of
quantum well width L, and doping x of Al in the barrier region. The exciton binding energies are tabulated from the literature [sanders87c, nojima88] . Values appearing in parenthesis are interpolated values. The binding energies in the column x = 0.15 are actually for x = 0.25 due to a lack of availability of accurate computations in the literature for x = .15. . ... . 51 6.1 Summary of the chief parameters and performance of the detectors. The
definitions of the variables are found in the text. * Actual L, values can also be be half integer multiples of the probe wavelength added to the minimum value specified above. See Sec. 6.2.3 for details. . ... . . . 73
7.1 Scaling of screened-exchange and coulomb-hole energies E"X and Zch as a function of temperature T and coupling parameter rs. These scalings have been derived from (7.7) and are rather good approximations of (7.7) (within
5%) for Eo < T < 10Eo. Here Eo = 4Ryd2D. ... ... 101 7.2 Numerically computed values of (1) for bound-bound transitions for different
n and m. In each entry, first row is the value from (2) and second row is the
result from numerical integration. ... ... . . 111
7.3 Numerically computed values of (1) for bound-free transitions for different n and m. In each entry, first row is the value from (2) and second row is the
result from numerical integration. . ... ... 112
E.1 Numerically computed values of (1) for integer values of c and m. Error is
the defined to be IS
,,,,,
- S,.actI ... 153E.2 Numerically computed values of (1) for complex values of c and m where c
Chapter 1
Introduction
Line emissions from ionized atoms in the soft x-ray regime have been well studied in the lit-erature with detailed spectroscopic data available for a large number of transitions. However recent advances in the x-ray sources and optics have led to a resurgence in interest in this field. These investigations have been stimulated to a large part by potential applications to semiconductor lithography and the microscopy of biological organisms.
This rapid development of soft x-ray sources, optics and applications has heightened the need for improved diagnostics such as spectrometers and detectors [basu92, hagelstein91]. This thesis pertains to the problem of soft x-ray detection. The focus of study will be towards detection systems suited for detecting x-rays from laboratory soft x-ray sources such as electric discharges, laser produced plasmas, synchrotron sources and x-ray lasers. An important detection problem that will not be addressed in this thesis is detection of radiation from astrophysical sources.
Presented in this thesis is a design for a soft x-ray detector in the 70 eV - 500 eV range
that combines excellent spatial and energy resolutions with sub-fifty picosecond time gating capability. Such a detector is presently unavailable and the development of such a device as described in this thesis would have important applications in the areas of x-ray microscopy and plasma diagnostics.
The detector is based on the concept of optically imaging the x-ray induced free-carriers in semiconductor quantum wells. The general idea is to select a probe beam tuned near the onset of the heavy hole excitonic peak where the change in the optical susceptibility is the largest. The lengths of the various layers are chosen in a manner such that under quiescent conditions, the reflection is near minimum (typically 5% to 10%). The presence of x-ray induced carriers modifies the optical susceptibility, thereby modulating the opti-cal impedance of the multiple quantum well (MQW) structure. The modulation in the impedance appears as reflected light and is imaged on a CCD (charged coupled device)
camera. By exploiting the natural resonances in the transmission and reflection coefficients in a multi-layer dielectric stack, contrast ratios as high as 10-20% can be achieved.
A detailed description of this detector, the physics behind its design and its potential applications are the topics covered in this thesis. We will concentrate on applications where such a fast, high resolution, large area detection capability can efficiently be exploited.
In this introductory chapter, we outline the principal issues facing the design and ap-plication of x-ray detector technology. These issues will be expanded upon in subsequent chapters. We will then summarize the significant results from this thesis and present a brief outline of the thesis content and organization.
1.1
Description of Problem
1.1.1
Nature of X-Ray Source
In semiconductor lithography applications, the availability of a bright x-ray source is equally important. Photoresists such as polymethylmethacrylate (PMMA) used widely for litho-graphic masks, require high energy density to polymerize (- 10 - 100mJ/cm2) [elton90, newnam]. Bright sources shorten the exposure time required to develop these resists, thereby shortening the processing time of ultra-small devices [newnam].
In x-ray microscopy applications, the availability of a bright short-pulsed source is key to high-resolution in vivo imaging of biological specimens. The short wavelength is required for high spatial resolution and the short pulse reduces the irradiation dosage and penumbral blurring from specimen motion. An additional feature useful for in vivo imaging is the availability of sources in the spectral range of 2.3 nm to 4.4 nm range (280 eV - 530 eV) where the image contrast between proteins and water is the largest [henke60].
Recent research in soft x-ray sources has centered around the development and use of bright x-ray sources such as synchrotron radiation, laser plasmas, electric discharges and more recently, lasers [michette86, newnam, chaker86, choi86, basu92]. These sources are 12-20 orders of magnitude brighter than conventional x-ray tubes and are key to applications described above [elton90]. These sources produce both line and continuum emission that span the entire soft x-ray spectrum.
Typical laser plasma sources are sufficiently bright that in a 10nm x 10nm area, there are over 1014photons/sr/sec/.1% bandwidth flux incident [elton90]. However, they have spot sizes not much larger than 100pm and short temporal length (few ns). Synchrotron sources have similar brightness but are larger (mm) and have longer temporal features (typically micro to milliseconds).
has been the development of a tabletop short wavelength laser system in the 200
A(,
65eV) regime. Line emissions from the gain line of an x-ray laser are 4-5 orders of magnitude brighter than from any other sources of laboratory x-rays. Recently, we successfully demon-strated amplification of the 204A
line in Ni-like Nb and the 262A
line of H-like Boron. The gain media in both cases is a hot highly-ionized plasma formed by the ablation of a solid target by a high-power pump laser. The line and continuum emissions from the plasma have a rather broad spectral range (from 0- - 2keV) with temporal features ranging from tens of picoseconds to a few nanoseconds.Soft x-rays from laser plasma sources are useful not only for technological applications but they also serve as important diagnostics for other physical processes. For example, in laser-driven inertial-confinement fusion (ICF) experiments, fuel capsules are compressed to high densities causing implosions. Typical in-flight shell velocities during capsule implosions are in excess of 0lcm/sec [lle92, kilkenny88]. Therefore, variations in spatial scales of 10pm occur over timescales of 100 ps. X-ray emissions from the rapidly evolving plasmas provide important information about plasma parameters such as density, temperature and composition.
1.1.2
Detection Problem
If one were to design an ideal detector, the features that one would include would be: * High Spatial Resolution: For microscopy applications, spatial resolutions of 10nm
-50nm are needed. For diagnostic applications, resolutions of 1 - 5pm are needed to make the detector comparable to passive detectors such as x-ray film.
* High Sensitivity: Ideally, one would like single photon detection capability.
* Fano-limited Energy Resolution: For energy dispersive measurements, one would like energy resolutions that are limited only by the inherent uncertainty in the photon-electron conversion process (Fano limit). Typically, this limit is about 30 eV - 80 eV in the short wavelength region.
* Fast Gating/Temporal Response: In plasma diagnostic applications, the fast detectable processes are usually on the order of tens of picoseconds. Thus, one would require a detector with gating capabilities on the order 10-50 ps.
* Large Detection Area: Recent development in x-ray spectrometer designs allow for two dimensional imaging of x-ray sources. In this context, a detector with large area detection capability (- cm), in addition to high spatial resolution is needed.
As we will see in Chapter 3, a detector that meets all these requirements is not presently available. At present, micro-channel plate technology is used for soft x-ray detection. These detectors have spatial resolution of 10-20 pm and a temporal resolution of 150 ps with sensitivity of 0.3 photon/pm2 [ceg86, eckart86, kilkenny88]. The limiting factor for spatial and temporal resolution is the diameter of the channel and the transit time of the photo-ionized electrons [wiza82]. For time-integrated detection, resolutions of tens of nanometers have been achieved with PMMA and resolutions of 5 pm with Kodak 101 film [jacobson89, henke84]. CCD arrays provide an alternate method for time-integrated detection and are frequently used in astrophysics applications were films are inconvenient. However, front illuminated CCDs detectors are not well suited for soft x-ray detection, owing to large absorptive losses from the surface metal contacts and poly-silicon layers [saliere88, tassin92]. Presently, an active area of research is the design of back-illuminated CCD arrays that avoid the absorptive losses associated with the front illuminated structures. These appear to provide acceptable quantum yields in the soft x-ray window [saliere88, tassin92].
In short, fast detectors with picosecond gating capabilities have poor spatial and energy resolutions and are not suited for large area imaging. Detectors with excellent spatial and energy resolutions do not have good gating capabilities. The choice of detectors is ultimately dictated by the experiment.
In applications involving laser plasma and related sources for soft x-rays, detector sen-sitivity is not a particularly stringent requirement. For example, consider a hypothetical detector with a 1plm resolution. Using typical values for brightness of x-ray laser plas-mas sources, there are over 1018photons/sr/sec/0. 1%bandwidth incident on a pixel area of 1pm x lpm. Assuming typical acceptance angles of 10- 4 steradian and a 50 ps lifetime
of x-rays, there are over 5000 photons incident per pixel. This is usually not a very diffi-cult detection problem. Therefore, for most diagnostic and imaging applications using soft x-rays from laser plasma and synchrotron sources, a fast detector with high spatial and energy resolutions and a large detection volume is sufficient.
A detector combining high temporal resolution with high spatial and energy resolutions represents an important advance in detection technology. Such a detector would find im-mediate applications in x-ray microscopy and plasma diagnostics. These will be elaborated further in Chapter 7 of this thesis.
1.1.3 Quantum Well Detectors
Advances in the field of nonlinear optics has led to the development of new and very sensi-tive fast optical components. Recently it has been proposed to apply these new techniques to the problem of x-ray detection [eugster90, basu91]. In conventional detection schemes,
Shield
Quantum Wells
Probe Beam Reflected Beem
Figure 1-1: Schematics of quantum well based x-ray detectors. A planar detection scheme (a) was originally proposed by Eugster et al. and subsequently modified by a direct imaging scheme by Basu (b).
x-ray photons are detected by electrically imaging the photocarriers created by a photoab-sorption event. In an optical detection strategy, the x-ray photons are detected by optically imaging the photocarriers. The optical imaging is carried out at a lower energy (typically far infrared) where detection is easier and more robust. This strategy is a promising alternative because optical processes in semiconductors: (1) are comparatively fast (tens to hundreds of picoseconds), (2) have potentially high spatial resolution, since the typical diffraction limit of the probe beam is 1lpm, (3) have high energy resolution comparable with the best Fano-limited semiconductor detector technology presently available and (4) have large area detection capability that is relatively straightforward.
X-ray detectors based on these new approaches would have rather different properties than existing x-ray detectors, and may find applications in areas where fast, high resolution large area detection is required [macgowan90, london89, ceg86].
One particular approach that has been studied in detail is a detector scheme based on semiconductor quantum well technology. Proposals have been made to use excitonic non-linearity in semiconductor quantum wells for the purpose of X-ray detection [eugster90, basu91]. The essence of this idea is to observe, using optics, the modulation of the optical susceptibility induced by the free carriers generated by the absorbed x-ray photon. This approach was first proposed and analyzed by Eugster and Hagelstein who studied a planar MQW structure and a micro-etalon detection scheme [eugster90]. In the planar detector scheme they proposed, the x-ray photon is detected by imaging the scattered radiation of
the probe beam from the variation in the complex index of refraction caused by the x-ray-induced free carriers. Temporal resolution is achieved by exploiting the angular spread of the scattered signal. A schematic of this approach is given in Fig. 1-1(a).
This general approach was reviewed and improved upon by Basu [basu91]. Rather than imaging the scattered signal, Basu proposed to image the probe beam (see Fig. 1-1(b)); in this case, he found that the modulation of the optical susceptibility was sufficient to observe the change in the transmitted signal through the multi-layer. The modulation in the impedance appeared as reflected light and was to be imaged on a CCD camera. He concluded that using simple interferometric techniques, such as the Nomarski method [heinrich86], one could get sensitivity thresholds as low as 12 photons/im 2 for 500 eV x-ray photons. In his designs, he assumed that a contrast ratio of 1% (defined to be the change in transmitted signal as a fraction of the total signal transmitted) could be readily observed.
Although the earlier work demonstrated, qualitatively, the feasibility of a soft x-ray de-tector based on the use of multiple quantum wells, the earlier designs had poor sensitivities and were not very robust. For example, Eugster's designs suffer from signal to noise prob-lems and necessitate sophisticated detection and stringent fabrication constraints for the quantum well sample.
Basu's design is conceptually easy to implement and, based on his numerical estimates, appears well suited for detection applications. However, there are significant errors and a number of deficiencies in his analysis. Specifically, the numerical estimates based on the beam propagation formalism described in the paper are erroneous due to: (1) the use of incorrect digitization of the optical absorption data from Chemla et. al (e.g., the sharp peaks in the absorption spectra in his paper are spurious) [chemla84]; and (2) an improper treatment of reflection and transmission at the interfaces. Both these errors lead to a significant inaccuracies in both the quantitative and qualitative results.
Furthermore, Basu never attempted to optimize the detector performance. For exam-ple, no attempt was made to study important design quantities such as energy resolution, temporal resolution and spatial resolution. In order to analyze the detector performance in terms of these parameters and to optimize the performance, an accurate model for optical absorption in quantum wells is needed. Basu relied upon simple extrapolation from avail-able experimental data. Whereas this is useful for preliminary analysis, it is insufficient for a detailed analysis of device characteristics.
1.2
Principal Results in this Thesis
The principal focus of this thesis is the design of a quantum well soft x-ray detector. In this regard, described in this thesis is a soft x-ray detector with an energy resolution of 85
eV in the 70-500 eV range, a spatial resolution of lpm, a temporal resolution of 20 ps. and a sensitivity of 25 photons/pm2. For energies greater than 500 eV, the detector's energy resolution deteriorates but its other features remain essentially unaltered. The results from this investigation wil be shortly submitted to IEEE J. of Quantum Elect. for publication.
However, the design of x-ray detector represents only one facet of the thesis work. The detector design is based on observing a change in the optical susceptibility in semiconductor multiple quantum well structures induced by the absorption of x-ray photons. Therefore, significant time has been devoted to understanding and modeling absorption lineshapes in quantum well structures. Details and results from these investigations also form a sizable fraction of this thesis.
Finally, in addition to the design studies of the x-ray detector, significant effort has been undertaken to investigate applications of the concepts developed in this thesis to other areas of physics and engineering. The results of this investigation is detailed in Chapter 8 under the title of "Future Research Directions."
Here, we summarize the principal new results from all these investigations.
1.2.1 Lineshape Theory
Our lineshape investigations have followed two complementary strategies. The first ap-proach we have undertaken is to understand the principal absorption features using a semi-empirical lineshape model. The semi-semi-empirical treatment of lineshape described in this thesis follows closely the approach used in atomic and plasma physics. In this approach, the lineshape is expressed in terms of a number of basic variables such as lineshape, oscil-lator strengths and line positions; and each of these are described by simple models. The models describe the relevant physics in terms of design parameters, quantum well geometry, operating parameters (e.g., free carrier density and temperature) and process parameters (such as quantum well quality). From such a description, optical constants can be readily computed.
The second approach we have undertaken is a theoretical first-principles analysis of the semiconductor lineshape. This was motivated by several important deficiencies in the semi-empirical model. In the band-tail region, the lineshape is not well described by simple lineshape functions, such as the Lorentzian function used in the semi-empirical treatment; instead, it follows an exponential law called the Urbach rule. A quantitative description of this so-called band-tail region is important for the detector design because the saturation dynamics of the optical excitation is found experimentally to be considerably different from the region near the principal resonances.
the interaction of the exciton with optical phonons. A proper description of this physics requires a sophisticated theoretical treatment using Green's function techniques from
many-body physics. This has been done and new results are reported here.
1.2.1.1 Semi-Empirical Lineshape Theory
The principal results from this study are:
1. An accurate semi-empirical model of the oscillator strengths for excitonic transitions in quantum wells.
2. A novel parameterization of the renormalization of the band gap due to free carriers in terms of two non-dimensional parameters; and a parameterization of the exciton line positions from perturbation theory.
3. An adaptation of a simple binary collision model from plasma physics to calculate the free-carrier contribution to the excitonic linewidth.
4. Inclusion of inhomogeneous broadening due to fluctuations in well widths. These results are to appear shortly in IEEE Jour. of Quantum Electronics.
1.2.1.2 Theoretical Lineshape Studies
The principal results from the theoretical investigations are:
1. A simple analytical closed form solution of exciton-phonon matrix element in two dimensions. This is analogous to the Bethe matrix element which is appropriate for describing the photon interaction in hydrogenic atoms. This has appeared in J. of Math. Phys., 34, 1994.
2. Analytical scaling relations and simple, accurate algebraic expressions for the renor-malization of the bandgap energy in quantum wells due the presence of free carriers. This has been submitted to Phys. Rev. B for publication.
3. A simple new non-Lorentzian lineshape function that is Lorentzian near the principal resonance and is exponential in the band-tail region.
4. A simple lineshape theory of phonon/photon broadening of hydrogenic lines in which the lineshape is given in terms of a series of convolutions. The convolutions are divided into symmetric functions that describe lifetime broadening, and asymmetric functions that describe self-energy fluctuations.
1.3
Organization of Thesis
This thesis is divided into three general parts. The first part, from Chapters 2-6 pertain to the design of the quantum well x-ray detector. The second part, which is primarily Chapter 7 and the Appendices, is devoted to theoretical investigations of quantum well physics. These investigations were motivated by issues raised in the design studies of the detector. The third part is Chapter 8 and it focuses on the applications of the detector and related technology to other areas of engineering.
In Chapter 2-3, in order to provide a backdrop for this thesis, we review the basic features of the soft x-ray spectrum, laboratory soft x-ray sources and the state of the art detectors. In Chapter 4, we describe the semi-empirical lineshape model and study some applications of the model in Chapter 5. Finally, in Chapter 6, we describe the quantum well detector and discuss its performance limitations.
Chapter 7 is primarily devoted to the theoretical study of lineshapes in quantum wells. It is motivated by deficiencies in the semi-empirical lineshape model of Chapter 3 and by potential improvement in detector performance.
The Appendices contain mathematical details of some of the theoretical results used in Chapters 3 and 7. Appendix A is a devoted to the approximation of the exchange and correlation energy integral that appears in the expression for the change in bandgap energy as a function of the electron-hole pair density. The results from this Appendix are used in Chapter 7 for a theoretical model of bandgap renormalization in quantum wells. The other Appendices provide technical details to some of the computations quoted in Chapters 6 and 7.
Chapter 2
Properties of Soft X-Rays
The basic properties of soft x-rays have been reviewed in a number of books and papers [michette86, elton90]. In this chapter we summarize the issues that are most relevant to the development of this thesis. Specific topics addressed in this chapter are: characteristics of soft x-ray sources, propagation of soft x-rays in materials and recent advances in soft x-ray optics.
2.1
Soft X-Ray Spectrum
The term "soft x-ray" as used in this chapter and elsewhere in this thesis describes the region of the electromagnetic spectrum where the photon energies are 50eV < E < 2keV
[elton90]. This range is somewhat loose, with 2keV being a typical upper range quoted in the plasma and astrophysics literature and 20keV being common in spectroscopy literature. For many important technological applications such as semiconductor lithography and x-ray microscopy, the lower range is often the only range of interest.
For example, the K shell emissions from low Z atoms (Z < 18) have energies less than
2 keV. These emission lines are important in biological imaging applications (e.g., electron and x-ray microscopy) where the principal atomic constituents of organic tissues are oxygen
(524 eV), nitrogen (390 eV) and carbon (277 eV).
In laboratory plasmas (e.g., those created by laser irradiation or electrical discharges), available pump energies usually constrain the emissions to be within 10 keV. Even in as-trophysical plasmas, whose spectral range extends into the MeV range, the soft x-ray spec-trum still contains valuable spectral information. For example, the C(V),C(VI), Fe(IX), O(VIII) lines from galactic sources are used to ascertain the origin of soft x-ray background [schnopper82, rocc84]. In fact, for most x-ray astronomy studies, only energies to about 20 keV are detected and used for analysis [fraser89a].
-- /I /" -/X-raj 'os:
SCe
O - •/ *Sc U I 0" - 7 '.'e / T)', • i'I; SU.C'J~IlOr o 0.i - LI1lmI 10 100 k Pholor energy leVIFigure 2-1: Peak brilliance as a function of photon energy of various soft x-ray sources (from Ref. [tomie92]).
2.2
Soft X-Ray Sources
As we will discuss in the next chapter, there are a fairly large number of x-ray detectors available for the purpose of source diagnostics. The choice of a detector and its expected performance is influenced heavily by the brightness of the source and its spectral features. Soft x-ray sources can be classified into two broad categories: plasma and electron sources. In a plasma source, x-rays are produced by radiative transitions in an ionized plasma. In an "electron source," the x-ray emission comes primarily from a rapid accel-eration/deceleration of electrons such as that produced in a synchrotron facility or from electrons impacting a solid surface. These have been reviewed in detail in the literature [michette86, elton90].
The most basic parameter characterizing a light source is the brightness. This is defined as the photon flux per energy bandwidth (typically 0.1%) per steradian (sr):
B = photons
cm2 sec sr 0.1% bandwidth'
In Fig. 2-1, B(E) is plotted for four principal laboratory x-ray sources [tomie92]. The brightest sources for soft x-ray radiation are x-ray lasers with brightness expected to exceed 103 3photons/cm2/sec/sr. Laser plasma sources and their competitors (e.g., synchrotron and z-pinched plasma tubes) have brightnesses that are roughly 6 orders of magnitude smaller. However, one must keep in mind that the brightness of laser line emission is large only near
Flux (photons/sec Source B hotons 50nm x A = A = 5cm x Source B (_se/s A = A = A = cm /sec/sr 50nm
5p
5cm Solid Target 105 2.5 x 10- 10 2.5 x 10⁻⁶ 2.5 x 10² Tokamak 1011 2.5 x 10- 4 2.5 2.5 x 10⁸ Laser Plasma 1022 2.5 x 10⁷ 2.5 x 10¹¹ 2.5 x 10¹⁹ Synchrotron 1018 2.5 x 10³ 2.5 x 10⁷ 2.5 x 10¹⁵ X-Ray Laser 1027 2.5 x 10¹² 2.5 x 10¹⁶ 2.5 x 1024Table 2.1: Values of typical photon flux from a source-spectrometer system subtending a solid angle of 10-1 and a imaging bandwidth of AA/A = 0.01%. The values for source brightness are given in Fig. 2-1
Flux (photons/sec/.1% bandwidth)
Source B photons 50nm x A = 5x A = 5cm x Source B cm/sec/sr A = 50nm A = 5 5cm Solid Target 108 2.5 x 10⁻⁶ 2.5 x 10⁻² 2.5 x 10⁶ Tokamak 10o4 2.5 2.5 x 10⁴ 2.5 x 10¹² Laser Plasma 1025 2.5 x 10¹¹ 2.5 x 10¹⁵ 2.5 x 10²³ Synchrotron 1021 2.5 x 10⁷ 2.5 x 101 2.5 x 10¹⁹ X-Ray Laser 10 2.5 x 10¹⁶ 2.5 x 10²⁰ 2.5 x 10²
Table 2.2: Values of typical photon flux from a source-lens system a numerical aperture of
10-1 and a imaging bandwidth of AA/A = 0.1%. The values for source brightness are given
in Fig. 2-1
the principal gain line. Line emission from non-gain lines and the continuum from an x-ray laser plasma have brightnesses that are similar to those in conventional point focus laser plasmas.
To put these numbers into perspective, computed in Tables 2.1 and 2.2 are some typical values for the photon flux (photons/sec) incident on a surface with area A for two different experimental configurations. In 2.1, the source is assumed to be a point source that is imaged with a spectrometer subtending a solid angle of roughly 10- 4 and an imaging bandwidth
AA/A ~ 0.01%. These numbers are typical for our x-ray laser system.
In 2.1, the source is once again a point source. However, the source is assumed to be focused by focusing optics with a numerical aperture N.A = 0.1 and a bandwidth of AA/A - 0.1%. These numbers are typical for x-ray microscopy applications.
0 0 0 C 4, C 0 0. 0 .0 an C 4, (d, Q ev
Figure 2-2: Linear absorption coefficients and scattering factors of Carbon as a function of
energy (from Ref. [michette86].
2.3
Propagation of Soft X-Rays in Media
Tabulated values for the absorption coefficients and scattering strengths of soft x-rays in
different materials are readily available in the literature. Here, we reproduce a very small
subset of the data for later use.
The intensity of electromagnetic radiation is attentuated due to scattering (elastic) and
absorption (inelastic). Shown in Fig. 2-2 is the attenuation of soft x-rays (in the direction
of propagation) as a function of energy for both absorption and scattering. As it is seen, in
the soft x-ray energy range, attenuation due to absorption is several orders of magnitude
larger than that due to either elastic or inelastic scattering.
Shown in Figs. 2-3.a and 2-3.b are the plots of the total extinction coefficient as a
func-tion of energy for several important materials (spiller83]. Note the rather large numerical
values for absorption. For comparison, in bulk GaAs at optical energies (- 1.5eV), the
extinction coefficient is
_10
3cm
- 1. The absorption curves have a step like structure due
to K-shell absorption. Composites and molecules such as PMMA and Mylar have multiple
resonances from the different constituent atoms.
These large values of absorption in the soft x-ray regime have important consequences
for the design of x-ray detectors. Materials such as Be and Mylar are common "window"
materials in x-ray detectors (they protect the actual detector element from the ambient).
The necessity for these windows will be discussed in the next chapter. What is important
to note here is that for wavelengths above 20A, even a 1lpm thick window can reduce the
PHOTON ENERGY (eV) PHOTON ENERGY ,ev) 2000 1000 400 200 100 2000 1000 400 200 00C E. E c / PR .L z z o -4 o
o
rS
0) -O 0 I 0n 4 10 20 40 100 4 10 20 40 100WAVELENGTH (A) WAVELENGTH (A)
Figure 2-3: Linear absorption coefficient as a function of wavelength in the soft x-ray region for important materials (from Ref. [spiller83]). In (a), the materials are important biological materials. Notice the difference in absorption of protein in water in the 20A - 44A range. In (b), the materials are some typical semiconductors and metals that are used for detector windows.
incoming signal by nearly a factor of 100. Consequently, as we shall see in the next chapter, many x-ray detectors have poor efficiencies in the soft x-ray regime.
2.4
Soft X-Ray Optics
Though the availability of efficient optics is taken for granted in all visible light applications, this is not so trivial in the soft x-ray regime. In the soft x-ray wavelength, the index of refraction is near unity for all materials and absorption depths are no more than a few thousand angstroms (see Sec. 2.3). As a result, the design of efficient (i.e., loss free) focusing optics is difficult. A detailed discussion of soft x-ray optics is found in Ref. [michette86]. Here, we shall only address a few specific issues that are directly relevant to the design and operation of x-ray detectors.
The sensitivity of a detector is measured by its ability to image emissions from dim sources. As is often the case in x-ray detection, the sources are either small compared to the size of the detector (i.e., small numerical aperture). Consequently, the source incident on the detector is very dim. For example, typical soft x-ray emissions from astrophysical x-ray sources, due to the enormous distances from the source, occur at the rate of only a few counts/sec. X-ray emissions from most laboratory sources can be quite bright (see Sec. 2.2); however, they are confined to spatial dimensions that rarely exceed 100/sm and can
0.3 x aE - 0.2 I-u Ld, L-,0.1 0
0
4U 60 80 100 120WAVELENGTH
(A)
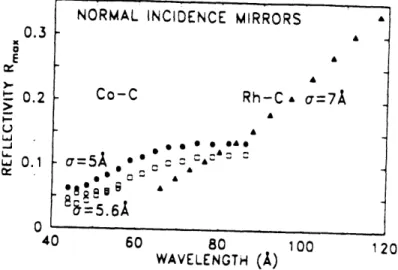
Figure 2-4: Measured maximum reflectivity versus photon energy for different multilayer systems. The periods are between 35A and 78A.(from Ref. [spiller83]).
be as small as 10nm. Consequently, a detector situated one meter away receives only 10- 8
to 10-16 of the signal.
It is clear that for studying emissions from dim sources, it would be most preferable to place diagnostics such as x-ray detectors as close to the source as possible. However, for many experiments, this is simply not feasible (e.g., imaging astrophysical sources). Under such circumstances, when practical restrictions make it impossible for a detector to be placed near the source, the method of choice is focusing optics. These are used to collect a sufficient number of photons to meet the signal-to-noise requirements of the imaging system (e.g., detectors, filmd, etc.).
Sometimes, in addition to improving the sensitivity, focusing optics are also used to improve resolution. For example, the resolution of typical detectors in imaging x-ray mi-croscopy is of the order ~ 1- 5/pm, whereas the diffraction limit of the incident illuminating x-ray beam can be in the range - 2 - 100nm. Therefore, in order to faithfully image the source (i.e., the illuminated specimen), magnification on the order of _ 103 is required.
The most basic optical components are mirrors and focusing lens. The most common mirrors used in the soft x-ray regime are multi-layer mirrors. For wavelengths A > 124A1, reflectivities - 50% are routine [spiller83]. Toroidal glancing angle optics can have
reflec-tivities as high as 70%-80% but owing to the shallow angles have poor numerical apertures. For shorter wavelengths, the reflectivities are markedly less. The measured reflectivities as a function of energy are plotted in Fig. 2-4 for different multilayers [spiller84]. For wave-lengths in the 40A-6oArange, the reflectivities are less thta 10%. This is especially serious for water window imaging applications.
dr
Figure 2-5: Schematic diagram for a zone plate.
CZP1 CZP2 CZP3
MZP1 MZP2
MZP3
Innermost Zone Radius: ro (pm) 49 23.1 49.8 17.2 1.15 .59
Zone Plate Diameter: D = 2rn(pm) 5000 9000 2500 1000 23.2 19.4
Number of Zones 2600 38000 630 845 100 270
Width of Outer Zone: 6rn (pm) .48 .06 .99 .3 .058 .018
Focal Length: fA=4.5nm (mm) 511 118.6 551 66 .3 .08
Numerical Aperture: N.A r rn/f .005 .038 .002 .008 .038 .125
Table 2.3: Typical parameters for condenser zone plates (CZP) and micro-zone plates (MZP) (from Ref. [schmahl84]).
system. Zone plates are circular gratings with radially increasing line density (see Fig. 2-5). By appropriately choosing the line spacings, it is possible to focus to the diffraction limit. A zone plate is characterized by the radius of the innermost zone ro, the radius of the outermost zone rn and the width of the outermost ring 6rn. The focal length f of the lowest diffracted order is approximately given by f P r~2A and the bandwidth of the focus is AA/A P 1/n [schmahl84].
The maximum diffraction efficiency of zone plates (total diffracted flux divided by the incoming flux) is typically 10% for the first order, 2.6% for the second and 1.2% for the third. The zeroth order is usually blocked in order to improve image contrast (see Ref. [michette86]).
In Table 2.3, characteristics for some typical zone plates are given [schmahl84]. Zone plates are labelled by the convention MZP and CZP to distinguish between their function-alities. Condenser one plates (CZP) refer to zone plates that are used to collect x-rays from the source, whereas the micro-zone plates (MZP) are used principally as objective lens to image the object. They are much smaller than CZPs with lens radius usually less than
Obje
Image
Aperture Stop
Figure 2-6: Schematic diagram for a Schwarzchild objective.
Numerical
Aperture Magnification Transmission %
Ref. [richardson92] .35 15 2% @ A = 7 nm
Ref. [masui92] .25 208.7 22% @ A = 15.1 nm
38% @ A = 13.6 nm
Ref. [burge92] .28 15 3% @ A = 23.3 nm
Table 2.4: Typical performance of Schwarzchild two-mirror focusing optics.
20pm and they have correspondingly smaller focal lengths (less than 1 cm to as small as 80Mim) [schmahl84].
The primary disadvantages with MZPs are: (1) small numerical apertures (N.A. = rn/2f) and (2) cost of fabrication. For example, even the smallest MZP given in Table 2.3 has a N.A. = 0.125. This MZP has an outermost zone with a thickness of only 6r, = 18nm. The fabrication of such thin circular zones is difficult and expensive and pushes the limit of current e-beam technology.
An alternative to zone plate technology has been the use of two spherical mirrors in the so-called Schwarzchild configuration as illustrated in Fig. 2.4.
In this configuration, the spherical mirrors are coated with multi-layers. In the Schwarzchild configuration, spherical mirrors with N.A. = 0.35 have been constructed and mirror sys-tems with even larger numerical apertures have been discussed in the literature. However, the principal disadvantage with this focusing system is the low efficiency of the mirrors. For water window imaging, multilayer mirrors have reflectivities of only 10%. Thus, the theoretical efficiency of the two mirror system is only 1%. In practice, the efficiency is even less [silva92]. Some typical performance data of Schwarzchild mirrors and are tabulated in Table 2.4. The important features to note in the table are: (1) the relatively low