HAL Id: hal-03243993
https://hal.archives-ouvertes.fr/hal-03243993
Submitted on 31 May 2021
HAL is a multi-disciplinary open access
archive for the deposit and dissemination of
sci-entific research documents, whether they are
pub-lished or not. The documents may come from
teaching and research institutions in France or
abroad, or from public or private research centers.
L’archive ouverte pluridisciplinaire HAL, est
destinée au dépôt et à la diffusion de documents
scientifiques de niveau recherche, publiés ou non,
émanant des établissements d’enseignement et de
recherche français ou étrangers, des laboratoires
publics ou privés.
Evaluation of Factors Affecting Distance Perception in
Architectural Project Review in Immersive Virtual
Environments
Sabah Boustila, Antonio Capobianco, Dominique Bechmann
To cite this version:
Sabah Boustila, Antonio Capobianco, Dominique Bechmann. Evaluation of Factors Affecting
Dis-tance Perception in Architectural Project Review in Immersive Virtual Environments. The 21th
ACM Symposium on Virtual Reality Software and Technology (VRST2015), Nov 2015, Pekin, China.
�10.1145/2821592.2821595�. �hal-03243993�
Evaluation of Factors Affecting Distance Perception in Architectural Project
Review in Immersive Virtual Environments
Sabah Boustila∗ University of Strasbourg, France
Antonio Capobianco† University of Strasbourg, France
Dominique Bechmann‡ University of Strasbourg, France
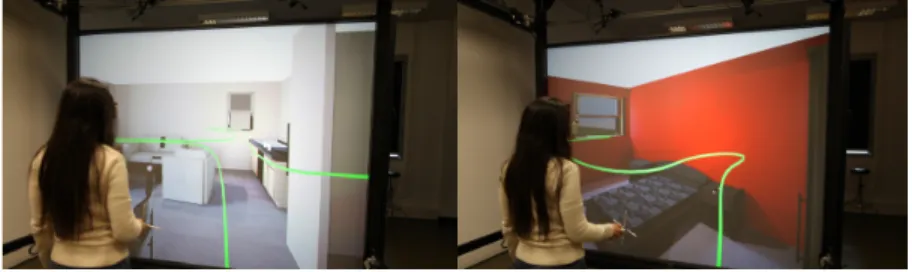
Figure 1: Example of a virtual visit in a furnished house: living room on the left and bedroom on the right. The navigation path is represented with the green breadcrumb.
Abstract
Distances are perceived as being more compressed in immersive virtual environments (IVEs) than in real environments. The goal of this study is to identify the most important factors that influence decision making and accuracy of distance perception in the con-text of architectural project reviews. Technical factors such as field of view, display devices and motion parallax were widely studied. In this paper, we have investigated other individual and contextual factors. We conducted a between-subject experiment using an im-mersive large screen display to examine the influence of the three factors: 1) the cognitive profile of the user (visual, auditory and kinesthetic - VAK), 2) the furnishing of the house, and 3) the lo-comotion speed, on distance perception. Results reveal that par-ticipants with visual profile were more accurate in distance estima-tion. Further, furnished houses were more suitable for virtual visits. The locomotion speed also seems to influence virtual visits which were better with a slow locomotion speed. Based on the results of our study, we finally present guidelines for setting up architectural project review tools which employ similar setup.
CR Categories: H.5.1. [Information Interfaces and Presentation]: Multimedia Information Systems—Artificial, augmented, and vir-tual realities, Evaluation/methodology
Keywords: Virtual reality; immersive virtual environment; vir-tual visits; architectural project review; distance estimation; dis-tance perception; cognitive profile.
∗e-mail:boustila@unistra.fr †e-mail:a.capobianco@unistra.fr ‡e-mail:bechmann@unistra.fr
1
Introduction
In recent years, architecture has tried to take advantage of virtual reality (VR) in the project review process. Several studies have used immersive virtual environments (IVEs) as a tool for project review and validation of digital mockups [Majumdar et al. 2006; Yerrapathruni et al. 2003; Wahlstr¨om et al. 2010]. This opens the way for discussing design issues using a 1:1 scale visualization of the mockup under review.
Our work is in the context of architecture, aiming to introduce VR within the process of architectural project review, to enable archi-tects and their prospects to experience the designed space before it is built. Using the VR tool that we have developed, the prospect can perform a virtual visit of the chosen house and validate the plan of the house in terms of the size and layout of rooms.
This virtual visit provides the architects an opportunity to save both money and time. However, decision making depends on the ability of the prospects to make judgements about what they see in the vir-tual environment (VE) similar to the judgements they would have made in the corresponding real environment.
Unfortunately, one of the major problems of IVEs is the perception of distances and volumes. Most of the work that has studied this problem states that distances are misperceived in VEs [Henry and Furness 1993a; Plumert et al. 2005]. Despite these studies, factors that cause this phenomenon remain unclear, and diverse.
Concerning collaborative VR tools which immerse several users, large screen displays, 3D TV screens and CAVEs are the most suit-able display devices. In our project, the architects opted for an im-mersive large screen as a display device. Thus the entire exper-iment was carried out only with an immersive large screen. The technical factors related to display devices such as field of view or quality of the stereoscopy have been explored in several research studies [Klein et al. 2009; Alexandrova et al. 2010; Creem-Regehr et al. 2005; Grechkin et al. 2010]. In our project, architects judged that calculating the interpupillary distance (IPD) and recalibrating the tool for each prospect and therefore each project review would be time consuming. Thus, due to the practical constraints of the project, we have not investigated the factor of IPD, which was kept fixed. To complete the state of the art, we investigated other impor-tant factors related to individual preferences and contextual aspects. For this study, we wanted to evaluate the influence of three factors: the cognitive profile, the furnishing condition and the locomotion
speed.
Our first factor is the cognitive profile of the user. We inspected the difference between individuals, to seek insight into the poten-tial relationship between cognitive profile and general performance during the virtual visit.
In the context of architectural project review, virtual visits could be staged in furnished or unfurnished houses. However, the presence or absence of furniture in the VE may influence the perception of distances and volumes. Thus, our second factor is the furnishing of houses.
In virtual visits, for time optimization, we preferred to fix the loco-motion speed for all the users. To explore and move inside houses, the pace of locomotion must be adapted to the context of virtual visit, since, final users 1) will visit closed spaces (houses) and 2) will have to understand the layout of the house and make decisions regarding the size of the rooms and the house as a whole(and not just walk to go to a specific location). For this purpose, our third factor is the speed of locomotion. We studied their setting and their influence on the perception of distances and volumes.
In the remainder of this paper, we first provide an overview of the existing research on the problem of distance perception in VEs. Then we introduce our method, and we explain the procedure fol-lowed in the experiment. The results of our study are reported and discussed in sections 4 and 5 respectively.
2
Related work
One of the challenges of VR technology is the perception of dis-tances and volumes. Several studies have examined this problem. Even if this issue exists in real life, the distances are more underesti-mated in VEs [Alexandrova et al. 2010; Grechkin et al. 2010]. This problem has been studied extensively in the literature to identify its causes and suggest improvements. However, display devices vary among studies which restrict the generalization of results only to the same kind of device, since display devices used in experiments can have important effects on distance estimation [Klein et al. 2009] In this section we will review some potential factors, which can influence the estimation of distances and volumes.
2.1 Inter-individual differences
Several studies have mentioned possible differences between indi-viduals in the estimation of distances and volumes. Among the fac-tors studied we can mention: gender, age, level of presence, etc. For example, Interrante et al. [2006] and Naceri and Chellali [2012] reported no difference between gender in distance estimation task when using a Head Mounted Display (HMD) and a stereoscopic screen respectively. However, Arns et Cruz-Neira [2004] men-tioned a difference between men and women in performance in lo-comotion, where women have a greater number of collisions than men. Similarly, for age, no significant difference in distance estima-tion was found with adults between 20 and 35 when using a CAVE [Murgia and Sharkey 2009]. However, a difference was noted be-tween 10 year old and adults with 3 immersive screens [Plumert et al. 2005]. The level of presence and type of personality were in-vestigated in Phillips et al. [2012]. In this work, the VE was seen through an HMD. The experimenter assessed a variety of person-ality measures and presence with questionnaires and analysed the correlation between personality, presence, and accuracy of distance estimation. The results showed no significant correlation between these three elements. It was concluded that establishing relation-ships between the analysed elements is complicated and not easy to measure.
Apart from distance estimation, Hauptman and Cohen [2011] were interested in how the VE, seen through an HMD, influences the spa-tial thinking of students with different cognitive profiles (learning styles). Results indicated an uneven influence of VE on students with different learning styles. However, this result needs further research for more explanations.
Considering the previous findings in literature [Interrante et al. 2006; Naceri and Chellali 2012; Murgia and Sharkey 2009] and because of target audience of our virtual tool not being children, in our study we try to shed light on the influence of differences between individuals in term of cognitive profile on distance percep-tion, rather than age or gender.
The project review tools are intended to be used by a large number of people which could all have different preferences for understand-ing and learnunderstand-ing, most notably different cognitive profiles. This can lead to a variability in the performance (distance and volume’s per-ception) during the project review. With this study, we aimed to obtain the same performance by all the prospects. Our goal was to propose guidelines to adapt the tool for all preferences and cus-tomize it, so that users have the same performance whatever their cognitive profile is.
2.2 Context
It is possible that differences between results in previous research come from the variability of the scenes, and the context in which studies are made. For example, Lappin et al. [2006] discussed the effects of the environment on distance perception in the real world. They found that distances are overestimated in a lobby or a hall and not on an open lawn. The result was justified by the narrow field of view restricted by walls in an indoors environment. Furthermore, the distance between the viewer and the screen of the CAVE and the parallax also appear to influence the perception of distances in VE [Bruder et al. 2015]. This study revealed a significant asymmetric effect of these two factors on the perception of distances. Unlike that study, in our experiment, the distance between the viewer and the screen has been set at 1.5m.
Another side of the influence of the context is the cognitive prob-lem, related to the interpretation of the visual stimulus. Interrante et al. [2006] have compared the perception of distances in a real environment and in a virtual replica of it visualized with an HMD. The results showed that the use of a virtual replica of the real envi-ronment leads to a good estimation of distance. Recently, in another experiment, participants estimated distance with greater errors in an unfamiliar room environment than in the replica room environment using an HMD [Phillips et al. 2012].
Likewise, the presence of some cues of familiar size can specify absolute distances [Loomis and Knapp 2003]. Frenz and Lappe [2005] have concluded in their research (using a large projection screen) that, based on optic flow estimations without a stereoscopic display, distances are only estimated up to a scale factor. A priori knowledge about the scale of the scene is thus needed to correct estimates.
In our project, the virtual visits cannot be in a replica environment because they will be in new houses (at 1:1 scale) which are not yet built. Furniture in houses are objects of familiar size that can influence the perception of distances and volumes. However, the interior design may influence the decision of the users according to their interior design preferences. Thus, using unfurnished houses could provide a neutral environment. Since each setting may or may not be of importance, we studied the effect of the furnishing on the perception of distances and volumes.
2.3 Locomotion
In this section, we will present related work that has investigated walking and the speed of locomotion in IVEs.
2.3.1 Walking
When moving, the travelled distance gives us information about the size of the environment. However, interfaces for virtual locomo-tion with a large screen do not allow physical walking, as with the HMD or in real life. With this limit, some important information that improves distance perception in VE is lost. Richardson and Waller [2007] and Kelly et al. [2014] demonstrated that body-based information (proprioceptive and vestibular) recalibrates dis-tance perception in VE and enhances disdis-tance estimations. Waller and Richardson [2008] have proved that the vestibular and propri-oceptive elements are necessary to give an effect on distance esti-mations to the locomotion. Campos et al. [2012] were interested in the information used to estimate distances, and showed that in the absence of proprioceptive information, while travelling with a wheelchair, subjects relied on vision more than vestibular informa-tion to estimate distances during the passive movement. All these studies used an HMD to allow physical walking.
From this last finding, in our VE where the locomotion is controlled through a handheld wiimote (no body-based information), the opti-cal flow (visual information) will be used in distance estimations. The work of Frenz et al. [2007] has tried to enhance the distance perception in the case of passive locomotion with a large projection screen, by adding visual information about the 3D layout of the scene (figural cues, etc.). However, no improvement was found. Probably, the setting of the optical flow itself, such as the speed, can be the reason for the underestimation of distances and volumes.
2.3.2 Speed
Palmisano [2002] proved that in a simple VE (red and cyan patterns of moving objects on a white background), when a stereoscopic dis-play is used with a rear projection screen, the speed of self-motion appears faster, and thus the speed is misperceived. However, other research found that people underestimate the speed when moving [H.Durgin 2009] or walking with a treadmill and seeing the VE through an HMD [Banton et al. 2005]. Although in our experi-ment participants were physically stationary while moving in the VE, we need to investigate the speed of locomotion, since results are different across studies.
Furthermore, the context of walking can require a variable pace. For example walking speed for visiting a place is not the same as walking to work. Typically, we walk more slowly when visiting a place, as compared to walking to work. Moreover, it is common to walk more slowly in closed places (houses) than in outdoor en-vironment. For all those reasons, we investigated the locomotion speed to provide a proper setting suitable for project review tools in indoor scenes.
3
EXPERIMENT
In our study, we carried out some virtual visits of houses. Partici-pants moved in virtual houses and were asked to estimate distances and volumes (habitability). The houses were displayed at 1:1 scale.
3.1 Method
For this experiment, we used a between-group design. The inde-pendent variables were: cognitive profile, furnishing condition and
speed. We instructed participants to evaluate distances and volumes (as explained in section 3.2).
Before starting virtual visits, we asked participants to answer the VAK questionnaire [Chislett and Chapman 2005] to determine their cognitive profile. This cognitive profile relates to the method of learning of individuals, related to their sensory perception abili-ties. This method may alter the way of comprehending the virtual environment from one individual to another, and may therefore lead to differences in the estimation of distances and volumes. Cognitive profiles assessed by the VAK are Visual, Auditory and Kinesthetic. The visual profile characterizes people who learn by the look and by observation. These people often think pictorially and learn best with visual elements such as plans and graphs. The auditory profile characterizes people who understand and learn by listening. These people react better to situations that give the opportunity to discuss and listen. The kinesthetic profile characterizes people who learn by moving and performing tasks. Learning in practical situations are best for them. We assessed the cognitive profile to investigate the influence of these three profiles on the virtual visits in general (perception and presence).
The virtual visits took place in two types of VE: furnished houses and unfurnished houses. Furniture in houses can improve the per-ception of the scale and therefore the perper-ception of distances and volumes. However, the interior design could not please all the prospects, hence decisions regarding the rooms and the house may be made based on the visual aspect and not on the size of the rooms, which is not the goal of the project review. By testing furnished and unfurnished houses, we were interested in the influence of the fur-niture on the perception of distances and volumes.
To explore the VE the speed of locomotion must be suitable to the context of virtual visits. We investigated three locomotion speeds: normal walking speed 1.1 m/s, as mentioned in previous work [Fink et al. 2007], slow walking speed 0.55 m/s, which is half the normal speed [Guan and Li 2013], and dynamic speed. For the later speed, we have implemented a technique to adapt the speed according to the number of furniture items around the user and the distance between them. When the virtual visit begins, the speed is fixed at normal speed (1.1 m/s). Once the locomotion starts, if the user is surrounded by two or more objects, and that these furniture objects are at a distance of 35 cm or less from the position of the user, then the speed decreases to a low speed. Then, further the user moves away objects (> 35 cm) and moves in a cleared space such as in a corridor, the speed increases to reach the normal speed. In the furnished condition we investigated the three speeds (normal, slow and dynamic). In the unfurnished condition we investigated only two speeds (normal and slow), since there is no furniture in the unfurnished condition to test the dynamic speed. Conditions are shown in table 1.
The aim of this study was to provide suitable settings for the project review tool. Our hypotheses were:
H1 The visual profile being the most sensitive to images and vi-sual information, our hypothesis was that participants with a vivi-sual profile will be more accurate in their estimations.
H2 The furnished houses provide familiar objects and sizes that en-hance the perception of the scale of the VE and help to understand the VE. Our second hypothesis was that furnished houses enhance the perception of distances and volumes and provide a good under-standing of the VE.
H3 The slow locomotion speed is more suitable to visit small spaces (houses) and provides enough time to understand the VE. Our third hypothesis was that slow locomotion speed leads to good percep-tion of distances and volumes.
Figure 2: The platform (In Virtuo). Right figure shows an example of our environment displayed on the screen.
3.1.1 Stimuli and apparatus
We set up eight scenes corresponding to real mockups of houses; four for each condition (furnished and unfurnished). The floor-plans were different in the two conditions but had the same shape of rooms and almost the same size of the walls. The wall sizes were between 2 and 7 meters. Four models were completely furnished (with a bed, sofa, table, chairs, etc.). For the unfurnished condition we used four unfurnished houses, rooms were empty and only ba-sic elements were present such as a toilet, washbasin, shower and doors. Virtual scenes were modeled in accordance with the mea-surements on the floorplans. Houses were created using 3DMax software, with simple textures. Realistic lighting was precomputed to avoid latency during online rendering.
All tests were performed within the virtual reality platform (In Vir-tuo)in our laboratory. The virtual reality display device that we used consisted of an immersive wall (3 m x 2.25 m) with active stereoscopic display. It provides 90◦X 70◦of horizontal and ver-tical field of view respectively to a typical user located in front of it. Participants were allowed to move to change the perspective. A tracking system based on 6 cameras was used to capture the move-ments of the user within a space of 6 m2(see figure 2) for adapt-ing the viewpoint in the VE. The trackadapt-ing system allows trackadapt-ing the position of the 3D glasses and the Ninento Wiimote interaction device. The virtual eye-point height was set corresponding to the subject’s eye height. Interocular distance was fixed to 60mm for all participants.
Our program is developed in C++ and is based on the VRJuggler library for device management.
3.1.2 Participants
50 participants took part in the experiment (39 men and 11 women), 10 in each group, as summarized in table 1. Participants were stu-dents in the computer graphics field in our university and were all voluntary. Age was between 19 and 32 years with an average of about 23 and all had normal or corrected-to-normal vision. Partici-pants had not previously performed experiments in IVEs.
3.2 Evaluation
During the experiment, we gathered the following objective and subjective information.
Conditions, Speed Slow (S) Normal (N) Dynamic (D) Furnished G1 G2 G3 Unfurnished G4 G5 X Table 1: 5 groups of participants, one in each condition.
3.2.1 Cognitive profile
We used the standard VAK (Visual, Auditory, Kinesthetic) test to assess participant’s preferred learning styles [Chislett and Chap-man 2005].
3.2.2 Spatial comprehension (SC)
We evaluated the spatial comprehension using 1) a subjective ques-tionnaire (SC1) and 2) cognitive map (SC2), figure 3.
The questions of SC1 provide indications about the functionality of the rooms (living room, bedroom and bathroom). These questions allow participants to construct a cognitive map about the space even in the absence of furniture.
Example: If you had to fit out the room as a bedroom with a large double bed of 140 X 180 cm and two bedside tables near the wall of the window, do you think that the space would be: 1) insufficient ,2), 3), 4), 5), 6), 7) sufficient.
The SC1 is a set of questions divided into four groups:
• Distance estimation: participants were asked to evaluate sev-eral dimensions: length, width of the rooms, and the ovsev-erall area of the house. This task was closed-ended with 4-ways answers, to avoid large under or over estimations and to keep answers within reasonable intervals. The answers were values in meters for wall size and in square meters for the area. The values proposed in choices were calculated with an offset of 15 % of the veridical distance. This percentage was chosen to ensure that the differences were widely over the just no-ticeable difference threshold for 3D distances [De Silva et al. 2010], while remaining in a reasonable interval. We speci-fied to participants that the veridical distance is not always the second or the third choice and that false answers can all be over/underestimated, to avoid the systematic selection of the middle values of the 4-ways answers.
Example: choose from the following propositions the dimen-sions of the room: a) 4.2 , b) 4.9, c) 5.6, d) 6.3m2.
• Size perception: a set of 7-point Likert type scale questions. We asked questions about the possibility (in term of space) to put furniture in rooms at specific places.
Example: if you had to place the wardrobe on the wall of the window, do you think that the space would be: 1) insufficient ,2), 3), 4), 5), 6), 7) sufficient.
• Feeling and ability of projection: a set of 7-point Likert type scale questions. Through these questions, we try to put the participant in specific situations and to evaluate his feeling and his ability to project into the environment.
Example: When crossing a person in the corridor, the space available would allow you to do it: 1) with difficulty ,2), 3), 4), 5), 6), 7) easily.
The last two groups of questions (Size perception and feeling and ability of projection) were elaborated with architects, the correct answers were calculated according to rules and stan-dards of construction. In France, there are norms and rules to respect in building construction. Regarding habitability, there are minimal dimensions, eg the minimum width of a corridor is 90 cm. A person needs a minimum width of 40 cm, in order to cross another person in the corridor.
Figure 3: Left figure shows the actual floorplan of a visited house. Right figure shows an example of the SC2 task: layout space and navigation path drew by a participant after the visit.
• Task difficulty (TD): a 7-point Likert type scale question. This question is asked at the end of the SC1 questionnaire. The participant judges the difficulty of the virtual visit and of the estimation task.
Example: Evaluate difficulty to visit and estimate the dimen-sions of the space : 1) easy ,2), 3), 4), 5), 6), 7) difficult. The participants answered the SC1 questionnaire during the virtual visit (more details in section Procedure).
After each visit, participants were asked to sketch the layout of spaces (SC2) and to write down the roles of the different rooms (living room, bath room, etc.), as in figure 3. On this map, they drew the path they followed during the virtual visit. The sketched map and the wayfinding were evaluated on the shape of the rooms, the accuracy of the space layouts, their proportions, their sizes, and the correctness of the visit’s order. We attributed at most one point for each element. If the answer is deemed correct we attribute one point; if there is one or two errors we attribute half a point; other-wise we attribute no point at all. By this means we measured the understanding of the visited space with a subjective note on a scale of 5.
3.2.3 Presence questionnaire (PQ)
We used the standard Witmer and Singer questionnaire [Witmer and Singer 1998], to evaluate presence. Participants described the experience in the VE through 16 Likert scale questions (scale from 1 to 7, 7 is well present). Some previous work had mentioned that presence influences distance perceptions in VE [et G. J. Kim ]. We used this evaluation to inspect this relationship in the context of an architecture virtual visit.
3.2.4 Simulator sickness questionnaire (SSQ)
We used the questionnaire developed by Kennedy and his col-leagues [Kennedy et al. 1993], to evaluate simulator sickness. The aim of this questionnaire is to verify if the different conditions have an impact in terms of simulator sickness. We also studied the in-fluence of simulator sickness on distance perception. Participants answered the SSQ twice during the experiment: one time after the first visit and a second time after the last visit.
3.2.5 Debriefing
We collected information on participant’s metric knowledge (stan-dard measure of furnitures and doors) and the methodology used to answer the spatial comprehension questionnaire during a semi-guided debriefing at the end of the experiment.
Example: 1) do you have knowledge on standard size of doors, beds, etc.
2) How did you elaborate your answers concerning : dimensions of rooms, size of furniture, etc.
3.3 Procedure
Our test on the perception of distances and volumes compared 5 conditions of virtual visits inside a house, as summarized in table 1. In each condition participants visit 4 different house scenes. Sub-jects were randomly assigned to one of the 5 experimental condi-tions. The duration of the virtual visits is about 40 minutes for the four scenes and the total duration of the experiment is 1h20 for vis-its and questionnaires.
3.3.1 Pre-experiment
Prior to the experiment, participants were asked to carefully read the instructions which explain the progress of the experiment, the locomotion technique, and the questionnaires to answer. After they had to answer the VAK test.
Then, subjects started a trial of the immersive virtual visit of a house for 5 minutes to become familiar with the device and the locomo-tion technique. The visit always starts from the entrance of the house, as in reality. Then, the path to follow is passing through the living room, kitchen, rooms then bathroom and toilet. Participants visit all the rooms. The visit is carried out with a guided locomo-tion following a predefined path represented by a green breadcrumb in the scene, as illustrated in figure 1. Subjects use a wiimote to move and only have the possibility to move forward, to stop, and to turn around on himself. To move forward, subjects use a button on the wiimote and the rotation follows the orientation of the wiimote. During the locomotion, participants were invited to explore the VE with the head motions, while when they had to answer questions, they remained stationary to avoid parallax cues. Before starting the experiment, the experimenter showed the participant a measuring tape, with exactly 1 meter in length for 10 seconds so as to get an idea of the value of one meter, and so as to have the same minimum metric knowledge to answer the questions for all participants.
3.3.2 Experiment
We used a guided locomotion to ensure that all subjects follow the same path and had approximately the same time of the virtual visit. During the visit of a room and at predefined stop points, the subject hears a beep and is left only with the possibility of looking around himself. At each stop, the experimenter started orally asking the SC1 questions corresponding to the current room, and the partic-ipants were asked to answer orally. Afterwards, the experimenter unlocks the participant so as to move on to the next room. After visiting each scene the participant tackled the SC2 corresponding to spatial organisation by sketching the house’s mockup and the navigation path.
3.3.3 Post-experiment
After only the first and the last visit the participant answers the SSQ. At the end of the experiment he answers the PQ to evaluate the locomotion technique and gives a debriefing.
4
Results
The analysis was performed on the mean values of question cate-gories (distance estimation, size perception and feeling and ability of projection), containing several questions, to be able to apply a parametric test.
For the statistical analysis, we first verified that our data fulfilled the condition of normality and homogeneity by performing the test of Shapiro-Wilk and Bartlett. Since these conditions are respected, we secondly realised multi-factorial ANOVA at a 0.05 level of sig-nificance. Our independent variables are: cognitive profile (VAK : visual (V), auditory (A) and Kinesthetic (K)), furnishing condition and speed (dynamic (D), slow (S) and normal (N)). The dependent variables are: distance estimation, size perception, feeling and abil-ity of projection and task difficulty. We also analysed the effects of speed, VAK and furnishing condition on SC2, presence (PQ) and simulator sickness (SSQ).
When the multi-factorial ANOVA showed a significant influence of the independent variables, we ran a pairwise comparison using the Tukey HSD (Honestly Significant Differences) test. The results of distance estimation, size perception and feeling and ability of pro-jection are reported systematically (even not significant) to observe the over/under estimation. Some other results are not reported in table 3, 4 and 5 when p-value is not significant (p > 0.05). The results of the VAK questionnaire reveal that we have 18 sub-jects with a visual profile, 15 subsub-jects with an auditory profile, and 17 subjects with a kinesthetic profile. They were distributed among groups as illustrated in the table 2. We did not study further the influence of the VAK distribution among groups since we found no interaction whatsoever between the dependant variables.
4.1 Distance estimation
In all the analysis of the results of distance estimation, we calcu-lated the gap with the veridical distance. If it is null, the estimation is correct. Otherwise, the evaluation is overestimated if it is pos-itive and underestimated, if it is negative. For statistical reasons we have put the same number of questions with one, two and three overestimated answers, for each questionnaire.
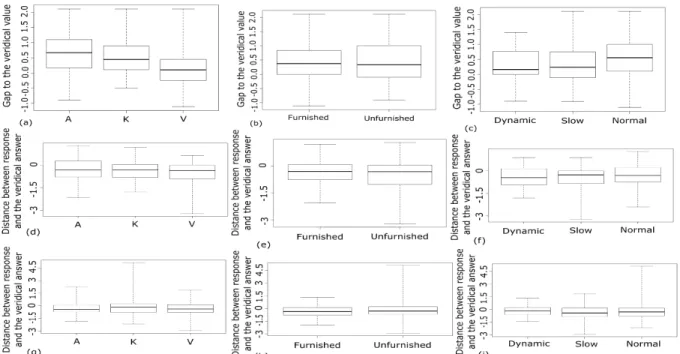
In all conditions distances were slightly overestimated, while most of the values being distributed above zero (as shown in the boxplots (a), (b) and (c), in figure 4), and between 0 and 1, which means that distances were overestimated within a maximum of 15% of the veridical distance.
The analysis shows a significant influence of VAK (see table 3: F(2, 35) = 6.369, p = 0.002) and speed (see table 5: F(2,35) = 4.796, p = 0.009) on distance estimation. The furnishing condition, however, did not have a significant influence on distance estimation (see table 4: F(1, 35) = 0.197, p = 0.657). We found no interaction between speed, VAK and furnishing condition.
Pairwise comparisons regarding the VAK showed that visual partic-ipants performed significantly better than those with auditory (p = 0.005) and kinesthetic (p = 0.046) profiles, with lower overall over-estimations (see boxplot (a) in figure 4). No difference was found between the kinesthetic and auditory profiles (p = 0.78) (see table 3 for mean values).
Likewise, speed results showed a significant difference between normal and slow (p = 0.046) and normal and dynamic (p = 0.021).
cognitive profile, Conditions D N S Fur Unfur Visual 3 6 9 9 9 Auditory 4 5 6 10 5 Kinesthetic 3 8 6 11 6 Table 2: Distribution of the cognitive profile on the independent variables: furnishing condition (Fur: furnished, Unfur: Unfur-nished) and speed (D: dynamic, N: normal, S: slow).
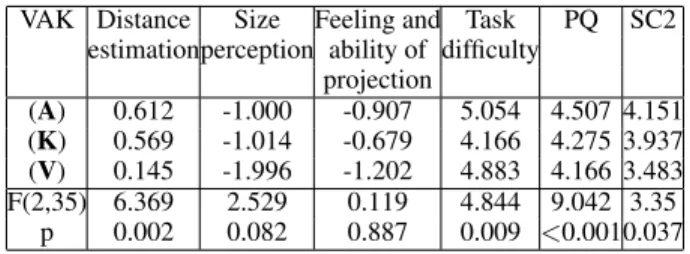
VAK Distance Size Feeling and Task PQ SC2 estimationperception ability of difficulty
projection (A) 0.612 -1.000 -0.907 5.054 4.507 4.151 (K) 0.569 -1.014 -0.679 4.166 4.275 3.937 (V) 0.145 -1.996 -1.202 4.883 4.166 3.483 F(2,35) 6.369 2.529 0.119 4.844 9.042 3.35 p 0.002 0.082 0.887 0.009 <0.0010.037 Table 3: All mean, F and p values showing the influence of the VAK profile ((V) visual, (A) auditory and (K) kinesthetic) on the dependent variables and PQ and SC2.
Furnishing Distance Size Feeling and SC2 condition estimation perception ability of projection Furnished 0.411 -1.138 -1.253 4.046 Unfurnished 0.474 -1.645 -0.468 3.565 F(1,35) 0.197 1.356 5.721 5.271 p 0.657 0.245 0.018 0.023 Table 4: All mean, F and p values showing the influence of the furnishing condition on the dependent variables and SC2.
No difference was found between the slow and dynamic speeds (p = 0.780). For the distribution, see boxplot (c) in figure 4. The overall overestimation of distance was significantly less important with the dynamic and slow speeds compared to the normal speed (see table 5 for mean values).
4.2 Size perception and feeling and ability of projec-tion
In the analysis of results we compute the distance between the cor-rect answer and the participant answer. If it is null, the estimation is proper. If it is positive, so the evaluation is overestimated and if it is negative, the evaluation is underestimated.
In contrast to distance estimation, size perception and feeling and ability of projectionoverall values show a tendency of the subjects to underestimate sizes and the habitability of the houses. As shown in the boxplots (see figure 4), most of the values are above zero for distance estimation (boxplot (a)) and below zero for size per-ceptionand feeling and ability of projection (boxplots (d) and (g) respectively).
No independent variable had a significant influence on the size per-ception. Only the independent variable furnishing condition had a significant influence on the feeling and ability of projection (ta-ble 4: F(1,35) = 5.721, p = 0.018). Participants were less prone to underestimate the habitability with unfurnished environment than with furnished environment (p = 0.044).
4.3 SC2
As for SC2, values reported represent mean notes on the scale of 5 (5 is the best note). The analysis shows that both VAK and the furnishing conditionhad a significant influence with F(2,35) = 3.35, p = 0.037 and F(1,35)= 5.271, p = 0.023 respectively (see tables 3 and 4). The speed had no influence on SC2.
Concerning the VAK, auditory subjects performed significantly bet-ter than the visual ones (p = 0.011). However, pairwise comparisons showed no differences between visual and kinesthetic (p = 0.16) and kinesthetic and auditory (p = 0.85).
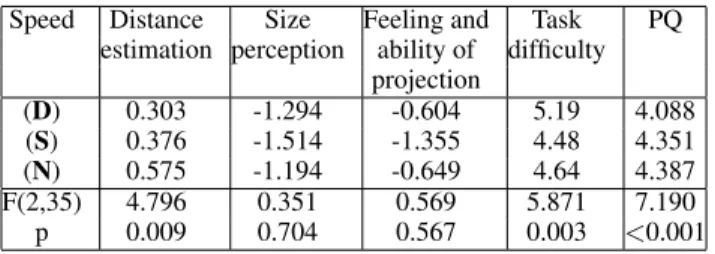
fur-Speed Distance Size Feeling and Task PQ estimation perception ability of difficulty
projection (D) 0.303 -1.294 -0.604 5.19 4.088 (S) 0.376 -1.514 -1.355 4.48 4.351 (N) 0.575 -1.194 -0.649 4.64 4.387 F(2,35) 4.796 0.351 0.569 5.871 7.190 p 0.009 0.704 0.567 0.003 <0.001 Table 5: All mean, F and p values showing the influence of the speed ((D) dynamic, (S) slow and (N) normal) on the dependent variables and PQ.
nished condition (mean note of 4.046/5) than in the unfurnished condition (mean note of 3.565/5); see table 4.
4.4 Task difficulty
On average, the task difficulty was estimated as being relatively high, with an overall mean value of 4.77 on a scale of 7 (7 is being difficult).
The results showed that VAK (table 3: F(2,35) = 4.844, p = 0.009) and Speed (table 5: F(2, 35) = 5.871, p = 0.003)) had a significant influence on the subjectively estimated difficulty of the virtual visit task. The furnishing condition has no significant influence on the task difficulty. Contrary to our expectations, having some furniture in the environment was not perceived as an asset for the task of distance estimation by the participants.
Pairwise comparisons revealed that participants with visual (p = 0.020) or auditory profiles (p = 0.042) evaluated task difficulty as being significantly more difficult than kinesthetic profile. No dif-ference was found between visual and auditory (p = 0.988). For the speed, the dynamic speed was perceived as a disturbing by the subjects. Pairwise comparisons showed a significant difference between dynamic and slow (p = 0.004) and dynamic and normal speeds(p = 0.033). However, difference between slow and normal speeds was not significant (p = 0.732).
4.5 SSQ and PQ
None of the independent variables had a significant influence on the SSQ. The global simulation sickness evaluation showed minimal symptoms (between 5-10) throughout the tests, with a score of 6.85 and 9.98 for the first and the second SSQ respectively.
Concerning the level of presence (PQ), presence was a note on the scale of 7 (7 is well present). No significant effect was found with the furnishing condition. However, both VAK (F(2,35) = 9.042, p < 0.001) and speed (F(2,35) = 7.19, p < 0.001 ) had a significant effect (see tables 3 and 5 respectively).
As assessed by pairwise comparisons, visual participants reached a significantly lower level of presence (p = 0.02) when compared to the auditory participants. The difference between kinesthetic and auditory was closed to significant with a low p-value (p = 0.053). No difference was found between visual and kinesthetic (p = 0.936). The level of presence reached by the participants was significantly lower with dynamic speed when compared to slow (p = 0.015) and normal speeds (p = 0.012). No difference was found between slow and normal speeds (p = 0.992).
5
Discussion
5.1 Spatial Comprehension
The results indicate that the estimation of distances and volumes is different according to the questions. With distance estimation, distances were overestimated, whereas, with size perception and feeling and ability of projection, distances and volumes were un-derestimated. Several interpretations are possible.
Our results confirm earlier findings, showing that the estimation of distance and the accuracy are dependent on the applied measure-ment method and, notably, how participants express the perceived distance [Richardson and Waller 2007; Grechkin et al. 2010]. In our experiment, for distance estimation participants chose one re-sponse among four to estimate the size of the rooms, whereas, with size perceptionand feeling and ability of projection, the participant has to imagine situations, and based on the perceived distance, he gives the answer. This difference in the manner to interpret the per-ceived distance creates the difference in accuracy between methods. Further, the difference in accuracy between questions, can be re-lated to the strategy used to give answers. The strategy used to estimate distances and volumes was not the same between a quan-tification (distance estimation) and a projection in the VE (size per-ception, feeling and ability of projection). We confirm this in the results of debriefing. The majority of participants reports using a computational strategy to calculate the veridical distance for dis-tance estimation. They try to imagine a segment of one meter, or a segment equivalent to their height along the wall, and make calculations. Dissimilar to distance estimation, for size perception and feeling and ability of projection, participants reported project-ing into the environment and try to imagine the situations requested to give an answer.
The computational strategy based on participant’s height or a seg-ment of one meter, and not on the size of the furnitures present in the scene in the case of furnished houses, probably explains why the furnishing conditiondid not had an effect on distance perception. Another possible reason for this difference, could be the display device used. Several participants mentioned the lack of visibility of the floor around them during debriefing. Having used a large screen without a projection on the ground, this could create a problem of visibility: the participant in front of the screen cannot see the part of the scene between him and the screen. Specifically, for distance estimationthe participant can turn to see the size of the wall or the object to estimate its size. For the size perception and feeling and ability of projection, the participant moves in rooms but cannot see the full volume of the room because of the lack of projection on the ground, and therefore, underestimates the volumes.
Our result of overestimation of distance estimation questions is consistent with the earlier finding in [Zikic 2007a] which has al-most the same configuration. In this study, dimensions of rooms in a house, width and length indicated in feet, were also overestimated with a wide-screen display.
Finally, it is also important to consider the IPD. In this study, the IPD was fixed for all participants to 60mm rather than the average of 63mm, but he remains in the middle values of the range of adults IPDs (50-70mm) [Dodgson 2004]. However, this difference corre-sponds to approximately to a 5% difference in distance which may have contributed the misperception of distances. Therefore, IPD need to be further investigated in the future.
Figure 4: (a), (b) and (c) Boxplots of the results of distance estimation per cognitive profile, furnishing condition and speed respectively. (d), (e) and (f) Plots of the results of size perception per cognitive profile, furnishing condition and speed respectively. (g), (h) and (i) Plots of the results of feeling and ability of projection per cognitive profile, furnishing condition and speed respectively. The y axis represent the difference between response and the veridical answer.
5.2 Cognitive profile
In VAK learning styles, subjects with visual profile prefer images and visual representations to understand. During debriefing, partic-ipants mentioned using a computational strategy for distance esti-mation. Computing distances based on visual elements make the tasks easy and effective for participants with a visual profile. Re-sults showed that they were accurate in distance estimation, com-pared to auditory and kinesthetic profiles, which confirms our first hypothesis. During virtual visits, participants with a visual profile rely on visual elements and information present in the scene. They do not accept easily visual incoherence between the real and virtual world. This sensitivity to a visual display does not allow them to project and to feel present in the VE. Thus, as shown by the results, they found the virtual visits more difficult, and were less present than the auditory and kinesthetic profiles.
Subjects with the kinesthetic profile learn through moving, doing and touching. Our results showed that participants with a kines-thetic profile found the task of virtual visit easy, compared to the au-ditory and visual profiles. Exploring and moving in the VE seemed to help them. Further, moving allowed them to easily build a cog-nitive map of the environment and they had a good result in SC2. However, the lack of physical moving does not allow them to feel present in the VE. Alike, the passive locomotion does not provide them enough information to estimate distances. Thus, they were less accurate in distance estimation.
Subjects with the auditory profile are sensitive to auditory informa-tion. Even if there was no verbal instructions or sound during the virtual visit, our results showed that participants with the auditory profile were well present compared to the other profiles. We can explain this result by the nature of the auditory profile. Unlike the visual and kinesthetic profiles, participants with the auditory pro-file are less sensitive to visual (rendering) and motion incoherence between the real and virtual environments. This allowed them to
accept and to project into the VE easily. Likewise, their good sense of presence, helps them to understand the environment and to build an accurate cognitive map of the VE. As shown by the results, they had a good score in the SC2.
We did not find results about investigating the influence of the cog-nitive profile on the performance in VE in the literature, to do com-parison with our results. As we have assumed, a cognitive profile has several impacts on performance in virtual visits. Therefore, we suggest that this factor is an interesting topic and should be explored further.
5.3 Furnishing conditions and speed
We tested two environments to see the importance of furniture in the scene. Results showed that furnished and unfurnished houses provide the same performance in distance estimation and size per-ception. Nevertheless, participants in furnished houses had a better spatial comprehension than those in unfurnished houses. The score of SC2 was better in furnished condition. Thus, results support our second hypothesis, as we expected the presence of furniture gives a meaning to the different parts of the house (living room, bed room, etc.) and so, helps to remember the environment after the virtual visit.
Results showed that slow and dynamic speeds had same perfor-mance in distance estimation, size perception and feeling and abil-ity of projection. However, the slow speed provided a good level of presence, further the task of virtual visit was easier. This confirms our third hypothesis, that slow speed is more suitable for virtual lo-comotion in houses. As for dynamic speed, participants reported, in debriefing, that the technique to accelerate and decelerate was slightly brutal. Therefore, they were less present. Improvements such as adopting efficient algorithm for speed adaptation to the en-vironment as in [Argelaguet 2014], may enhance the effectiveness of dynamic speed in virtual visits.
From the present investigation, we have driven some guidelines for project’s review tool:
1) Furnished houses are better for virtual visits. They provide the same performance in distance and size perception compared to the unfurnished houses and provide a better spatial comprehension. The perception of the habitability (feeling and ability of projection) will be investigated and improved in a future work.
2) A slow speed of 0.55 m/s is suitable for virtual visits in archi-tectural environments. It facilitates the task of distance estimation and leads to good estimations. Further, it provides a good level of presence.
6
Conclusion and future work
This paper reports an experiment that evaluates virtual visits in ar-chitectural environments (indoor scenes), according to several cri-teria. The aim was to identify and shed light on the factors affecting virtual visits, specifically, the perception of distances and volumes. We identified and investigated three factors: cognitive profile, the furnishing of the houses, and the locomotion speed.
Consistent with previous studies, our results showed a difference in accuracy between metric questions (distance estimations), and questions that require a projection into the virtual environment. Distances were overestimated when assessing in a metric unit (me-ter) and underestimated when the task was to judge the habitability. Furthermore, strategies used and cognitive profile had an influence on the perception of distances and volumes and seem to have an im-portant effect on virtual visits in general. Thus, the cognitive profile is an important topic for future research.
In future work we propose to investigate if adding effects according to the cognitive profile enhance the virtual visit and the perception of distances and volumes.
We suggest to investigate:
1) The improvement of the level of presence by comparing different level of realism for visual profile, and adding some tasks to do for the kinesthetic profile.
2) The strategy used to estimate distances and accuracy of estima-tions by adding step sounds for auditive profile.
Through this study, we sought to find appropriate settings for our project’s review tool. From our results, the furnished houses seem more suitable for virtual visits since they allow to understand the space and provide a good perception of distance. Likewise, slow speed helps the perception of distances and volumes and gives less overestimation in distance estimations. Further, it provides a good presence.
References
ALEXANDROVA, I. V., TENEVA, P. T.,DE LAROSA, S., KLOOS, U., B ¨ULTHOFF, H. H.,ANDMOHLER, B. J. 2010. Egocentric distance judgments in a large screen display immersive virtual environment. In Proceedings of the 7th Symposium on Applied Perception in Graphics and Visualization, ACM, APGV ’10, 57– 60.
ARGELAGUET, F. 2014. Adaptive navigation in virtual environ-ments. In IEEE Symposium on 3D User Interfaces.
ARNS, L.,ANDCRUZ-NEIRA, C. 2004. Effects of physical and virtual rotations and display device on users of an architectural walkthrough. In Proceedings of the 2004 ACM SIGGRAPH In-ternational Conference on Virtual Reality Continuum and Its Ap-plications in Industry, ACM, 104–111.
BANTON, T., STEFANUCCI, J., DURGIN, F., FASS, A., AND
PROFFITT, D. 2005. The perception of walking speed in a virtual environment. Presence: Teleoper. Virtual Environ. 14, 4 (Aug.), 394–406.
BRUDER, G., ARGELAGUET SANZ, F., OLIVIER, A.-H., AND
L ´ECUYER, A. 2015. Distance Estimation in Large Immersive Projection Systems, Revisited. In IEEE Virtual Reality. CAMPOS, J., BUTLER, J.,ANDB ¨ULTHOFF, H. 2012.
Multisen-sory integration in the estimation of walked distances. Experi-mental Brain Research 218, 4, 551–565.
CHISLETT, V., AND CHAPMAN, A., 2005. Vak learning styles self-assessment questionnaire.
CREEM-REGEHR, S. H., WILLEMSN, P., GOOCH, A. A., AND
THOMPSON, W. B. 2005. The Influence of Restricted Viewing Conditions and Egocentric Distance Perception: Implications for Real and Virtual environments. Perception 34, 191–204. DESILVA, D., FERNANDO, W., WORRALL, S., YASAKETHU,
S.,ANDKONDOZ, A. 2010. Just noticeable difference in depth model for stereoscopic 3d displays. In Multimedia and Expo (ICME), 2010 IEEE International Conference on, 1219–1224. DODGSON, N. A. 2004. Variation and extrema of human
inter-pupillary distance. In Proc. SPIE 5291, 36–46.
DODGSON, N. A. 2009. Variation and extrema of human inter-pupillary distance. Current Directions in Psychological Science 18, 43–47.
DRETTAKIS, G., ROUSSOU, M., RECHE, A.,ANDTSINGOS, N. 2007. Design and evaluation of a real-world virtual environment for architecture and urban planning. Presence: Teleoper. Virtual Environ. 16, 3, 318–332.
DUNSTON, ., ARNS, L., MCGLOTHLIN, J., LASKER, G., AND
KUSHNER, A. 2007. An immersive virtual reality mock-up for design review of hospital rooms. 7th International Conference on Construction Applications of Virtual Reality, 22–23.
ETG. J. KIM, S. L. Effects of visual cues and sustained attention on spatial presence in virtual environments based on spatial and object distinction.
FINK, P. W., FOO, P. S.,ANDWARREN, W. H. 2007. Obstacle avoidance during walking in real and virtual environments. ACM Trans. Appl. Percept. 4, 1.
FRENZ, H.,ANDLAPPE, M. 2005. Absolute travel distance from optic flow. Vision Research 45, 13, 1679 – 1692.
FRENZ, H., LAPPE, M., KOLESNIK, M., ANDB ¨UHRMANN, T. 2007. Estimation of travel distance from visual motion in virtual environments. ACM Trans. Appl. Percept. 4, 1.
GRECHKIN, T. Y., NGUYEN, T. D., PLUMERT, J. M., CREMER, J. F., AND KEARNEY, J. K. 2010. How does presentation method and measurement protocol affect distance estimation in real and virtual environments? ACM Trans. Appl. Percept. 7, 4, 26:1–26:18.
GUAN, Y., ANDLI, C.-T. 2013. A robust speed-invariant gait recognition system for walker and runner identification. In in Proc. the 6th IAPR International Conference on Biometrics (ICB’13),, IAPR, 1–8.
GUILFORD., J. P. 1956. The guilford-zimmerman aptitude sur-vey. The Personnel and Guidance Journal 35, 219–223.
HAUPTMAN, H.,ANDCOHEN, A. 2011. The synergetic effect of learning styles on the interaction between virtual environments and the enhancement of spatial thinking. Computers and Educa-tion 57, 3, 2106 – 2117.
H.DURGIN, F. 2009. When walking makes perception better. Cur-rent Directions in Psychological Science 18, 43–47.
HENRY, D.,ANDFURNESS, T. 1993. Spatial perception in virtual environments: Evaluating an architectural application. In Pro-ceedings of the 1993 IEEE Virtual Reality Annual International Symposium, IEEE Computer Society, VRAIS ’93, 33–40. HENRY, D.,ANDFURNESS, T. 1993. Spatial perception in virtual
environments: Evaluating an architectural application. In Pro-ceedings of the 1993 IEEE Virtual Reality Annual International Symposium, IEEE Computer Society, VRAIS ’93, 33–40. INTERRANTE, V., RIES, B.,ANDANDERSON, L. 2006. Distance
perception in immersive virtual environments, revisited. In Vir-tual Reality Conference, 2006, IEEE Computer Society, 3–10. KELLY, J. W., HAMMEL, W. W., SIEGEL, Z. D.,ANDSJOLUND,
L. A. 2014. Recalibration of perceived distance in virtual en-vironments occurs rapidly and transfers asymmetrically across scale. IEEE Transactions on Visualization and Computer Graph-ics 20, 4, 588–595.
KENNEDY, R. S., LANE, N. E., BERBAUM, K. S.,ANDLILIEN
-THAL, M. G. 1993. Simulator sickness questionnaire: An en-hanced method for quantifying simulator sickness. The Interna-tional Journal of Aviation Psychology 3, 3, 203–220.
KLEIN, E., SWAN, J., SCHMIDT, G., LIVINGSTON, M., AND
STAADT, O. 2009. Measurement protocols for medium-field distance perception in large-screen immersive displays. In Vir-tual Reality Conference, 2009. VR 2009. IEEE, 107–113. LAPPIN, J., SHELTON, A.,ANDRIESER, J. 2006. Environmental
context influences visually perceived distance. Perception and Psychophysics 68, 4, 571–581.
LOOMIS, J.,ANDKNAPP, J. 2003. Visual perception of egocentric distance in real and virtual environments. Virtual and Adaptive Environments: Applications, Implications, and Human Perfor-mance Issues.
MAJUMDAR, T., FISCHER, M. A., AND SCHWEGLER, B. R. 2006. Conceptual Design Review with a Virtual Reality Mock-Up Model. Building on IT: Joint International Conference on Computing and Decision Making in Civil and Building Engi-neering 17, 3, 2902–2911.
MOHLER, B. J., CREEM-REGEHR, S. H., AND THOMPSON, W. B. 2006. The influence of feedback on egocentric distance judgments in real and virtual environments. In Proceedings of the 3rd Symposium on Applied Perception in Graphics and Visu-alization, ACM, APGV ’06, 9–14.
MURGIA, A.,ANDSHARKEY, P. 2009. Estimation of distances in virtual environments using size constancy. International Journal of Virtual Reality 8, 1, 67–74.
NACERI, A., ANDCHELLALI, R. 2012. The effect of isolated disparity on depth perception in real and virtual environments. In Virtual Reality Short Papers and Posters (VRW), 2012 IEEE, 107–108.
NACERI, A., CHELLALI, R., DIONNET, F., AND TOMA, S. 2009. Depth perception within virtual environments: A compar-ative study between wide screen stereoscopic displays and head mounted devices. In Future Computing, Service Computation,
Cognitive, Adaptive, Content, Patterns, 2009. COMPUTATION-WORLD ’09. Computation World:, 460–466.
NACERI, A., CHELLALI, R., DIONNET, F., AND TOMA, S. 2009. Depth perception within virtual environments: A com-parative study between wide screen stereoscopic displays and head mounted devices. Future Computing, Service Computa-tion, Cognitive, Adaptive, Content, Patterns, Computation World 0, 460–466.
PALMISANO, S. 2002. Consistent stereoscopic information in-creases the perceived speed of vection in depth. Perception 31, 463–480.
PHILLIPS, L., INTERRANTE, V., KAEDING, M., RIES, B., AND
ANDERSON, L. 2012. Correlations between physiological re-sponse, gait, personality, and presence in immersive virtual envi-ronments. Presence: Teleoper. Virtual Environ. 21, 2, 119–141. PLUMERT, J. M., KEARNEY, J. K., CREMER, J. F., AND
RECKER, K. 2005. Distance perception in real and virtual envi-ronments. ACM Trans. Appl. Percept. 2, 3, 216–233.
RENNER, R. S., VELICHKOVSKY, B. M.,ANDHELMERT, J. R. 2013. The perception of egocentric distances in virtual environ-ments - a review. ACM Comput. Surv. 46, 2, 23:1–23:40.
RICHARDSON, A. R.,ANDWALLER, D. 2007. Interaction with an immersive virtual environment corrects users’ distance esti-mates. Human Factors 49, 3, 507–517.
SINAI, M. J., OOI, T. L.,ANDHE, Z. J. 1998. Terrain influences the accurate judgement of distance. Nature 395, 497–500. SPROSS, M. 2011. Comparing Perception of Real and Virtual
Architectural Space Using Video Game Technology. PhD thesis, Texas A&M University.
WAHLSTROM¨ , M., AITTALA, M., KOTILAINEN, H., YLI -KARHU, T., PORKKA, J.,ANDNYKNEN, E. 2010. CAVE for collaborative patient room design: analysis with end-user opin-ion contrasting method. Virtual Reality 14, 3, 197–211. WALLER, D.,ANDRICHARDSON, A. R. 2008. Correcting
dis-tance estimates by interacting with immersive virtual environ-ments: Effects of task and available sensory information. Jour-nal of Experimental Psychology: Applied 14, 1, 61–72. WITMER, B. G.,ANDSINGER, M. J. 1998. Measuring presence
in virtual environments: A presence questionnaire. Presence: Teleoper. Virtual Environ. 7, 3, 225–240.
WU, B., OOI, T. L., ANDHE, Z. J. 2004. Perceiving distance accurately by a directional process of integrating ground infor-mation. Nature 428, 73–77.
YERRAPATHRUNI, S., MESSNER, J., BARATTA, A., ANDHOR
-MAN, M. 2003. Using 4D CAD and Immersive Virtual En-vironments to Improve Construction Planning. Conference on Construction Applications of Virtual Reality, 179–192.
ZIKIC, N. 2007. Evaluating Relative Impact of VR Components Screen size, Stereoscopy and Field of View on Spatial Compre-hension and Presence in Architecture. PhD thesis, The Pennsyl-vania State University, University Park, PA, USA.
ZIKIC, N., 2007. Evaluating relative impact of vr components screen size, stereoscopy and field of view on spatial comprehen-sion and presence in architecture by.