HAL Id: hal-02380035
https://hal.archives-ouvertes.fr/hal-02380035
Submitted on 25 Nov 2020HAL is a multi-disciplinary open access
archive for the deposit and dissemination of sci-entific research documents, whether they are pub-lished or not. The documents may come from teaching and research institutions in France or abroad, or from public or private research centers.
L’archive ouverte pluridisciplinaire HAL, est destinée au dépôt et à la diffusion de documents scientifiques de niveau recherche, publiés ou non, émanant des établissements d’enseignement et de recherche français ou étrangers, des laboratoires publics ou privés.
grown by molecular beam epitaxy and emitting in the
UVA to UVC ranges
Julien Brault, Samuel Matta, Thi Huong Ngo, Mohamed Al Khalfioui, Pierre
Valvin, M Leroux, Benjamin Damilano, Maxim Korytov, Virginie Brandli,
Philippe Vennegues, et al.
To cite this version:
Julien Brault, Samuel Matta, Thi Huong Ngo, Mohamed Al Khalfioui, Pierre Valvin, et al.. Internal quantum efficiencies of AlGaN quantum dots grown by molecular beam epitaxy and emitting in the UVA to UVC ranges. Journal of Applied Physics, American Institute of Physics, 2019, 126 (20), pp.205701. �10.1063/1.5115593�. �hal-02380035�
Internal quantum efficiencies of AlGaN quantum dots grown by
molecular beam epitaxy and emitting in the UVA to UVC ranges
J. Brault1,a), S. Matta1,b), T.-H. Ngo1,2, M. Al Khalfioui1, P. Valvin2,M. Leroux1,
B. Damilano1, M. Korytov1, V. Brändli1, P. Vennéguès1, J Massies1, B. Gil2
1 : Université Côte d’Azur, CNRS, CRHEA, 06560 Valbonne, France 2 : CNRS-Université Montpellier 2, L2C, UMR 5221, 34095 Montpellier, France
AlyGa1-yN quantum dots (QDs) have been grown by molecular beam epitaxy on AlxGa1-xN
(0001) using a 2 dimensional – 3 dimensional growth mode transition that leads to the formation of QDs. QDs have been grown for Al compositions y varying between 10% and 40%. The influence the active region design (composition y, QD height and band gap difference (ΔEg)
between the AlxGa1-xN cladding layer and the AlyGa1-yN QDs) is discussed based on
microscopy, continuous wave photoluminescence (PL) and time-resolved PL (TRPL) measurements. In particular, increasing y leads to a shift of the QD emission towards shorter wavelengths, allowing covering a spectral range in the UV from 332 nm (UVA) to 276 nm (UVC) at room temperature (RT). The low temperature (LT) internal quantum efficiency of the QD ensembles was estimated from TRPL experiments at 8 K, and values between 11 % and 66 % were deduced. The highest IQE-LT are found for the QDs with the higher Al content y. Then, the PL spectrally integrated intensity ratios between RT and LT were measured to estimate the IQE of the samples at RT. The PL ratio is higher for larger ΔEg, i.e. for QDs with y of 0.1 or
0.2, but high PL intensity ratios up to 30% were also measured for QDs with larger y of 0.3 or
aElectronic mail: Julien.Brault@crhea.cnrs.fr.
0.4. RT IQE values between 5% and 20% are deduced for AlyGa1-yN QDs emitting in the
276-308 nm range.
I. INTRODUCTION
AlxGa1-xN based light emitting diodes (LEDs) can cover the ultra-violet (UV) region over
a broad spectral range from 400 nm (UVA) down to 206 nm (UVC) by adjusting the Al composition of the active region.1 As the replacement of mercury (Hg) lamps by
environmentally safe UV sources is targeted in a near future as stated by the Minamata Convention on Mercury,2 AlxGa1-xN LEDs are expected to fulfil this goal and have been
focusing an increased interest. III-nitride LEDs are mainly grown on sapphire substrates, which are well adapted to UV applications due to its large size availability, low cost and transparency. The research on deep UV LEDs has led to improved performances in the internal and external quantum efficiencies (IQE and EQE, respectively) during the past few years.3,4,5,6,7,8,9,10
Indeed, IQE as high as 85% at 280 nm,8 EQE above 20% at 275 nm,4 and optical power above 10 mW at 295 nm and 20 mA9 were reported recently. But there is still room for improvement, in particular for monolithic growth approaches of high Al content AlxGa1-xN heterostructures
grown on sapphire which are typically characterized by high threading dislocation densities (TDDs) in the 109 – 1010cm-2 range.11 Such high TDDs lead to low internal quantum efficiencies
(IQE) in AlyGa1-yN/AlxGa1-xN quantum well (QW) active regions,12,13 and to UV LEDs with
limited performances. This is often observed for molecular beam epitaxy (MBE) fabrication processes from which UV LED performances still lag behind those of metalorganic vapor phase epitaxy (MOVPE) because of the difficulty to reach TDDs below 109 cm-2. Yet, strategies to
improve the radiative efficiency of AlyGa1-yN / AlxGa1-xN heterostructures have recently been
proposed relying on the creation of in-plane confining regions based either on quantum engineering at the monolayer (ML) level,14,15,16 orusing specific growth conditions to favour
band structure potential fluctuations17 and compositional modulation using misoriented
surfaces.18 In particular, Al
yGa1-yN based active regions grown by MBE under Ga rich
conditions were introduced to promote potential fluctuations and improve the EQE of UV LEDs.19 Another possibility is the formation of AlyGa1-yN quantum dots (QDs), which is well
mastered using MBE.20,21,22 Such engineering of the active region may inhibit the transfer
towards non radiative centers of excitons leading to a weak temperature dependence of the photoluminescence emission and to higher IQE.23,24 The use of a compressively strained
AlyGa1-yN layer on top of AlN has been shown to efficiently lead to the formation of QDs, and
to get an emission in the deep UV, i.e. down to 235 nm.25 Following a similar path and using
AlxGa1-xN surfaces in order to avoid the difficulty of AlN n- and p-type doping,26 we have
shown the possibility to fabricate AlyGa1-yN QDs with a nominal concentration y of 10% on
Al0.5Ga0.5N (0001), emitting from 340 down to 314 nm at room temperature, by varying the
AlyGa1-yN amount deposited to grow the QDs.27 Furthermore, LED structures based on QDs as
active regions were recently reported using different designs, i.e. tunnel injection,28 polar20 or
semi-polar orientations,29 varying the QD heights30 and compositions,31 and have shown their
potential for UV sources covering a broad wavelength range.
In this work, several parameters have been investigated to design different AlyGa1-yN
QDs / AlxGa1-xN (0001) active regions by changing x and/or y compositions: the effect of the
lattice-mismatch, of the band gap difference between the AlxGa1-xN cladding layer and the
AlyGa1-yN QDs, of the QD Al composition y and/or of the AlyGa1-yN deposited amount. In
particular, it is found that for QDs grown on Al0.7Ga0.3N, the emission can be tuned from 332
nm down to 276 nm by increasing the Al composition y from 10% to 40%. Also, the IQE has been estimated for the different QD active regions by combining temperature dependent photoluminescence (PL) and time resolved photoluminescence measurements (TRPL) and temperature dependent photoluminescence (PL) measurements, indicating a strong dependence
with the Al composition of both the QDs and the cladding layer. IQE values varying between 5% and 20% were determined at room temperature for AlyGa1-yN QDs emitting in a wavelength
range between 276 and 308 nm.
II. EXPERIMENTAL METHOD
A. SAMPLE FABRICATION
The samples were grown on (0001) sapphire substrates by molecular beam epitaxy (MBE) in a RIBER 32 reactor using solid sources for the III-elements, and ammonia (NH3) as
nitrogen precursor except for the fabrication of the QD layers which were grown using a RIBER RF nitrogen (N2) plasma source.23 Indeed, the growth of compressively strained (Al,Ga)N
layers with an N2 source leads to a 2 dimensional (D) - 3D growth mode transition and the
formation of 3D islands during the deposition,23 contrary to the use of NH
3 as nitrogen source
for which a 2D growth mode is obtained whatever the deposited thickness.32 However, the
growth of thick (Al,Ga)N templates is performed by using NH3, because the growth conditions
of 2D layers are easier to master.33 The structure layout consists of a low-temperature GaN
buffer layer of 30 nm, followed by the deposition of a 100-150 nm thick AlN layer at 950°C, and a 800-1000 nm thick AlxGa1-xN layer with an Al composition of 50% or 70% grown at 850
or 870°C, respectively (figure 1).
Next, the QDs were formed by depositing AlyGa1-yN with an Al nominal concentration
y of 0.1, 0.2, 0.3 or 0.4. The QD composition was determined by adjusting the AlN over GaN growth rate ratio, which is equal to the Al over Ga concentration ratio in the QDs. The QDs were formed on Al0.5Ga0.5N or Al0.7Ga0.3N surfaces following a 2D - 3D growth mode
transition. A growth rate of 0.2± 0.05 ML/s and a growth temperature of 720°C ± 20°C were used. After the deposition of the AlyGa1-yN layer, an annealing step under vacuum of the QD
as described in ref. 23. The QD layer was then capped with a 30 nm AlxGa1-xN barrier having
the same composition as the template layer, and was followed by the growth of a surface uncapped QD layer identical to the buried one.
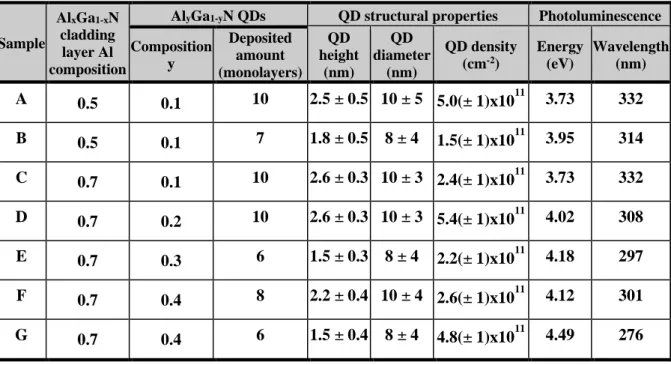
In order to investigate the influence of the active region design on the structural and optical properties of AlyGa1-yN QDs, a series of samples (labelled from A to G) have been
fabricated (table 1). The QD structures were grown by depositing AlyGa1-yN amounts with
thicknesses (corresponding to a 2D layer growth) between 6 and 10 monolayers (MLs), with 1 ML being half the c lattice parameter, i.e. between 0.253 and 0.258 nm considering a variation of the lattice parameter following a Vegard’s law between GaN and AlN. Samples A to C consist of Al0.1Ga0.9N QDs: deposited amounts equivalent to 10 MLs were used in samples A
and C, whereas for sample B only 7 MLs were deposited. The QDs were inserted in an AlxGa
1-xN cladding layer with x equals to 0.5 for samples A and B and with x equals to 0.7 for sample
C. For the other samples, the active region consists of AlyGa1-yN QDs in an Al0.7Ga0.7N cladding
layer with y varying from 10% to 40% from samples D to G, respectively. An AlyGa1-yN
deposited thickness of 10 MLs was used for sample D, of 8 MLs for sample F, and of 6 MLs for samples E and G.
B. CHARACTERIZATION METHODS
The heterostructures were characterized by X-ray diffraction (XRD) using a four-circle diffractometer to study the crystalline quality of the AlxGa1-xN layers by performing ω-scans of
the (0002) symmetric reflection and the (30-32) skew asymmetric reflection. The morphology of the uncapped QD layer was investigated by ex-situ atomic force microscopy (AFM) operating in tapping mode. In addition, cross-sectional transmission electron microscopy (TEM) measurements were performed. The TEM specimens were prepared by mechanical polishing followed by ion milling. High-angle annular dark-field imaging in scanning
transmission electron microscopy mode (STEM-HAADF) was performed using a Titan 80-300 electron microscope (300 kV), and the images have been taken along the [11-20] zone axis.
Regarding the optical characteristics, continuous wave photoluminescence (PL) measurements were carried out at room temperature (RT) and low temperature (LT), i.e. at 300 K and 8K, respectively, in a closed cycle He cryostat and using a frequency-doubled Ar laser at 244 nm (5.08 eV). The excitation power was set to 30 mW, which gives an excitation power density of 470 W/cm2 ). In particular, the ratio of the spectrally integrated PL intensity of the
QD emission was determined between LT and RT. Also, LT time-resolved PL (TRPL) measurements were performed using a mode-locked frequency-tripled titanium–sapphire laser with a wavelength of 260 nm (4.77 eV). The laser excitation power was about 200µW, with a laser spot size of 100µm, giving an average excitation power density of about 2-3 W/cm2. The
timescale between two successive laser pulses (with a value of 12 or 250 ns, depending on the sample) was selected to be longer than the decay times of the samples (ranging between 800 kHz and 82 MHz), i.e. with repetition rates ensuring a complete decay of the PL and adapted to the decay times of each sample. As detailed in the following section, the combination of TRPL and RT-LT PL measurements was used to determine and compare the IQE of the different AlyGa1-yN QD active regions.
III. RESULTS AND DISCUSSION 1. Structural properties
Broad XRD peaks with full width at half maximum (FWHM) in the range of 0.4-0.5° for the (002) reflection and in the range of 0.7-1° for the (302) reflection have been measured on the sample series. Based on our previous results obtained on Al0.5Ga0.5N and AlN layers
grown on sapphire,34,35 the TDDs in the heterostructures were estimated from these
the model used in ref. 35: screw type dislocation densities are in the 4–7x109 cm-2 range (from
the (002) peak FWHM) and mixed plus edge dislocation densities in the 3.5–7x1010 cm-2 range
(from the (302) peak FWHM). Therefore, we estimate an average TDD value of 6(± 2)x1010
cm-2 in the samples investigated.
In order to study the influence of the active region design on the structural and optical properties of the QDs, the samples present differences in either: i) the QD composition, ii) the band gap energy difference (Eg) between the QD and the cladding layer, determined from the
Al composition difference between the AlyGa1-yN QD and the AlxGa1-xN cladding layer and
referred as x-y = x - y in the following , or iii) the AlyGa1-yN deposited amount (see figure 1
and table 1).
Besides giving qualitative information about the QD formation, the RHEED Bragg spot intensity variation during growth was also investigated to determine the deposited AlyGa1-yN
critical thickness for the 2D – 3D growth mode transition (h2D-3D).36 In particular, the influence
of the lattice-mismatch (with = Δa/aAlxGa1-xN and Δa = aAlyGa1-yN - aAlxGa1-xN) was studied in
the case of the growth of AlyGa1-yN layers on Al0.7Ga0.3N (0001) while changing the QD
composition: it was found that the critical thickness h2D-3D increases from (3 ± 0.5) MLs to (4
± 0.5) MLs while going from Al0.1Ga0.9N to Al0.4Ga0.6N QDs. The main reason for this increase
is attributed to the in-plane lattice parameter difference between the deposited AlyGa1-yN and
the Al0.7Ga0.3N layer, since increasing y from 0.1 to 0.4 induces a decrease of from 1.5% for
Al0.1Ga0.9N down to 0.75% for Al0.4Ga0.6N. Indeed, the value of has a fundamental influence
on the QD formation mechanisms through the energetic balance between elastic and surface energy variation as the layer morphology undergoes the 2D – 3D growth transition.37,38 As
expected, the QD average dimensions are also modified by the different sample design and growth conditions, as summarized in table 1: the average QD heights are found to vary between 1.5 and 2.6 nm and the densities between 1.5 and 5.4x1011 cm-2. Regarding the QD mean
diameters, a weak variation was observed between 8 and 10 nm. Typical AFM images of the whole sample series are presented in figure 2. In the case of the four AlyGa1-yN QD layers grown
on Al0.7Ga0.3N (0001) (corresponding to samples C, D, E, F), STEM characterization was also
done and images are presented in figure 3. Regarding the QD density, no specific trend among the samples was observed. In fact, high QD densities (above 1011 cm-2) are systematically
observed in the case of AlyGa1-yN QDs compared to GaN QDs23 and this characteristic is
attributed to the lower surface mobility of Al adatoms compared to Ga ones. Regarding the QD average height, it was estimated from the cross-section HAADF-STEM images (figure 3) and from previously characterized samples of Al0.1Ga0.9N QDs grown on Al0.5Ga0.5N,22 as in the
case of samples A and B. The images show AlyGa1-yN QDs for y values of 0.1, 0.2, 0.3 and 0.4
in figures (a) to (d) (corresponding to samples C, D, E and F, respectively). The AlyGa1-yN
layer, which is composed of heavier material than the Al0.7Ga0.3N matrix, has a brighter
contrast. A modulation in the AlyGa1-yN layer thickness can be observed on the different images
and the maxima are attributed to the presence of QDs. In the cases of Al0.3Ga0.7N and
Al0.4Ga0.6N QDs, the difficulty to define the QD shape is seen as a consequence of the reduced
values of lower are leading to an increase of the wetting layer (WL) thickness as observed in the case of GaN QDs grown on Al0.5Ga0.5N39 compared to GaN QDs grown on AlN.36 This
feature, combined with a larger critical thickness h2D-3D when decreases, then leads to lower
aspect ratio values of the QD heights over the WL thickness as the QD Al composition increases. As a general trend, it is found that the QD height increases with larger AlyGa1-yN
deposited amounts (table 1), as already reported for the cases of AlyGa1-yN (y = 0.1) QDs grown
on AlN21 and of AlyGa1-yN (y= 0.1) QDs grown on Al0.5Ga0.5N.22
2. Optical properties
In order to investigate the efficiency of AlyGa1-yN QDs grown on AlxGa1-xN as emitters
an estimation of the QD IQE. In the section below, the main results obtained by PL are presented, followed by the TRPL results in the following section. Finally, the analysis of these measurements to estimate the AlyGa1-yN QD IQE is done in a third section.
2.1. Continuous wave photoluminescence
The optical properties of the samples were investigated by PL as presented in figures 4 and 5. The normalized PL spectra of the complete sample series measured at RT are presented in figure 4: they show the possibility to tune the emission of AlyGa1-yN QDs from the UVA
down to the UVC, with a maximum peak intensity decreasing from around 332 nm (for samples A and C), down to 276 nm (for sample G) by increasing the QD Al composition y from 10% to 40%. A comparison of the RT PL intensity between the samples has shown a decrease of the intensity by a factor of 3 to 4 from 332 nm to 301 nm. A decrease by a factor of 4 to 5 was also observed in the PL intensity from 301 nm to 276 nm. The QD peak emission wavelengths (and corresponding energies) at maximum intensity for the complete sample series are summarized in table 1. Precisely, AlyGa1-yN QDs with y equals to 0.1 enable to reach the short wavelength
region in the UVA and the long wavelength region in the UVB, between 314 and 332 nm, whereas GaN QD emission was previously shown to be limited to the UVA with shortest wavelengths around 360-370 nm.29 Further increasing the QD Al concentration y to 0.2-0.3
leads to an emission at shorter wavelengths between 297 and 308 nm. Finally, in the case of a QD composition y of 0.4, the UVC region is reached at 276 nm. Benefiting from the quantum confinement effect, a reduction of the deposited amount leads to a blue shift of the wavelength emission into the deeper UV range, as observed for samples B vs. A and G vs. F (table 1). These measurements allow determining that the main parameters influencing the AlyGa1-yN QD
properties in terms of wavelength spectral range are the Al QD composition y, and the AlyGa
1-yN deposited amount. In fact, the PL properties of QDs can be deduced from the QD height as
due to the high effective mass in nitrides, lateral confinement effects are minimized compared to confinement effects along the growth direction, in agreement with the original work on GaN QDs grown on AlN reported by T. Bretagnon et al.40
PL measurements at LT and RT were performed on the whole sample series and the results are presented in figure 5. For all the samples, two broad peaks are observed at LT. The peak at higher energy, and with the lowest intensity, corresponds to the emission from the cladding layer, and is found at around 4.6 (± 0.05) eV for Al0.5Ga0.5N and 4.9 (± 0.1) eV for
Al0.7Ga0.3N in agreement with the energy variation trend of localized band edge excitons
reported for AlxGa1-xN alloys up to x equals 70%.41 Regarding the second peak, which is the
most intense one, it originates from the exciton radiative recombination in the AlyGa1-yN QDs.
As shown in the figures, only a weak decrease of the PL intensity is found for the QD PL peak from LT to RT, whereas the PL signal of the cladding layer vanishes completely. These results confirm the strong carrier confinement in the AlyGa1-yN QDs (with y ranging from 0.1 to 0.4)
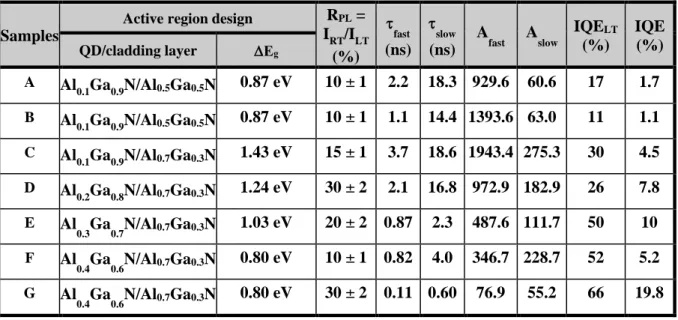
favouring radiative carrier recombination mechanisms despite the very high TDDs. The spectrally integrated PL intensity ratio (RPL) of the QD emission peak between RT and LT has
been determined and is given in table 2. Although the TDD in the samples is above 1010 cm-2,
RPL values from 0.1 up to 0.3 have been measured in the whole wavelength range. In the case
of MBE grown QWs, RPL ratios of 0.01 or below have been reported.30,23 Noteworthy, values
of RPL are observed to vary for QDs emitting in a similar energy range (i.e. samples A vs. C, B
vs. D and E vs. F) within a factor up to 3. A comparison of the different sample designs indicates that:
i) RPL tend to increase with an increase in Δx-y from 0.4 to 0.5-0.6 (i.e. with an
increase of the band gap energy difference between the QD and the cladding layer) in the case of AlyGa1-yN QDs with y = 0.1 – 0.2. Although increasing
radiative transition rates, this effect is limited in the present case since the heights of the QDs are small (< 3 nm), similarly to the case of GaN QDs discussed in ref. 29;
ii) Highest RPL ratios are found at higher energies in the 4 – 4.5 eV range, i.e. for
QD Al compositions y between 0.2 and 0.4 ;
iii) The QD height, determined by the AlyGa1-yN deposited amount, has no
significant impact on the RPL value for y ranging between 0.1 and 0.3 ;
iv) RPL ratios do not show a dependence on the QD density in the investigated range
of 1.5x10¹¹- 5.4x1011 cm-2;
v) In the case of QDs with higher Al compositions, i.e. for y = 0.3 – 0.4, a specific behaviour is observed with: 1) a strong variation of the RPL ratio as a function of
the AlyGa1-yN deposited amount, and 2) a value of RPL up to 0.3 although the
band gap energy difference between the QD and the cladding layer is relatively low, i.e. Δx-y is equal to 0.3 or 0.4.
Noteworthy, the QD densities are found within a magnitude of 3 to 10 higher than the average TDDs in our samples. Consequently, even if dislocations could potentially penetrate into the QDs, the majority of QDs would not be affected by dislocations: this is the main reason why the QD density does not play a role on the PL intensity ratios in our experiments. The situation could eventually be different in the case of QD densities similar or lower than the TDDs: in such a case, the penetration of dislocations into the QDs could significantly reduce the PL efficiency. Indeed, it was shown in TEM studies that GaN QDs can nucleate next to threading edge dislocations,42 and we have also observed such features in low GaN QD density
samples. However, the penetration of a dislocation into a QD is rarely observed since they are nucleating in the vicinity of a dislocation. Indeed, while looking at the PL results in the case of
GaN QDs on AlxGa1-xN for which densities in the 1010 cm-2 range have been obtained, we have
observed that the integrated PL ratio RPL remains above 0.1 and can even reach 0.6.23
2.2. Time-Resolved Photoluminescence
To further investigate the QD optical characteristics and to estimate the internal quantum efficiency (IQE), we have also performed TRPL measurements at LT, as presented in figure 6. For all the samples, it is found that the PL transients exhibit a two-exponential decay behaviour, which is attributed to the presence of non-radiative recombination channels unsaturated in the photo-injection conditions.43 As described in refs. 22 and 23, the time
dependence can be fitted by considering fast (τfast) and long (τslow) decay times using the
following equation: ) exp( ) exp( ) ( slow slow fast fast t A t A t I + − − = (1)
where I represents the PL intensity as a function of time(t), and Afast, Aslow correspond to fast
(non radiative) and slow (radiative) decay coefficients, respectively. The A and values of each sample are summarized in table 2. According to Iwata’s model,44 this bi-exponential
behaviour is attributed to two different types of regions within the QD plane, i.e. regions with purely radiative channels and other ones with additional and competing non-radiative recombination centers. τslow defines the radiative lifetime, while τfast is a combination of both
radiative and non-radiative lifetimes.43 Decay times within a few tens of ns down to the sub-ns
range have been measured (after deconvoluting from the width of the laser pulse) which are much shorter than typical times found for GaN QDs.22,23 A main reason is that shorter fast and
slow are observed when the QD heights get smaller, i.e. GaN QDs present heights around 4-5
nm compared to 1.5-2.6 nm in the case of the present AlyGa1-yN QDs. This is confirmed in the
present the longest fast and slow values. On the contrary, samples E and G, for which the QDs
show the smallest average heights (i.e. 1.5 nm) give the shortest lifetimes. In the cases of samples B and F, which present intermediate average QD heights (i.e. between 1.8-2.2 nm), decay time values contained between the two previous cases are found. It is known that the presence of an internal electric field in polar QD-based nitride heterostructures leads to a decrease of the electron and hole wavefunction overlap and a reduction of the oscillator strength with increasing QD heights, leading to longer PL intensity decay times.40 In addition, a low
level of surface recombination centers in the QDs would also lead to shorter fast and slow values,
and could be due to the smaller available surface area of QDs presenting lower average QD heights.
From the exponential fits of the PL decay times (figure 6), Afast and Aslow coefficients
have been determined according to equation (1). It appears that the ratios of Afast over Aslow tend
to decrease for increasing QD emission energies (table 2), similarly to the behaviour already observed when going from GaN to Al0.1Ga0.9N QDs.22 From these parameters, the IQE at LT
of the sample series have been calculated (table 2) according to the relation:43
(
fast slow)
slow slow slow fast fast A A A A LT IQE + + = − (2)IQE-LT values between 11% and 66% have been obtained. In the series of samples with Al0.1Ga0.9N QDs, a larger LT is found for higher QDs and larger Δx-y (sample C).
IQE-LT values are similar when going from Al0.1Ga0.9N to Al0.2Ga0.8N QDs with similar heights and
maintaining a large Δx-y (0.5-0.6) (samples C and D, respectively). Such results indicate that a larger confining potential is more efficient than a stronger wave function overlap in AlyGa1-yN
QDs with y values of 0.1 or 0.2. However, it clearly appears that the largest IQE-LT values are obtained for QDs with larger Al composition y, i.e. for samples E to G, for which Δx-y is moderate (0.3-0.4).
2.3. PL radiative efficiency and IQE
From the PL and TRPL measurements, it is shown that the PL efficiency at RT and the IQE-LT are larger when Δx-y is increased in the case of QDs with lower y (10 - 20%) or when the QDs have larger y compositions (30 - 40%). By combining these results, the IQE of the different AlyGa1-yN QD active regions at RT have been calculated. At this stage, it is important
to note that the determination of an absolute value of IQE in QD-based nitride materials is very difficult and precautions should be taken. From the literature, it has been shown that the determination of the IQE in QWs by temperature dependent PL measurements depends on the excitation power density.44,45 In our experiments, we have chosen an excitation power density
of 470 W/cm2. As for QWs, we found out the IQE is strongly dependent on the excitation power
density even at LT, which indicates that non-radiative recombination processes are active. A similar behavior was reported in our group in the case of GaN QDs grown on Al0.5Ga0.5N.46 In
addition, the situation in the case of QDs is even more complex than for QWs due to the fluctuations in the QDs sizes (height and diameter) and compositions, as discussed in the case of Al0.1Ga0.9N QDs grown on Al0.5Ga0.5N.27 This is the reason why we have determined the IQE
of the QDs at LT by performing TRPL measurements which are more adapted to the study of active regions made of QDs. Indeed, since we are dealing with samples presenting inhomogeneous distributions of defects and QDs at the scale of the laser spot, it appears that the situation is analogous of the situation in the samples described by Iwata et al.:43 at LT, the
laser spot shines two kinds of regions of the sample. In the first one, with a high densities of non radiative centers, the recombination dynamics are ruled by a typical decay time τfast while
in the second one (of crystalline quality weakly affected or almost non-affected by such defects) the recombination dynamics are ruled by a decay time τslow. The resulting PL intensity decay is
ruled by a two-component kinetics with proportions Afast and its complementary Aslow. Iwata et
representative of its value) while both radiative and non-radiative recombinations contribute to τfast. The interpretation of the value of τfast is then made within the context of a prey-predator
description where the predators are the non-radiative recombination centers and the relative population of preys (radiatively recombining electron-hole pairs) and predators (electron-hole pairs trapped by non-radiative recombination centers) vary according to Lotka-Volterra coupled equations. This model is valid when clear and unambiguous fitting of the decay time is achievable, which is the case here and the values of IQEs framed by this determination match very well with the time-integrated PL features. Consequently, this model appears to be well adapted to our QD based active regions. However, the major drawback of the model is its limitation to the LT range so that cross talking between both regions is not active. Therefore, we cannot use it without including complementary interactions for the high temperature range and this is the reason why we have chosen to use the temperature dependent PL measurements as a complementary method to determine the IQE of the QDs at RT.
Given the approximations made and the complexity of the QD samples, the important point of the discussion here is the comparison of the IQE as a function of the QD designs and active region characteristics, i.e. the QD composition y and the QD height along with the Al composition difference between the QDs and the cladding layer (x-y). Therefore, in order to be able to compare the QD PL characteristics as much as possible, we have chosen to keep constant the PL excitation intensity at a moderate and constant continuous wave PL excitation power density to prevent as much as possible to be in potential situations where the IQE would be decreasing due to strong non radiative recombination processes or to an important saturation of states.45 As a result, by calculating the product of the IQE-LT value determined by TRPL
with the RPL ratio between LT and RT measured by PL, we have estimated the IQE at RT of
the complete sample series as reported in table 2, following the relation: IQE = IQE-LT x IPL(RT) / IPL(LT) (3)
Comparing the IQE values, it is then possible to put into evidence some specific trends on the design of QD active regions for UV emission, as highlighted in figure 7: in this figure, the IQE at RT has been plotted as a function of the QD PL energy at 300K and x-y. Importantly, the largest IQE(i.e. corresponding to the largest dots in the figure which sizes are proportional to the square root of the IQE value) are found for QDs emitting at shorter wavelengths, i.e. in the UVB and UVC ranges for which the EQE values of LEDs are strongly decreasing. IQE values between 5% and 20% are found, as indicated by a grey line in figure 7. Specifically, in the case of QDs emitting below 300 nm (i.e. between 4.18 and 4.49 eV), the IQE is reaching 10% at 297 nm and 19.8% at 276 nm. These values are obtained despite the very large dislocation densities (> 1010 cm-2) in our structures, confirming the strong
confinement of carriers, which increases their radiative recombination.
Our results also indicate that a larger confining potential is more efficient than a stronger wave function overlap (i.e. QDs with smaller heights) in AlyGa1-yN QDs with y values of 0.1
or 0.2 (for samples A to D). However, it clearly appears that the largest IQE values are obtained for QDs with a larger Al composition y (for samples E to G). Obviously, in these cases, the radiative efficiency of the QDs does not obey the same rules than in the previous ones since they present smaller average heights and reduced chemical contrasts (Δx-y = 0.3-0.4). This behavior seems to indicate that the growth mechanisms of strained nanometer thick layers are influenced by the alloy Al composition, considering that the same growth conditions (growth rates, III / V ratio and temperature) have been used to fabricate the samples. Actually, it has been reported that thick AlxGa1-xN layers grown by plasma assisted MBE present composition
fluctuations for growth temperatures above 670°C,47 and for Al composition of 50% or below.48
Indeed, such growth temperatures and Al compositions correspond to the ones used for the fabrication of the AlyGa1-yN QDs. Furthermore, these growth mechanisms are at the origin of
localization at the nanometer scale, i.e. at the scale of a QD, and therefore could modify the QD confining potential and associated carrier confinement, leading to an improvement of the IQE.
V. CONCLUSION
In summary, AlyGa1-yN QDs with a nominal composition y varying from 10% to 40%
have been grown by MBE in AlxGa1-xN (0001) cladding layers with x equals to 0.5 or 0.7. Their
morphological and optical properties have been investigated as a function of different growth parameters including the AlyGa1-yN deposited amount, the QD Al composition y and Δx-y (i.e.
the Al composition difference between the QDs and the cladding layer related to the band gap difference Eg). It is observed that the average QD height is proportional to the deposited
amount, and that high QD densities above 1011 cm-2 are obtained whatever the QD growth
procedure details. Regarding the photoluminescence (PL) characteristics, it is shown that the integrated PL intensity temperature dependence is minimized in the case of a higher Δx-y (0.5 - 0.6) for low y values (0.1 – 0.2) and for QDs with high y values (0.3 – 0.4). In addition, time-resolved PL measurements (TRPL) performed at low temperature (LT) have evidenced a two-decay behaviour of the PL intensity, which is attributed to the presence of non-radiative recombination channels. Performing a fit of the different TRPL spectra, the IQE of the different QD designs have been determined at LT (8K) and show a strong variation from 11% to 66% among the samples. Importantly, larger IQE values have been obtained for QDs emitting at higher energies, i.e. in the UVB and UVC spectral regions. Combined with the PL intensity ratios determined between LT and RT (300K), IQE values between 5 and 20% at RT have been estimated for QDs emitting in the 276-308 nm range: as a trend, larger IQE values were found for QDs emitting at shorter wavelengths (i.e. QDs with a higher Al composition y), and for QDs capped in a cladding layer with a higher Al composition x in the case of QDs emitting at larger wavelengths (i.e. QDs with a lower Al composition y). In conclusion, this study shows the
potential of AlyGa1-yN QDs as efficient UV emitters using a single step growth process and a
basic heterostructure design with dislocation densities above 1010 cm-2. Furthermore, the QD
IQE was found to be higher in the deeper UV region, where improvements in the IQE of LEDs are mostly desirable.
ACKNOWLEDGMENTS
The authors would like to thank D. Lefebvre, A. Courville, S. Vézian and B. Poulet for their invaluable technical assistance, fruitful discussions and scientific help. The TITAN TEM experiments have been performed on the Minatec Nanocharacterisation platform at CEA-Grenoble thanks to the French METSA network. One of us, Maxim Korytov, thanks Dr Jean-Luc Rouvière for his kind help at the microscope during the experiments. This work was supported by ANR Project (ANR-14-CE26-0025) “NANOGANUV”. We also acknowledge support from GANEX (ANR-11-LABX-0014). GANEX belongs to the publicly funded “Investissements d’Avenir” program managed by the French ANR agency.
1 M. Kneissl, T.-Y. Seong, J. Han, and H. Amano, Nature Photonics 13, 233 (2019).
2 See http://www.mercuryconvention.org/
3 J. Enslin, F. Mehnke, A. Mogilatenko, K. Bellmann, M. Guttmann, C. Kuhn, J. Rass, N.
Lobo-Ploch, T. Wernicke, M. Weyers, and M. Kneissl, J. Crystal Growth 464, 185 (2017).
4 T. Takano, T. Mino, J. Sakai, N. Noguchi, K. Tsubaki, and H. Hirayama, Appl. Phys. Express
10, 031002 (2017).
5 M. Shatalov, W. Sun, R. Jain, A. Lunev, X. Hu, A. Dobrinsky, Y. Bilenko, J. Yang, G. A.
Garrett, L. E. Rodak, M. Wraback, M. Shur, and R. Gaska, Semicond. Sci. Technol. 29 084007 (2014).
6 Y. Kashima, N. Maeda, E. Matsuura, M. Jo, T. Iwai, T. Morita, M. Kokubo, T. Tashiro, R.
Kamimura, Y. Osada, H. Takagi, and H. Hirayama, Appl. Phys. Express 11, 012101 (2018).
7 N. Susilo, S. Hagedorn, D. Jaeger, H. Miyake, U. Zeimer, C. Reich, B. Neuschulz, L. Sulmoni,
M. Guttmann, F. Mehnke, C. Kuhn, T. Wernicke, M. Weyers, and M. Kneiss, Appl. Phys. Lett.
112, 041110 (2018).
8 T.-Y. Wang, C.-T. Tasi, C.-F. Lin, and D.-S. Wuu, Sci. Rep. 7, 14422 (2017).
9 M. A. Khan, N. Maeda, M. Jo, Y. Akamatsu, R. Tanabe, Y. Yamada, and H. Hirayama, J.
Mater. Chem. C 7, 143 (2019).
10 A. Knauer, T. Kolbe, J. Rass, H. K. Cho, C. Netzel, S. Hagedorn, N. Lobo-Ploch, J. Ruschel,
J. Glaab, S. Einfeldt, and M. Weyers, Jpn. J. Appl. Phys. 58, SCCC02 (2019).
11 M. H. Crawford, Semiconductors and Semimetals 96, 3 (2017).
12 K. Ban, J.-i. Yamamoto, K. Takeda, K. Ide, M. Iwaya, T. Takeuchi, S. Kamiyama, I. Akasaki,
and H. Amano, Appl. Phys. Express 4, 052101 (2011).
13 T. Kohno, Y. Sudo, M. Yamauchi, K. Mitsui, H. Kudo, H. Okagawa, and Y. Yamada, Jpn. J.
14 J. Sellés, C. Brimont, G. Cassabois, P. Valvin, T. Guillet, I. Roland, Y. Zeng, X. Checoury,
P. Boucaud, M. Mexis, F. Semond, and B. Gayral, Sci. Rep. 6, 21650 (2016).
15 X. Rong, X. Wang, S. V. Ivanov, X. Jiang, G. Chen, P. Wang, W. Wang, C. He, T. Wang, T.
Schulz, M. Albrecht, V. Jmerik, A. Toropov, V. Ratnikov, V. Kozlovsky, V. Martovitsky, P. Jin, F. Xu, X. Yang, Z. Qin, W. Ge, J. Shi, and B. Shen, Adv. Mater. 28, 7978 (2016).
16 S. M. Islam, V. Protasenko, K. Lee, S. Rouvimov, J. Verma, H. Xing, and D. Jena, Appl.
Phys. Lett. 111, 091104 (2017).
17 A. Bhattacharyya, T. D. Moustakas, L. Zhou, D. J. Smith, and W. Hug, Appl. Phys. Lett. 94,
181907 (2009).
18 M. Kaneda, C. Pernot, Y. Nagasawa, A. Hirano, M. Ippommatsu, Y. Honda, H. Amano, and
I. Akasaki, Jpn. J. Appl. Phys. 56, 061002 (2017).
19 Y. Liao, C. Thomidis, C. Kao, and T. D. Moustakas, Appl. Phys. Lett. 98, 081110 (2011).
20 J Brault, B. Damilano, A. Kahouli, S. Chenot, M. Leroux, B. Vinter and J. Massies, J. Crystal
Growth 363, 282 (2013).
21 C. Himwas, M. den Hertog, E. Bellet-Amalric, R. Songmuang, F. Donatini, Le Si Dang, and
E. Monroy, J. Appl. Phys. 116, 023502 (2014).
22 J. Brault, S. Matta, T. H. Ngo, M. Korytov, D. Rosales, B. Damilano, M. Leroux, P.
Vennéguès, M. Al Khalfioui, A. Courville, O. Tottereau, J. Massies, and B. Gil, Jpn. J. Appl. Phys. 55, 05FG06 (2016).
23 S. Matta, J. Brault, T. H. Ngo, B. Damilano, M. Korytov, P. Vennéguès, M. Nemoz, J.
Massies, M. Leroux, and B. Gil, J. Appl. Phys. 122, 085706 (2017).
24 Y. Liao, C.-k. Kao, C. Thomidis, A. Moldawer, J. Woodward, D. Bhattarai, and T. D.
Moustakas, Phys. Status Solidi C 9, 798 (2012).
25 C. Himwas, R. Songmuang, Le Si Dang, J. Bleuse, L. Rapenne, E. Sarigiannidou, and E.
26 S. Contreras, L. Konczewicz, J. Ben Messaoud, H. Peyre, M. Al Khalfioui, S. Matta, M.
Leroux,B. Damilano, J. Brault, Superlattices and Microstructures 98, 253 (2016).
27 S. Matta, J. Brault, T. H. Ngo, B. Damilano, M. Leroux, J. Massies, and B. Gil, Superlattices
& Microstructures 114, 161 (2018).
28 J. Verma, P. K. Kandaswamy, V. Protasenko, A. Verma, H. G. Xing, and D. Jena, Appl.
Phys. Lett. 102, 041103 (2013).
29 J. Brault, S. Matta, T. H. Ngo, D. Rosales, M. Leroux, B. Damilano, M. Al Khalfioui, F.
Tendille, S. Chenot, P. De Mierry, J. Massies, and B. Gil, Mater. Sci. Semicond. Process. 55, 95 (2016).
30 J. Brault, D. Rosales, B. Damilano, M. Leroux, A. Courville, M. Korytov, S. Chenot, P.
Vennéguès, B. Vinter, P. De Mierry, A. Kahouli, J. Massies, T. Bretagnon, and B. Gil, Semicond. Sci. Technol. 29, 084001 (2014).
31 J. Brault, M. Al Khalfioui, S. Matta, B. Damilano, M. Leroux, S. Chenot, M. Korytov, J. E.
Nkeck, P. Vennéguès, J. –Y. Duboz, J. Massies, and B. Gil, Semicond. Sci. Technol. 33, 075007 (2018).
32 B. Damilano, N. Grandjean, F. Semond, J. Massies, and M. Leroux, Appl. Phys. Lett. 75, 962
(1999).
33 N. Grandjean, and J. Massies, Appl. Phys. Lett. 71, 1816 (1997).
34 T. Huault, J. Brault, F. Natali, B. Damilano, D. Lefebvre, L. Nguyen, M. Leroux, and J.
Massies, Appl. Phys. Lett. 92, 051911 (2008).
35 M. Nemoz, R. Dagher, S. Matta, A. Michon, P. Vennéguès, and J. Brault, J. Cryst. Growth
461, 10 (2017).
36 B. Daudin, F. Widmann, G. Feuillet, Y. Samson, M. Arlery, and J. L. Rouvière, Phys. Rev.
B 56, R7069 (1997).
38 B. Damilano, J. Brault, and J. Massies, J. Appl. Phys. 118, 024304 (2015).
39 M. Korytov, M. Benaissa, J. Brault, T. Huault, T. Neisius, P. Vennéguès, Appl. Phys. Lett.
94, 143105 (2009).
40 T. Bretagnon, P. Lefebvre, P. Valvin, R. Bardoux, T. Guillet, T. Taliercio, B. Gil, N.
Grandjean, F. Semond, B. Damilano, A. Dussaigne, and J. Massies, Phys. Rev. B 73, 113304 (2006).
41 M. Leroux, S. Dalmasso, F. Natali, S. Helin, C. Touzi, S. Laügt, M. Passerel, F. Omnès, F.
Semond, J. Massies,and P. Gibart, phys. stat. sol. (b) 234, 887 (2002).
42 J.L. Rouvière, J. Simon, N. Pelekanos, B. Daudin, and G. Feuillet Appl. Phys. Lett. 75, 2632
(1999).
43 Y. Iwata, R. G. Banal, S. Ichikawa, M. Funato, and Y. Kawakami, J. Appl. Phys. 117, 075701
(2015).
44 S. Watanabe, N. Yamada, M. Nagashima, Y. Ueki, C. Sasaki, Y. Yamada, T. Taguchi, K.
Tadatomo, H. Okagawa, and H. Kudo, Appl. Phys. Lett. 83, 4906 (2003).
45 Y. Yamada, K. Iwamura, T. Kuronaka, N. Shinomura, T. Taguchi, H. Kudo, and H. Okagawa,
J. Light & Vis. Env. 32, 191 (2008).
46 M. Leroux, J. Brault, A. Kahouli, D. Elmaghraoui, B. Damilano, P. de Mierry, M. Korytov,
J.-H. Kim, Y.-H. Cho, J. Appl. Phys. 116, 034308 (2014).
47 V. Fellmann, P. Jaffrennou, D. Sam-Giao, B. Gayral, K. Lorenz, E. Alves, and B. Daudin,
Jpn. J. Appl. Phys. 50, 031001 (2011).
48 M. Gao, S. T. Bradley, Y. Cao, D. Jena, Y. Lin, S. A. Ringel, J. Hwang, W. J. Schaff, and L.
J. Brillson, J. Appl. Phys. 100, 103512 (2006).
50 N. Nepal, J. Li, M. L. Nakarmi, J. Y. Lin, and H. X. Jiang, Appl. Phys. Lett. 87, 242104
Figure captions:
FIG. 1. Schematics of the QD sample structure including the initial growth of a 30 nm-thick GaN buffer layer on sapphire, followed by the growth of a 100-150 nm-thick AlN layer and a 800-1000 nm-thick AlxGa1-xN cladding layer. The active region is made of an AlyGa1-yN QD
plane (capped by a 30 nm-thick AlxGa1-xN layer) and a final AlyGa1-yN QD plane at the surface.
Depending on the sample, the Al concentration x is equal to 0.5 or 0.7 and to 0.1, 0.2, 0.3 or 0.4 for the Al QD composition y.
FIG. 2. Atomic force microscopy images (500x500 nm2) of Al
yGa1-yN QDs for the complete
sample series from (a) sample A to (g) sample G.
FIG. 3. High-angle annular dark-field imaging in scanning transmission electron microscopy mode images of AlyGa1-yN QDs grown in an Al0.7Ga0.3N (0001) cladding layer for an Al
composition y equals to: a) 0.1 (sample C), b) 0.2 (sample D), c) 0.3 (sample E) and d) 0.4 (sample F).
FIG. 4. Normalized photoluminescence spectra measured at RT of AlyGa1-yN QDs for the whole
sample series.
FIG. 5. Photoluminescence spectra measured at LT (thin lines) and RT (bold lines) of the AlyGa1-yN QD sample series for (a) samples A to D and (b) samples E to G.
FIG. 6. Time-resolved photoluminescence spectra (diamonds) recorded at LT of the AlyGa1-yN
QDs sample series for (a) samples A to D and (b) samples E to G. The bold lines in the figures are fits using equation (1).
FIG. 7. (a) Internal quantum efficiency at RT (IQE) of the QD sample series (from A to G) as a function of the photoluminescence energy and the Al composition difference between the QDs and the cladding layer (x-y). The size of each dot is proportional to the square root of the IQE of each QD sample. The vertical and horizontal lines are connecting the dots to the values referring to the PL energy and x-y associated to each sample. The grey line is a guide for the eyes. (b) Variation of the PL emission energy as a function of QD height and the composition difference x-y.
Table 1. Description of the QD sample series: aluminum composition in the AlxGa1-xN
cladding layer and AlyGa1-yN QDs, deposited amount of AlyGa1-yN, structural properties
of the QDs (average dimensions and densities determined by combining AFM and TEM measurements) and photoluminescence emission energy and corresponding wavelength measured at room temperature (RT).
Sample
AlxGa1-xN
cladding layer Al composition
AlyGa1-yN QDs QD structural properties Photoluminescence
Composition y Deposited amount (monolayers) QD height (nm) QD diameter (nm) QD density (cm-2) Energy (eV) Wavelength (nm) A 0.5 0.1 10 2.5 ± 0.5 10 ± 5 5.0(± 1)x1011 3.73 332 B 0.5 0.1 7 1.8 ± 0.5 8 ± 4 1.5(± 1)x1011 3.95 314 C 0.7 0.1 10 2.6 ± 0.3 10 ± 3 2.4(± 1)x1011 3.73 332 D 0.7 0.2 10 2.6 ± 0.3 10 ± 3 5.4(± 1)x1011 4.02 308 E 0.7 0.3 6 1.5 ± 0.3 8 ± 4 2.2(± 1)x1011 4.18 297 F 0.7 0.4 8 2.2 ± 0.4 10 ± 4 2.6(± 1)x1011 4.12 301 G 0.7 0.4 6 1.5 ± 0.4 8 ± 4 4.8(± 1)x1011 4.49 276
Table 2. Summary of the main optical characteristics of the AlyGa1-yN QD sample series
determined by PL and TRPL: the PL spectrally integrated intensity ratio (RPL) between
LT and RT, the slow (slow) and fast (fast) decay times and Afast and Aslow coefficients
deduced from the TRPL decay times, the low temperature (LT) internal quantum
efficiency (IQELT) deduced from ref. 44 and the IQE of the QDs determined by the
product of IQELT by RPL. The theoretical band gap energy difference between the QD and
the cladding layer (Eg) given in the table has been determined from ref. 50.
Samples
Active region design RPL =
IRT/ILT (%) fast (ns) slow (ns) A fast Aslow IQELT (%) IQE (%)
QD/cladding layer Eg
A Al 0.1Ga0.9N/Al0.5Ga0.5N 0.87 eV 10 ± 1 2.2 18.3 929.6 60.6 17 1.7 B Al 0.1Ga0.9N/Al0.5Ga0.5N 0.87 eV 10 ± 1 1.1 14.4 1393.6 63.0 11 1.1 C Al 0.1Ga0.9N/Al0.7Ga0.3N 1.43 eV 15 ± 1 3.7 18.6 1943.4 275.3 30 4.5 D Al 0.2Ga0.8N/Al0.7Ga0.3N 1.24 eV 30 ± 2 2.1 16.8 972.9 182.9 26 7.8 E Al 0.3Ga0.7N/Al0.7Ga0.3N 1.03 eV 20 ± 2 0.87 2.3 487.6 111.7 50 10 F Al 0.4Ga0.6N/Al0.7Ga0.3N 0.80 eV 10 ± 1 0.82 4.0 346.7 228.7 52 5.2 G Al 0.4Ga0.6N/Al0.7Ga0.3N 0.80 eV 30 ± 2 0.11 0.60 76.9 55.2 66 19.8
FIG. 1.
FIG. 2.
FIG. 4.
3.4 3.6 3.8 4.0 4.2 4.4 4.6 4.8
0.0
0.2
0.4
0.6
0.8
1.0
A
B
C
D
F
E
Normali
zed PL I
ntensity
G
360340 320 300 280
260
Wavelength (nm)
Energy (eV)
FIG. 5. 250 260 270 280 290 300 0 10 20 30 260 280 300 320 340 0 10 20 30 260 280 300 320 0 10 20 30 40 Int. x3 Int. x10 sample G sample F Int. x3 Int. x5 sample E PL I n te n s ity (arb . u n it) Wavelength (nm) (a) (b) Wavelength (nm) PL I n te n s ity (arb . u n it) 260 280 300 320 340 0 10 20 260 280 300 320 340 360 380 0 20 40 260 280 300 320 340 0 6 12 260 280 300 320 340 360 380 0 20 40 60 sample D Int. x3 Int. x5 sample C sample B Int. x6 Int. x20 Int. x10 Int. x50
FIG. 6. time (ns) PL I n te n s ity (arb . u n it) (a) (b) PL I n te n s ity (a rb . u n it) time (ns) 0 20 40 60 80 100 120 140 160 180 200 101 102 1030 20 40 60 80 100 120 140 160 180 200 101 102 103 0 20 40 60 80 100 101 102 103 0 20 40 60 80 100 101 102 103 sample D sample C sample B sample A 0 2 4 6 8 10 102 0 2 4 6 8 10 102 1030 2 4 6 8 10 102 103 sample G sample F sample E
FIG. 7. 3.6 3.8 4.0 4.2 4.4 4.6 0 5 10 15 20 0.6 0.50.4 0.3 A B C D E F G x-y IQ E (% ) PL En ergy (eV) 3.63.8 4.0 4.2 4.4 4.6 1.5 1.8 2.1 2.4 2.7 0.6 0.5 0.40.3 A B C D E F G x-y QD he igh t (n m) PL En ergy (eV)