HAL Id: hal-01252995
https://hal-amu.archives-ouvertes.fr/hal-01252995
Submitted on 2 Jan 2017HAL is a multi-disciplinary open access
archive for the deposit and dissemination of sci-entific research documents, whether they are pub-lished or not. The documents may come from teaching and research institutions in France or abroad, or from public or private research centers.
L’archive ouverte pluridisciplinaire HAL, est destinée au dépôt et à la diffusion de documents scientifiques de niveau recherche, publiés ou non, émanant des établissements d’enseignement et de recherche français ou étrangers, des laboratoires publics ou privés.
Study of hydrogen isotopes behavior in tungsten by a
multi trapping macroscopic rate equation model
E.A. Hodille, Yves Ferro, Nicolas Fernandez, Charlotte Becquart, Thierry
Angot, Jean-Marc Layet, Régis Bisson, Christian Grisolia
To cite this version:
E.A. Hodille, Yves Ferro, Nicolas Fernandez, Charlotte Becquart, Thierry Angot, et al.. Study of hydrogen isotopes behavior in tungsten by a multi trapping macroscopic rate equation model. Phys-ica Scripta, IOP Publishing, 2016, T167, pp.014011. �10.1088/0031-8949/2016/T167/014011�. �hal-01252995�
ABSTRACT NUMBER A122 P-97 Study of Hydrogen Isotopes behavior in tungsten by a multi trapping macroscopic
rate equation model
E. A. Hodillea,*, Y. Ferrob, N. Fernandezb, C. S. Becquartc, T. Angotb, J. M. Layetb, R.
Bissonb, C. Grisoliaa
a
CEA, IRFM, F-13108 Saint Paul lez Durance, France
b
Aix-Marseille Université, CNRS, PIIM, UMR 7345, 13397 Marseille, France
c Université Lille I, ENSCL, UMET, UMR 8207, 59655 Villeneuve d’Ascq cedex France
Abstract
Density Functional Theory studies show that in tungsten a mono vacancy can contain up to 6 Hydrogen Isotopes (HIs) at 300K with detrapping energies varying with the number of HIs in the vacancy. Using these predictions, a multi trapping rate equation model has been built and used to model thermal desorption spectrometry (TDS) experiments performed on single crystal tungsten after deuterium ions implantation. Detrapping energies obtained from the model to adjust temperature of TDS spectrum observed experimentally are in good agreement with DFT values within a deviation below 10 %. The desorption spectrum as well as the diffusion of deuterium in the bulk are rationalized in light of the model results.
I. Introduction
To understand the issues of migration, trapping and desorption of Hydrogen Isotopes (HIs) in metals, a Macroscopic Rate Equation (MRE) model is often used. It is based on a one dimensional diffusion equation including trapping effects and was originally discussed by McNabb et al. [1]. It has been used for tungsten [2-7] in several codes, such as TMAP7 [5] or our own code MHIMS (Migration of Hydrogen Isotopes in MetalS) [7] to fit experimental Thermal Desorption Spectrometry (TDS) measurements. This type of model is based on the assumption that each trap can only contain a single HIs.
However, it has been shown in Density Functional Theory (DFT) studies [8, 9, 10] that a mono vacancy can trap up to 6 HIs at 300 K with detrapping energies depending on the number of HIs
in the vacancy. Inclusion of such effects in a MRE model was recently explored to analyze isotopic exchange experimental observations which are difficult to understand with classical MRE models [11]. In this contribution, a MRE model that includes these DFT predictions is proposed and it is used to probe the impact of HIs multi-trapping on TDS spectra. The implementation of this MRE model is called MHIMS-reservoir. After presenting the basic equation of the model, the code will be used to fit experimental TDS measurements performed on tungsten implanted with HIs ions [12]. Corresponding trapping energies obtained with MHIMS- reservoir will be compared to DFT detrapping energies and the simulation results will permit to discuss the evolution of the filling level of vacancies.
II. Model description
In a 1D MRE model, HIs are split into two populations: mobile (or solute) and trapped species. We will consider a single type of trap (a vacancy for example) which can contain 𝑙 HIs. In the following, the concentration of HIs and traps, theoretically in m-3,will be normalized to the metal density (i.e. expressed in atomic fraction (at.fr.)). They will be expressed as:
𝑛𝑠𝑜𝑙𝑢𝑡𝑒 Concentration of solute sites
𝐶𝑚 Solute or mobile particles concentration Hypothesis 1: 𝐶𝑚 ≪ 𝑛𝑠𝑜𝑙𝑢𝑡𝑒 [7]
𝑁𝑡 Trap concentration. Hypothesis 2: 𝑁𝑡≪ 𝑛𝑠𝑜𝑙𝑢𝑡𝑒 [7]
𝑁𝑖 Concentration of traps filled with 𝑖 = 0, … , 𝑙 HIs, 𝑙 being the
maximum number of HIs that can fill a trap (𝑙 = 6 in this model) 𝐶𝑡,𝑖 = 𝑖 ⋅ 𝑁𝑖 𝑓𝑜𝑟 𝑖 > 0 Concentration of trapped HIs
We call a i trap level a trap filled with i HIs. Without trap creation, we get ∀ 𝑡, ∑𝑙 𝑁𝑖 = 𝑁𝑡
𝑖=0 .
Concerning, the evolution of the trap population, an i trap level can be changed into:
An i+1 trap level by trapping a solute particle (rate 𝑆𝑚𝑜𝑏𝑖𝑙𝑒→𝑖 𝑡𝑦𝑝𝑒),
An i-1 trap level by detrapping a trapped particle (rate 𝑆 𝑖 𝑡𝑦𝑝𝑒→𝑚𝑜𝑏𝑖𝑙𝑒).
As a consequence, the variation of the population Ni of i-trap level can be decomposed in 4
different sources following Eq. (1):
𝜕𝑁𝑖
Following hypothesis 2, one can write [7]: 𝑆𝑚𝑜𝑏𝑖𝑙𝑒→𝑖 𝑡𝑦𝑝𝑒 = 𝜈𝑚⋅𝑛𝐶𝑚
𝑠𝑜𝑙𝑢𝑡𝑒⋅ 𝑁𝑖 (2)
where 𝜈𝑚 (𝑠−1) is the frequency associated with the trapping process. It can be expressed as a
function of the diffusion coefficient by 𝜈𝑚 =𝐷(𝑇)𝜆2 and 𝐷(𝑇) = 𝐷0⋅ 𝑒−𝐸𝐷𝑘⋅𝑇 (𝑚2/𝑠) is the diffusion
coefficient of HIs in the tungsten matrix with 𝐸𝐷 the energy barrier for diffusion (eV), 𝑇 the temperature (K), 𝑘 the Boltzmann constant and 𝜆 is the distance between 2 solute sites.
On the other hand, detrapping processes lead to several associated frequencies 𝜈𝑖 (𝑠−1). The 𝜈𝑖
frequency depends on the temperature and the detrapping energy 𝐸𝑖 (eV) of HIs in the i-trap level according to:
𝜈𝑖 = 𝜈0⋅ 𝑒−𝑘⋅𝑇𝐸𝑖 (3)
with 𝜈0 = 1013 𝑠−1 [3-7] the jump attempt frequency. Following hypothesis 1, one can write:
𝑆𝑖 𝑡𝑦𝑝𝑒→𝑚𝑜𝑏𝑖𝑙𝑒 = 𝜈𝑖⋅ 𝑁𝑖 (4)
Finally, the variation of trap population 𝜕𝑁𝜕𝑡𝑖 can be obtained as function of 𝜈𝑚, 𝜈𝑖 and
concentrations: 𝑓𝑜𝑟 0 < 𝑖 < 𝑙 𝜕𝑁𝑖 𝜕𝑡 = −𝜈𝑚⋅ 𝐶𝑚 𝑛𝑠𝑜𝑙𝑢𝑡𝑒⋅ 𝑁𝑖+ 𝜈𝑚⋅ 𝐶𝑚 𝑛𝑠𝑜𝑙𝑢𝑡𝑒⋅ 𝑁𝑖−1− 𝜈𝑖⋅ 𝑁𝑖 + 𝜈𝑖+1⋅ 𝑁𝑖+1 (5) 𝑓𝑜𝑟 𝑖 = 0 𝜕𝑁0 𝜕𝑡 = −𝜈𝑚⋅ 𝐶𝑚 𝑛𝑠𝑜𝑙𝑢𝑡𝑒⋅ 𝑁0+ 𝜈1⋅ 𝑁1 (6) 𝑓𝑜𝑟 𝑖 = 𝑙 𝜕𝑁𝑙 𝜕𝑡 = 𝜈𝑚⋅ 𝐶𝑚 𝑛𝑠𝑜𝑙𝑢𝑡𝑒⋅ 𝑁𝑙−1− 𝜈𝑙⋅ 𝑁𝑙 (7)
This set of equations of the evolution of the trap concentration is based on the same approach as the one described by Schmid et al. [11] in the case of mono-isotopic case.
In analogy with a classic MRE model, the variation with time of the concentration of the mobile particles is described in the present model as:
𝜕𝐶𝑚 𝜕𝑡 = 𝐷(𝑇) ⋅ 𝜕²𝐶𝑚 𝜕𝑥² − ∑ 𝜕𝐶𝑡,𝑖 𝜕𝑡 𝑙 𝑖=1 + 𝑆𝑒𝑥𝑡 (8)
where 𝑆𝑒𝑥𝑡 is the exterior source of particles due to ions implantation expressed as: 𝑆𝑒𝑥𝑡 = (1 − 𝑟) ⋅ 𝜑 ⋅ 𝑓(𝑥) (9)
where 𝜑 is the incident flux and the TRIM code [13] is used to obtained, the reflexion coefficient 𝑟 and the stopping range 𝑓(𝑥) of the incident ions.
𝜕𝐶𝑚 𝜕𝑡 = 𝐷(𝑇) ⋅ 𝜕2𝐶 𝑚 𝜕𝑥2 − 𝜈𝑚⋅ 𝐶𝑚 𝑛𝑠𝑜𝑙𝑢𝑡𝑒⋅ (𝑁𝑡− 𝑁𝑙) + ∑ 𝜈𝑖 ⋅ 𝑁𝑖 𝑙 𝑖=1 + (1 − 𝑟) ⋅ 𝜑 ⋅ 𝑓(𝑥) (10)
With Eq. (5), Eq. (6), Eq. (7) and Eq. (10), the model of multi-trapping is fully described. As boundary condition, we consider that it is a Dirichlet one, i.e. 𝐶𝑚(𝑥 = 0, 𝑡) = 0 [7], since recent experimental work [14] has shown that surface processes are not rate-limiting on typical tungsten materials which are not atomically clean.
Finally, we introduce new quantities which allow analyzing mobile particles concentration evolutions in quasi-equilibrium conditions. At the equilibrium 𝜕𝑁𝑖
𝜕𝑡 = 0, therefore 𝑁𝑒𝑞,𝑖 are
calculated with the following expression:
𝑓𝑜𝑟 1 ≤ 𝑖 ≤ 𝑙 𝑁𝑒𝑞,𝑖 𝑁𝑒𝑞,𝑖−1= 𝜈𝑚⋅𝑛𝑠𝑜𝑙𝑢𝑡𝑒𝐶𝑚 𝜈𝑖 (11) 𝑓𝑜𝑟 1 ≤ 𝑖 ≤ 𝑙 𝑁𝑒𝑞,𝑖 𝑁𝑒𝑞,0 = (𝜈𝑚⋅𝑛𝑠𝑜𝑙𝑢𝑡𝑒𝐶𝑚 )𝑖 ∏𝑖𝑗=1𝜈𝑗 (12) 𝑓𝑜𝑟 0 ≤ 𝑖 ≤ 𝑙 − 1 𝑁𝑒𝑞,𝑙 𝑁𝑒𝑞,𝑖= (𝜈𝑚⋅𝑛𝑠𝑜𝑙𝑢𝑡𝑒𝐶𝑚 )𝑛−𝑖 ∏𝑙−𝑖𝑗=1𝜈𝑙−𝑗+1 (13)
And from these we obtained:
∑ 𝑁𝑒𝑞,𝑖 = 𝑁𝑡= 𝑁𝑒𝑞,0. (1 + ∑ (𝜈𝑚⋅ 𝐶𝑚 𝑛𝑠𝑜𝑙𝑢𝑡𝑒)𝑖 ∏𝑖𝑗=1𝜈𝑗 𝑙 𝑖=1 𝑙 𝑖=0 ) = 𝑁𝑒𝑞,𝑙. (1 + ∑ ∏𝑙−𝑖𝑗=1𝜈𝑙−𝑗+1 (𝜈𝑚⋅𝑛𝑠𝑜𝑙𝑢𝑡𝑒𝐶𝑚 )𝑙−𝑖 𝑙−1 𝑖=0 ) (8)
So, for a given mobile particles concentration 𝐶𝑚, we are able to calculate each 𝑁𝑒𝑞,𝑖 which gives, at any time, the trend of evolution of each 𝑁𝑖: if 𝑁𝑒𝑞,𝑖− 𝑁𝑖 < 0, the concentration of 𝑁𝑖 tends to decrease to reach the equilibrium and vice versa. By analyzing the concerted evolution of these trap levels concentrations, one is able to extract the global displacement of mobile particles in the material.
MHIMS-reservoir is used here to simulate TDS experiments. To be able to compare the results with experimental data, the code includes 3 stages in the simulation that render the actual measurements, as explained in [7]:
The implantation stage, lasting 𝑡𝑖𝑚𝑝 at the temperature 𝑇𝑖𝑚𝑝,
The resting stage between the end of the implantation and the beginning of the retention measurement. Here the samples are maintained at constant temperature 𝑇𝑟𝑒𝑠𝑡 for a period
The TDS stage during which the temperature is increased with a given heating ramp 𝛽 (expressed in 𝐾. 𝑠−1).
III. Model parametrization
In order to test DFT values of HIs detrapping energies in vacancy, we compare the simulations results of MHIMS-reservoir with TDS measurements. In case of polycrystalline tungsten, multiple traps are present such as vacancies, dislocations and grain boundaries. It has been shown by classic MRE models that experiments performed on such materials can be roughly modeled with 2 or 3 traps [2-7]. However, the overlapping of desorption from each kind of trap makes the extraction of information on HIs in vacancies difficult. As a consequence, we chose to model one of the best characterized TDS measurements performed on Single Crystal Tungsten (SCW) by Quastel et al. [12]. In these experiments, SCW were mechanically and electrochemically polished with annealing at 1750 K after each polishing step. This procedure should reduce significantly dislocations concentration. Therefore, because there is no grain boundaries in SCW, vacancies are the most probable trapping sites. SCW samples were implanted at room temperature (𝑇𝑖𝑚𝑝 = 300 𝐾) with deuterium at 500 eV/D, at a flux of 1020
D.m-2.s-1 and with a fluence of 1023 D.m-2. Furthermore, Quastel et al. [12] have shown that in their ion beam line a LN2 cold trap allows to reduce the level of volatile impurities. Therefore, we
chose to simulate measurements obtained with their LN2 cold trap and without air exposure
before TDS, to avoid impurities effect on D retention. The resting time was indicated to be 𝑡𝑟𝑒𝑠𝑡 = 0.37 ℎ, the resting temperature was constant (𝑇𝑟𝑒𝑠𝑡= 300 𝐾) and the TDS temperature
ramp was 𝛽 = 5.1 𝐾 ⋅ 𝑠−1. These parameters were used to feed the following simulations.
In addition, Roszell et al. [15] used Nuclear Reaction Analysis (NRA) on the same kind of SCW samples (similar pre-implantation treatment and implantation characteristics 500 eV/D and fluence ~1023-24 D.m-2) to characterize non-homogeneous distribution of implanted D in the bulk of tungsten. As discussed previously in [7], this can be used in first approximation to define the non-homogenous distribution of vacancies in the materials during implantation. Therefore, we used the D distribution of Roszell et al. [15] to define the vacancy trap distribution in our simulation (fig. 1 (a)).
Finally, the diffusion coefficient used in the simulation is the one determined by DFT in
[8] 𝐷𝐻(𝑇) = 1.38 × 10⁻⁷⋅ 𝑒−
0.2𝑒𝑉
𝑘⋅𝑇 (𝑚2. 𝑠−1). DFT calculations from various authors [8, 9, 10]
show that up to 𝑙 = 6 HIs can be trapped in a vacancy at 300 K. Detrapping energies are between 1.5 eV for 1 HIs per vacancy to 0.5 eV for 6 HIs per vacancy. The jump attempt frequency 𝜈0
calculated by DFT [8] varies in the temperature range of 300 K-1000 K between 0.85×10¹³ and 1.45×10¹³ s-1. As it remains within the same order of magnitude, the code uses a constant value 𝜈0 = 1 × 10¹³ 𝑠−1. As a starting point, we used the detrapping energies 𝐸𝑖 from Fernandez
et al. [8] in the MHIMS-reservoir code, before to adjust them in order to minimize the difference between our simulations and the experiment by Quastel et al. [12].
IV. Results and discussion
To fit the experimental data and obtain the right hydrogen desorption rate, we consider a distribution of vacancies (fig. 1 (a)) with a high concentration of 10-3 at.fr. in the first micrometre. As the formation energy of mono-vacancies in tungsten is above 3 eV [8], these vacancies cannot be thermal vacancies. Remembering that we based our analysis on experiment done on SCW (no grain boundaries) annealed at high temperature (low dislocation concentration), these two potential intrinsic traps cannot be the origin of the high concentration of HIs observed in the first micrometre [15]: trap creation should occur during the implantation even at energies below the displacement threshold. Here we make the assumption that the created traps are vacancies. Indeed, it has been already demonstrated by [17] and classical Molecular Dynamics [18] that HIs induces mono-vacancies formation in tungsten through mechanisms that associated hexagonal self-interstitial clusters and linear crowdion. Moreover, it has also been demonstrated, merging DFT modelling and statistical thermodynamic approach, that at 300 K and at the thermodynamic equilibrium, a solute fraction of 𝑥𝐻𝐼= 10−5𝑎𝑡. 𝑓𝑟. induces a fraction of 16× 𝑥𝐻𝐼 in mono-vacancies filled with 𝑙 = 6 hydrogen atoms [8, 16]. These previous findings support the high vacancy concentration in the sub-surface region as the results of H implantation. The spontaneous formation of vacancies due to hydrogen implantation is not yet present in the model and so to mimic it, a non-homogeneous distribution of vacancies is introduced as explained before.
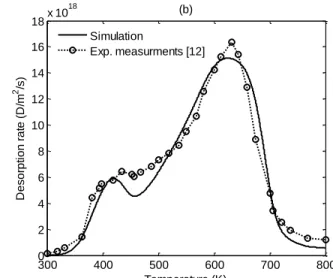
The resulting simulated TDS spectrum presented in fig. 1 (b) shows 2 desorption peaks at 420 K and 630 K which correspond well with the experimental measurement. It is to note that a change of the spatial distribution of vacancies would change the position of the TDS peak for the same detrapping energies. This is why we based our distribution on experimental NRA measurements [15] to improve the reliability of the model. The final detrapping energies used in this simulation are, from E6 to E1: 0.85 eV, 1.06 eV, 1.17 eV, 1.19 eV, 1.30 eV and 1.31 eV. These energies are
in good agreement with DFT values [8-10] (fig. 2), the deviation being below 9% of the starting value from [8]. They are in particular good agreement with DFT results from Fernandez et al. [8] where activation energies were calculated from vacancy site to the first nearest neighbour interstitial site and zero point energy corrections where taken into account. Analysis of trap filling levels during the TDS stage allows to interpret the origin of the two desorption peaks. In the following, we note VHi a vacancy which trapped i HIs. While the first peak is concurrent to the
detrapping from VH6, the second peak results of the overlapping detrapping from VH5 to VH1.
Now that the MHIMS-reservoir code parametrization is validated by the successful reproduction of TDS measurements, we used the code to interpret the quasi-equilibrium condition that one usually assumes before TDS measurements. Vacancies filling level profiles before the TDS start are presented in fig. 3. Up to a 5 µm depth, vacancies are filled with mainly 5 and 6 HIs (fig. 3 (a)). However, at the edge of this 5 µm depth (fig. 3 (b)), the amount of VH5-6
decreases abruptly, concurrently to the increase of, first the VH4 concentration, then the VH3
concentration, and so forth until VH1 are only found in the deepest trapping zone. In this
transitioning zone (between 4.5 and 5 µm) where VH5-6 left room for VH4-1, the analysis of the
𝑁𝑒𝑞,𝑖− 𝑁𝑖 quantities (fig. 4) allows to distinguish 2 zones. First, up to 4.7 µm, there is an equilibrium zone with no evolution of the total concentration of particles (𝑁𝑒𝑞,𝑖− 𝑁𝑖 ≈ 0). Then after 4.7 µm, there is the out equilibrium zone where the total concentration of particles drops quickly (fig. 3). Focusing on the 4.7 – 4.8 µm, one notices that the VH5-6 concentration tends to
increase (𝑁𝑒𝑞,𝑖− 𝑁𝑖 > 0) while VH4-0 concentration tends to decrease (𝑁𝑒𝑞,𝑖− 𝑁𝑖 < 0). This
behavior results from mobile HIs diffusing into this zone containing numerous partly empty traps VH4-0. Mobile HIs are thus “stopped” by being trapped into these VH4-0, forming VH5-1 and
V. Conclusion
In this paper, a rate equation model is presented for multi-trapping/migration of HIs in tungsten having a single type of trap. This model is based on DFT predictions: a mono vacancy can trap up to 6 HIs at 300K. The equations of the model have been described for a general case of a trap which can contain up to 𝑙 HIs. These equations are implemented in the MHIMS-reservoir code in order to fit experimental TDS measurements obtained on single crystal tungsten in which vacancies are considered to be the most probable trapping site. The simulation results show a good agreement between detrapping energies needed to fit the experimental measurement and the DFT predictions. Two peaks are observed in the TDS spectra at 420 K and 630 K: the first corresponds to desorption of HIs from vacancies filled with 6 HIs and the large second one to the other levels of filling. Studying the equilibrium of equations, a process for the migration at room temperature of HIs in the bulk through vacancies is proposed: mobile particles diffuse through saturated zone and are stopped/trapped where vacancies are not completely filled.
Acknowledgment
This work has been carried out thanks to the support of the A*MIDEX project (n°ANR-11-IDEX-0001-02) funded by the “Investissements d’Avenir” French Government program, managed by the French National Research agency (ANR).
Reference
[1] McNabb, A., Foster, P. K., Trans. Metall. Soc. AIME, 227 (1963) 618-627
[2] C. Garcia-Rosales, P. Franzen, H. Planck et al., J. Nucl. Mater. 233-237 (1996) 803-808 [3] O.V. Ogorodnikova, J. Roth, M. Mayer, J. Nucl. Mater. 313-316 (2003) 469-477
[4] K. Schmid, V. Rieger, A. Manhard, J. Nucl. Mater. 426 (2012) 247-253 [5] M. Poon, A. A. Haasz, J. W. Davis, J. Nucl. Mater. 374 (2008) 390-402 [6] X. Bonnin, E. Hodille, N. Ning et al., J. Nucl. Mater. 463 (2015) 970-973 [7] E.A. Hodille, X. Bonnin, R. Bisson et al., J. Nucl. Mater. (2015)
http://dx.doi.org/10.1016/j.jnucmat.2015.06.041
[8] N. Fernandez, Y. Ferro, D. Kato, Acta Mater. 94 (2015) 307-318
[9] K. Heinola, T. Ahlgren, K. Nordlund, J. Keinonen, Phys. Rev. B 82 (2010) 094102 [10] D.F. Johnson and E.A. Carter, J. Mater. Res. 25 (2010) 315-327
[11] K. Schmid, U. von Toussaint, T. Schwarz-Selinger, J. Appli. Phys. 116, 134901 (2014) [12] A.D. Quastel, J. W. Davis, A.A. Haasz et al., J. Nucl. Mater. 359 (2006) 8-16
[13] J.F. Ziegler, M.D. Ziegler, J.P. Biersack, Nucl. Inst. Meth. Phys. Res. B 268 (2010) 1818-1823
[14] R. Bisson, S. Markelj, O. Mourey et al., J. Nucl. Mater. (2015) http://dx.doi.org/10.1016/j.jnucmat.2015.07.028
[15] J. P. Roszell, J. W. Davis, V. Kh. Alimov et al., J. Nucl. Mater. 438 (2013) S1084-S1087 [16] K. Ohsawa, F. Nakamori, Y. Hatano et al., J. Nucl. Mater. 458 (2015) 187-197
[17] S.C. Middleburgh, R.E. Voskoboinikov, M.C. Guenette et al., J. Nucl. Mater. 448 (2014) 270-275
Figure Caption
Figure 1. (a) Non-homogeneous vacancy distribution used in this work. (b) Simulations of the
TDS spectrum measurement (#15) on a SCW [12] with the non-homogeneous vacancy distribution of (a). Incident ions energy = 500 eV/D, flux = 1020 D.m-2.s-1, fluence 1023 D.m-2, temperature ramp up = 5.1 K/s.
Figure 2. Detrapping energies of HIs in a tungsten mono vacancy as a function of the number of
HIs in the vacancy. The detrapping energies are calculated by addition of the DFT binding energies with a barrier for diffusion of the interstitial H equal to 0.2 eV [8-10]. The value E vac->solute correspond to the energy barrier from the vacancy to the first nearest interstitial site [8].
Figure 3. Simulated HIs depth profile just before the TDS start (a) between 0 and 5 µm and (b)
between 4.5 and 5 µm (fluence = 1023 D.m-2 with 500 eV/D). Ct,1-4 are not contributing
significantly to retention in (a) and have been removed for clarity
Figure 4. 𝑁𝑒𝑞,𝑖− 𝑁𝑖 between 4.5 and 5 µm for the mobile profile 𝐶𝑚 just before TDS start. 𝑁𝑒𝑞,𝑖
Figure 1 300 400 500 600 700 800 0 2 4 6 8 10 12 14 16 18x 10 18 Temperature (K) D e so rp ti o n r a te ( D /m 2 /s) (b) 0 1 2 3 4 5 10-5 10-4 10-3 10-2 Depth (µm) V a ca n cy d e n si ty (a t. fr .) (a) Simulation Exp. measurments [12]
Figure 2 0 1 2 3 4 5 6 7 0.5 0.6 0.7 0.8 0.9 1 1.1 1.2 1.3 1.4 1.5
Number of H in a single vacancy
D e tr a p p in g e n e rg y (e V ) DFT E
detr Johnson et al. [10]
DFT E
detr Heinola et al. [9]
DFT E
detr Fernandez et al. [8]
DFT E
vac->solute Fernandez et al. [8]
Figure 3 0 1 2 3 4 5 10-6 10-5 10-4 10-3 10-2 10-1 Depth (µm) D r e te n ti o n ( a t. fr .) (a) 4.5 4.6 4.7 4.8 4.9 5 10-6 10-5 10-4 10-3 10-2 10-1 (b) Depth (µm) D r e te n ti o n ( a t. fr .) C t1 C t2 C t3 C t4 C t5 C t6 trap+mobile
Figure 4 4.5 4.6 4.7 4.8 4.9 5 -3 -2 -1 0 1 2 3x 10 -5 Depth (µm) Ne q ,i -N i i = 0 i = 1 i = 2 i = 3 i = 4 i = 5 i = 6
Equilibrium zone Out
Equilibrium zone