HAL Id: hal-02544005
https://hal.archives-ouvertes.fr/hal-02544005
Submitted on 15 Apr 2020
HAL is a multi-disciplinary open access
archive for the deposit and dissemination of sci-entific research documents, whether they are pub-lished or not. The documents may come from teaching and research institutions in France or abroad, or from public or private research centers.
L’archive ouverte pluridisciplinaire HAL, est destinée au dépôt et à la diffusion de documents scientifiques de niveau recherche, publiés ou non, émanant des établissements d’enseignement et de recherche français ou étrangers, des laboratoires publics ou privés.
Imbricated Aseismic Slip And Fluid Diffusion Drive A
Seismic Swarm In The Corinth Gulf, Greece.
Louis De Barros, Frédéric Cappa, Anne Deschamps, Pierre Dublanchet
To cite this version:
Louis De Barros, Frédéric Cappa, Anne Deschamps, Pierre Dublanchet. Imbricated Aseismic Slip And Fluid Diffusion Drive A Seismic Swarm In The Corinth Gulf, Greece.. Geophysical Research Letters, American Geophysical Union, 2020, 47 (9), pp.e2020GL087142. �10.1029/2020GL087142�. �hal-02544005�
Imbricated Aseismic Slip And Fluid Diffusion Drive A Seismic Swarm In The Corinth
Gulf, Greece.
Louis De Barros1,*, Frédéric Cappa1,2,Anne Deschamps1, Pierre Dublanchet3
1 Université Côte d’Azur, CNRS, Observatoire de la Côte d’Azur, IRD, Géoazur, 06560 Sophia Antipolis, France 2 Institut Universitaire de France, Paris, France
3 MINES ParisTech, PSL ResearchUniversity, Centre de Géosciences, 35 rue Saint-Honoré 77305 Fontainebleau, France *Corresponding author: debarros@geoazur.unice.fr (L. De Barros)
Key points
Spatiotemporal evolution of seismicity illuminates distinct processes driving a swarm in the Corinth Gulf.
Swarm activity is dominantly driven at fluid diffusion velocity, but short bursts of seismicity develops at faster migration velocity.
Quiescent periods of pressure build-up alternate with aseismic slip episodes that trigger bursts of seismicity.
Abstract
The primary processes driving seismic swarms are still under debate. Here, we study the temporal evolution of a seismic swarm that occurred over a 10-day period in October 2015 in the extensional rift of the Corinth Gulf (Greece) using high-resolution earthquakes relocations. The seismicity radially migrates on a normal fault at a fluid diffusion velocity (125 m/day). However, this migration occurs intermittently, with periods of fast expansion (2-to-10 km/day) during short seismic bursts alternating with quiescent periods. Moreover, the growing phases of the swarm illuminates a high number of repeaters. The swarm migration is likely the results of a combination of multiple driving processes. Fluid up flow in the fault may induce aseismic slip episodes, separated by phases of fluid pressure build-up. The stress perturbation due to aseismic slip may activate small asperities that produce bursts of seismicity during the most intense phase of the swarm.
Plain Language Summary
Seismic swarms are clusters of numerous earthquakes of small magnitudes. To maintain such seismic activity, a driving mechanism is required, but it is still an open question. Here, we focus on a small, prolific earthquake swarm recorded by a dense network of seismic stations in the Corinth Gulf (Greece). We find that the overall expansion of the swarm is related to fluid diffusion. However, in detail, bursts of events with fast migration and earthquakes sharing similar waveforms suggest that most of the slip on the fault does not radiate seismic waves. We therefore suggest that the fluid pressure mainly induces aseismic deformation that, then, triggers the seismicity by perturbing stress.
1. Introduction
Earthquakes usually occur as mainshock/aftershocks sequences, with a large event followed by numerous smaller earthquakes. By contrast, seismic swarms are bursts of numerous small earthquakes, clustered in time and space, without a clear onset and an obvious mainshock. A seismic swarm may then stop on its own, or evolve toward a larger, eventually damaging, earthquake. For example, the seismic swarm occurring before the 2009 Mw 6.3L’Aquila earthquake (central Italy, 400 fatalities) was
seen as a precursory sequence only afterward (Chiaraluce et al., 2011). Thus, why does seismicity develop as a swarm, and not as a mainshock/aftershocks sequence, is a key question; therefore, understanding the triggering and driving processes of seismic swarms is of great importance for earthquake hazard mitigation.
Seismic swarms are observed in different geological contexts and their origins are thought to be triggered by either fluid pressure or aseismic slip (Chen et al., 2012; Roland and McGuire, 2009; Vidale and Shearer, 2006). Previous studies have shown that swarms occurred in volcanic regions (De Barros et al., 2013; McNutt, 2005), in low tectonic strain-rate regions (Daniel et al., 2011; Hainzl, 2004), along creeping faults (Llenos et al., 2009; Roland and McGuire, 2009), in subduction zones (Vallée et al., 2013), and during anthropogenic hydraulic stimulations of reservoirs (Keranen and Weingarten, 2018; Wei et al., 2015). Most of seismic swarms exhibit a spatiotemporal migration, whose velocity is used to distinguish between different triggering mechanisms (Vidale and Shearer, 2006). Fluid-assisted swarms have typical migration velocities of the order of m/day (Shapiro et al., 1997), while aseismic slip-driven swarms are generally at a faster velocity at km/hour (Lohman and McGuire, 2007). Moreover, fluid injection experiments have recently shown that there is an interplay between fluid pressure and aseismic deformation in triggering and driving seismicity (Bourouis and Bernard, 2007; Cappa et al., 2019; De Barros et al., 2018; Guglielmi et al., 2015). In these experiments, fluid pressure mainly induced aseismic deformation, which in turn may trigger seismicity through stress perturbation on fault asperities that have adequate background stress and frictional instability conditions. Thus, while a driving process is required to maintain such an active seismicity for days to months, the underlying mechanisms remain ambiguous.
In this paper, we analyze a 10-day seismic swarm recorded in October 2015 in the extensional rift of the Corinth Gulf (central Greece). We take advantage of a dense network of seismological stations in the region. The high seismic rate and the fast-extensional setting (15 mm/year, Avallone et al., 2004) make this area an ideal natural laboratory to study seismic swarms, which are, here again, associated either to fluid diffusion (Duverger et al., 2015) or to slow, aseismic deformation (Bernard et al., 2006; Dublanchet et al., 2015). Here, we focus on a small, isolated and prolific, seismic swarm in order to unravel the mechanisms that drive it. After relocating the events, the spatiotemporal evolution of the seismicity reveals different migration velocities. Moreover, highly correlated waveforms suggest that some patches may rupture several times, as repeaters. Our results provide evidence for imbricated processes governing the evolution of the swarm, with phases of seismicity induced by fluid pressure build-up alternating with seismicity driven by fluid-induced aseismic slip.
Figure 1. (a) Map of the Corinth Gulf, with the main outcropping faults (black line), the seismic network (blue triangle) and the seismicity (orange dots, sized by magnitudes) detected and located by the CRL network between the day 270 (September, 27) and 280 (October, 7), 2015. The studied swarm is the dense cluster below MALA station. The star MG indicates the local array used for detection. The triangles are the stations used for location. (b) Time distribution of the detected and located events in 2 hours bins. The decay rate is fitted with a modified Omori’s law (black line). (c) Cumulative number of events (black line), with the maximum magnitude of earthquakes in 12 hours bins (red crosses).
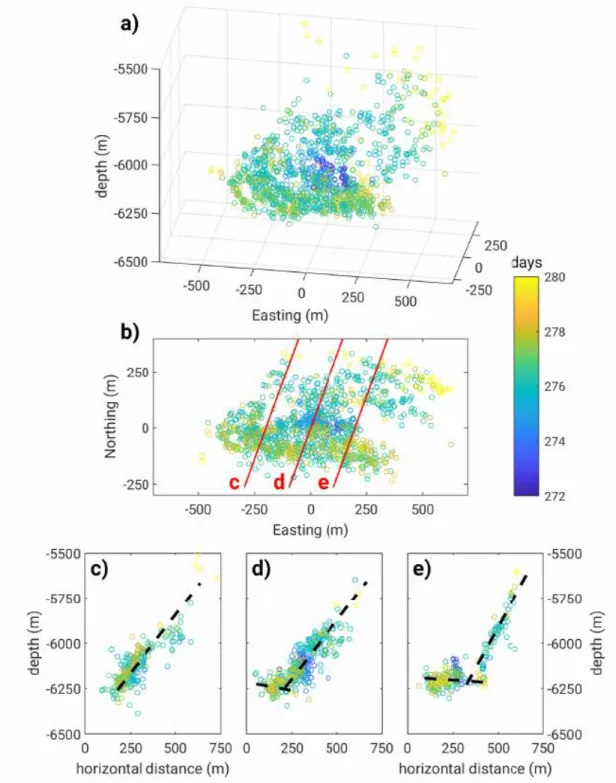
Figure 2. Event locations. (a) 3D view; (b) Map view. The red lines (with a N110° strike, orthogonal to the main structure strike) indicates the locations of the cross-sections shown in (c), (b) and (e). All hypocenters within 75 m from these cross-sections are shown. The color code shows the day of occurrence. A movie of the locations through time and additional cross-sections are given in supplementary movie S1 and figure S1, respectively.
2. Analysis of the 2015 Seismic Swarm
The western part of the Corinth Gulf is covered by a dense network of 27 seismic stations (CRL network, Corinth Rift Laboratory), which allows a high-quality observation of the seismicity. Occasionally, large damaging earthquakes occurred, such that the Mw 6.2 Aigion earthquake in 1995 (Bernard et al., 1997).
However, this region is mainly characterized by a prolific seismicity, with an average of 15,000 events/year, with low magnitudes ranging from 0.5 to 4 (Duverger et al., 2018). This seismicity is organized as swarms, as observed in 2003-2004 (Duverger et al., 2015) and in 2013 (Kapetanidis et al., 2015). It mainly develops on a 1-to-3 km thick layer at about 5-to-8 km depth in which large normal faults (with 50-to-60°dip angle) are rooting. This layer may be the tectonic contact between the limestone and the low-permeability phyllite-quartzite series. It is interpreted as a detachment system, inherited from an old thrust system that is now reactivated as low-angle normal faulting (Rigo et al., 1996). The presence of fluids below this layer, imaged by a high ratio of P- over S-wave velocities (Vp/Vs)
(Gautier et al., 2006) suggests that fluid pressure diffusion might explain the swarm behaviors and the seismicity migration (Duverger et al., 2015).
2.1 Earthquake Locations
Between September 29 and October07, 2015 (days 272 to 280), more than 800 events were detected by the CRL network and located in a very clustered area beneath MALA station, in the north of the Gulf (Fig. 1). A nearby antenna of 7 stations, with a small aperture of 500 m, allows extending the detection catalog to 1947 events, by identifying spatially correlated waveforms (De Barros et al., 2017, see supplementary text S1).
The swarm started on September 29 (day 272) with an emergent onset (Fig. 1b,c). The rate of earthquakes slowly accelerated from 58 events on day 272 to 665 events on day 276. Additionally, three short bursts of seismic events occurred on days 272, 274 and 275. It then decayed from days 277 to 280, following a modified Omori’s law (Utsu and Ogata, 1995), with a decay exponent of 0.8. During this swarm, magnitudes are dominantly small, with a maximum magnitude of 2.8, three other events of magnitude above 2.5 on days 275 and 276, and a magnitude of completeness of 0.5.
To locate these events, we performed a double-difference location. Two-seconds long windows, that contain either P- or S-wave phases, are filtered in a 2-10 Hz range and are cross-correlated for all events at the 9 closest stations from the swarm (Fig. 1a). More than 2.5e6 P- and 2.9e6 S- inter-events time delays, with correlation coefficients greater than 0.75, are then inverted (hypoDDsoftware, Waldhauser and Ellsworth, 2000). Only events with more than 9 cross-correlation times are located, leading to 1386 relocated events with a decametric relative precision.
The cluster of seismicity occurred at a depth between 5.5 and 6.4 km (Fig. 2) beneath the deltaic peninsula of Malamata (Parcharidis et al., 2011). Most of the hypocenters align on a plane oriented N100 and dipping 50° south, which is the main fault where the swarm develops. On this plane, seismicity grows along an elliptical cloud, which is about 800 m wide dip and 1100 m large along-strike. The strike and dip of this plane are compatible with the normal faults observed at the outcropping
in the North of the Gulf (Ford et al., 2013). At the bottom of this planar structure, the seismicity abruptly stops at a depth of 6.3 km, where a thick alignment of the seismic events describes a secondary structure. This elongated structure may be a plane with a low dip angle (10-30°) toward the north. It is consistent with the preferential alignment of seismicity observed by Lambotte et al. (2014) and Duverger et al. (2018), and interpreted as the detachment plane of the Phyllade nappes. While the structure of the main plane is well described by the seismicity locations, the secondary plane is not clear because the seismicity mainly gathers at the intersection between both planes. This structural intersection seems to act as a mechanical barrier for the migration of seismicity along the main plane. Therefore, while no seismicity occurs below the planes’ intersection, the density of events is maximal just above it, and decreases with depth on the main plane.
2.2 Spatiotemporal Migration of Seismicity
The seismicity starts on day 272 in a very localized area at the bottom part of the main fault plane, just above the intersection with the low dipping detachment (Fig. 2 and supplementary figure S2). It then radially migrates, leading to a seismic front with an expanding elliptical shape. Erreur ! Source du renvoi introuvable.a shows the time evolution of the hypocentral distance from the starting location of the swarm within the main fault plane (so-called R-T diagram, Shapiro et al., 1997). The migration can be fitted by a fluid diffusion law of the form 𝑅 = √(𝜋𝐷𝑡), where 𝑅 is the distance from the initial event, 𝑡 is the time, and 𝐷 is a diffusion coefficient. Assuming that the seismic front follows the fluid pressure front, D is a hydraulic diffusivity. The best fit gives D=0.25 m2/s, which is consistent with other seismic
swarms worldwide (Shapiro et al., 2002). This seismic front may be also modelled with a constant migration velocity of 125 m/day over a distance of about 500 m (Fig. 3a). Such velocity is also consistent with a fluid driving mechanism of seismicity (Vidale and Shearer, 2006; Chen et al., 2012).
However, our observations also show that the migration behavior of seismicity is not continuous. During the first 4 days of the swarm (from 272 to 276), short periods of intense activity occurs. These vigorous seismic sequences alternate with more quiescent phases that last 10-to-15 hours (Fig. 3a). The most active episodes are characterized by very fast migration from the center of the swarm. The size of the seismic cloud suddenly expands, with migration velocity up to 2.7 km/day and 10 km/day, for the bursts on days 274 and 275, respectively (Fig. 3b). Such migration velocities are consistent with swarms driven by aseismic slips (Llenos et al., 2009; Lohman and McGuire, 2007). By contrast, the swarm does not expand during the quiescent phases. After the day 276, the seismicity distribution seems more randomly distributed in space and time, and the seismic cloud does not grow anymore.
Figure 3. (a) Distance-Time (R-T) plot, with event hypocentral distances from the starting location of the swarm versus time. The distance is computed in the main fault plane (N100°, 50°S). Colors show the depth, and dots are sized by magnitude. The best-fit solution for a fluid diffusion law and a constant velocity migration are drawn as red dashed and plain lines, respectively. The arrows highlight the episodes of fast migration. (b) Same plot, but zoomed on day 275.2 to 275.5. The red line shows the constant velocity migration. (c) Time distribution of the repeaters, with the ratio of repeaters over located events versus time (in percent, red line).
2.3 Seismic Repeaters
Through our analysis, we observe that some seismic events share very similar waveforms, and occur at similar locations. We therefore look for repeating events, as they are commonly used as a probe for slow-slip occurrence (Uchida and Bürgmann, 2019). With this aim, we cross-correlate the full waveform of all events, filtered in the 2-12 Hz range, at 3 different stations (MGO5, VVK, ROD3, Fig. 1a). Those stations are selected because they have good signal-to-noise ratios and different azimuth angles from the seismic cloud. We then classify the seismic events in families, in which events share correlation coefficient greater than 95% with all other events at those three stations. At the end, we keep 64 repeaters distributed in nine different families with at least 5 events (waveform examples in supplementary figure S3).
Assuming an omega-square model (Brune, 1970) and a circular rupture (Kaneko and Shearer, 2014), the corner frequencies of these events are measured between 8 and 12 Hz, which lead to source radius in the range of 20-45 m. Such source sizes are consistent with the inferred seismic magnitudes, which lie between 1.2 and 2.1. Plotting the event sources on the main structure show a partial overlap of the sources within each family (supplementary figureS4). On average, between 22 and 58% of the source areas are common within each family. Therefore, these partly overlapping event sources indicate that some patches might have ruptured several times.
Most of those repeaters occurs during the first period of the swarm, when the seismicity rate is increasing. Some events are still present during the peak of the seismic crisis, but only few events occurs in the tail of the swarm, after day 277. Therefore, the ratio of highly correlated events over located events is large at the beginning and decays with time (Fig. 3c). Within every family, repeaters show an increase of their inter-event time, indicating a decay in their seismic activity. On the contrary, the located events, within the same exact periods, show an increasing activity. Indeed, the average cumulative number of located and repeaters ∑𝑁 recorded in the same periods can be fitted by ∑𝑁𝑡3/2and ∑𝑁√𝑡, respectively (supplementary figure S5). The repeater rate therefore decays with a modified Omori’s exponent of 0.5 (Utsu and Ogata, 1995). Therefore, some particular patches have their activity vanishing while the overall activity in the area is still increasing.
These repeaters may share similar source patches, but they may also be neighboring ruptures if source geometries are more complex than a circular rupture and considering location uncertainties. It is therefore impossible to conclude if those events break the exact same asperity or if they successively rupture several pieces of a larger asperity. In any case, our analysis indicates that they are located on specific asperities on which several ruptures occurred. Such ruptures dominantly occur during the swarm onset, while the overall seismic rate is increasing. As the rate decays, the seismic activity on those asperities then disappears.
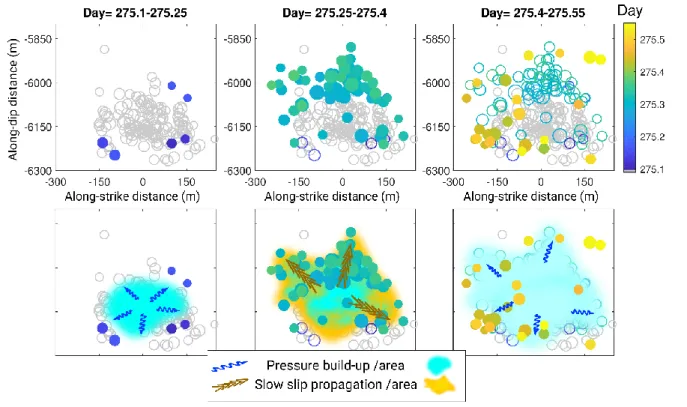
Figure 4. (Top panels) Zoom on the seismicity, occurring before (275.1-275.25), during (275.25-275.4) and after (275.4-275.55) the event burst of day 275. The locations of the events before 275.1 are shown as gray circles, while the they are colored according to the time, with either empty (past) or filled (current) circles. (Bottom panels) Interpretative sketch of the processes, with light blue and orange colors indicating fluid pressure and slow-slip, respectively.
3. Discussion
3.1 Fault Geometries and Possible Earthquake Triggers During The Swarm
The seismic swarm that occurred during a 10-day period in October 2015 in the northern part of the Corinth Gulf develops on a fault oriented N100 and dipping 50°S, consistently with the normal fault geometry in this area. The seismicity expansion is stopped on its bottom-end below the intersection with a low dipping plane at 6.3 km depth. The latter structure may correspond to the low-angle detachment plane highlighted by seismic activity in which normal faults are rooting (Duverger et al., 2018; Lambotte et al., 2014). Below this layer, there is no seismicity, but anomalies in VP/VS ratio show
evidences of fluid (Gautier et al., 2006). Indeed, previous studies suggested that the fluid is likely overpressurized (i.e., above the hydrostatic pressure) at this depth, because the low-permeability Phyllade nappe acts as a cap-rock on top of a reservoir layer (Bourouis and Cornet, 2009; Duverger et al., 2015; Gautier et al., 2006). Then, a conventional fault-valve behavior (Sibson, 1990) may likely explain the fluid migration from this reservoir to the faults located above. Ruptures in the Phyllade nappe may create permeable paths capable to drive transient up-flows of fluid overpressures into the
normal faults. This model was previously used to explain a swarm in the 2003-2004 period (Duverger et al., 2015). We here observe that the seismic cloud expands from a very localized area just above the intersection of both planes. This area therefore corresponds to the inflow of fluid in the normal fault, which is then leading to the global migration of the swarm activity.
3.2 A Combination Of Mechanisms For The Migration Of The Seismicity
Our observations show that the seismic swarm develops in two distinct phases. First, before day 276, the seismicity rate increases and the seismic front slowly expands with velocities of the order of m/day. Within this phase, bursts of event, separated by more quiescent phases, occur over short time windows with fast migration velocities of the order of km/day. In addition, a high ratio of repeaters are observed during this phase, which suggests that aseismic slip and associated stress perturbation are likely at play. The swarm reaches its peak of activity at the beginning of day 276, and then, in the second phase, the seismic cloud expansion stops, and the seismic rate decays. Such decay may be associated with the rebalance of the stress field and fluid pressure after the main perturbation, similarly to an aftershock sequence (De Barros et al., 2019; Stein, 1999).
The analysis of the migration velocity shows that the global expansion of the swarm appears dominantly fluid-driven at slow velocity (m/day), and that accelerating bursts (km/day) develop over short duration. We therefore propose that the migration of the seismic swarm is a combination of fluid pressurization and stress perturbation through aseismic slip. During the quiescent phases, pressure accumulates in the fault (Figs. 4a and 4d) due to continuous up-flowing fluids from the deeper high-pressure reservoir. When the fluid pressure is high enough, the fault reaches its critical state and rupture starts. In the pressurized area, the fault probably rupture as a slow-slip event, as shown by the rapid migration velocity and the repeaters. In addition, we calculate a theoretical estimation of slip velocities comprised between 0.5 and 3.9 10-6 m/s, based on the observed rupture propagation velocity during the rapid
bursts (10 km/day, Fig. 3b) and reasonable stress drops (Gao et al., 2012) ranging from 0.01 to 1 MPa (see Supplementary text S2 and figure S6). Such values of slip and migration velocities are consistent with analyses of seismic swarms driven by aseismic creep (Lohman and McGuire, 2007; Roland and McGuire, 2009). Once aseismic slip starts in the pressurized area, it can grow, which perturbs the stress on small asperities both in and at the edge of the pressurized zone. This stress perturbation may seismically activate the slip on these asperities, leading to earthquakes that manifest as bursts (Figs. 4b and 4e). This sequential evolution is consistent with observations during controlled fluid injection experiments (De Barros et al., 2018; Guglielmi et al., 2015) and theoretical modeling (Bhattacharya and Viesca, 2019; Cappa et al., 2019). They showed indeed that the increase of fluid pressure in a fault induces aseismic slip at the first place, and then the stress perturbation driven by the aseismic slip triggers seismicity on earthquake-prone areas in and outside the pressurized zone.
The reduction of seismic activity at the end of the seismic bursts is likely due to a dilatancy process associated with aseismic slip (Guglielmi et al., 2015; Liu and Rubin, 2010). Dilatancy increases the fault opening, which results in a pressure decrease. Then, fault aseismic slip may decelerate and stop. Thus,
in the following quiescent phases, the residual seismicity is likely due either to a rebalance of stress or fluid pressure diffusion, mainly at the edge of the aseismic slip area (Figs. 4c and 4f).
During the swarm, the repeaters may be explained by the cyclic evolution of fluid pressure that increases during the quiescent phases and decreases with the aseismic slips. The repeaters are likely triggered by the aseismic slip episodes, which load and break at each cycle the same locked asperities. However, once several repetitive ruptures occur, different processes may cause their seismic activities to vanish. In particular, the fluid pressure may flow into the asperities and reduces their strength, the accumulated stresses over time may be fully released or the asperity friction may be reduced until it becomes aseismic. Therefore, subsequent slips on these asperities are then aseismic as on the surrounding parts of the fault.
Such imbricated driving processes of pressure build-up phases alternating with aseismic slip episodes can be clearly seen at least at four different times from days 272 to 275 (Figs. 3a and 4). Each time a new cycle occurs, the aseismic slip develops further in association with a faster fluid diffusion through dilatancy, and a larger pressurized area. Therefore, the fluid diffusion velocity controls the average growth of the swarm and its migration velocity, even if the swarm is discontinuously growing. Later in the swarm, cycles of pressure build-up and aseismic slip may still occur, but the bursts of seismicity are less visible as this process is likely intertwined with other process, including pressure and stress rebalance.
Such an interplay of both fluid diffusion and aseismic deformation in the driving processes of seismicity was observed in controlled fluid injection experiments (De Barros et al., 2018; Guglielmi et al., 2015) and reservoir stimulations (Bourouis and Bernard, 2007; Eyre et al., 2019; Wei et al., 2015). It was also described during natural seismic swarms, such as the Mogul sequence (Ruhl et al., 2016), the Virginia city swarm (Hatch et al., 2020) and the Sendai-Okura swarm (Yoshida and Hasegawa, 2018). In all cases, alternating phases of slow seismic diffusion and bursts with fast migration suggest that complex and intertwined processes are at play.
4. Conclusion
The high extensional deformation rate of the Corinth Gulf is mainly accommodated by seismic swarms, and occasionally by mainshocks (Duverger et al., 2018). Focusing on a small and short prolific swarm, we observe that fluid diffusion at slow migration velocity of the order of m/day dominantly controls the overall migration of the seismicity. However, our analysis also highlights that within the seismic cloud, this migration is composed of short seismic bursts with migration velocity of the order of km/day, consistent with slow-slip migration. We therefore propose that the swarm activity is controlled by phases of fluid pressure build-up that trigger aseismic slip. The latter may then trigger sequences of rapid migration seismicity by stress transfer into the earthquake-prone asperities of the fault. This study illustrates how multiple driving processes jointly control the evolution of a seismic swarm.
Acknowledgments
The seismic array installation was funded in REAKT program (ID:282862, FP7-ENVIRONMENT) and performed in a NKUA-CNRS collaboration. We greatly thank all the participants to operations.Data are collected by the Corinth Rift Laboratory (crlab.eu) and distributed by RESIF data center (dx.doi.org/10.15778/RESIF.CL and dx.doi.org/10.7914/SN/HP). We thanks the editor Gavin Hayes, A. Hotovec-Ellis and K. Yoshida for their useful comments.
References
Avallone, A., Briole, P., Agatza-Balodimou, A.M., Billiris, H., Charade, O., Mitsakaki, C., Nercessian, A., Papazissi, K., Paradissis, D., Veis, G., 2004. Analysis of eleven years of deformation measured by GPS in the Corinth Rift Laboratory area. Comptes Rendus Geosci. 336, 301–311.
Bernard, P., Briole, P., Meyer, B., Lyon-Caen, H., Gomez, J.-M., Tiberi, C., Berge, C., Cattin, R., Hatzfeld, D., Lachet, C., 1997. The M s= 6.2, June 15, 1995 Aigion earthquake (Greece): evidence for low angle normal faulting in the Corinth rift. J. Seismol. 1, 131–150.
Bernard, P., Lyon-Caen, H., Briole, P., Deschamps, A., Boudin, F., Makropoulos, K., Papadimitriou, P., Lemeille, F., Patau, G., Billiris, H., 2006. Seismicity, deformation and seismic hazard in the western rift of Corinth: New insights from the Corinth Rift Laboratory (CRL). Tectonophysics 426, 7–30.
Bhattacharya, P., Viesca, R.C., 2019. Fluid-induced aseismic fault slip outpaces pore-fluid migration. Science 364, 464–468. https://doi.org/10.1126/science.aaw7354
Bourouis, S., Bernard, P., 2007. Evidence for coupled seismic and aseismic fault slip during water injection in the geothermal site of Soultz (France), and implications for seismogenic transients. Geophys. J. Int. 169, 723–732. Bourouis, S., Cornet, F.H., 2009. Microseismic activity and fluid fault interactions: some results from the Corinth Rift
Laboratory (CRL), Greece. Geophys. J. Int. 178, 561–580.
Brune, J.N., 1970. Tectonic stress and the spectra of seismic shear waves from earthquakes. J. Geophys. Res. 75, 4997– 5009.
Cappa, F., Scuderi, M.M., Collettini, C., Guglielmi, Y., Avouac, J.-P., 2019. Stabilization of fault slip by fluid injection in the laboratory and in situ. Sci. Adv. 5, eaau4065. https://doi.org/10.1126/sciadv.aau4065
Chen, X., Shearer, P.M., Abercrombie, R.E., 2012. Spatial migration of earthquakes within seismic clusters in Southern California: Evidence for fluid diffusion. J. Geophys. Res. Solid Earth 117. https://doi.org/10.1029/2011JB008973 Chiaraluce, L., Valoroso, L., Piccinini, D., Di Stefano, R., De Gori, P., 2011. The anatomy of the 2009 L’Aquila normal fault
system (central Italy) imaged by high resolution foreshock and aftershock locations. J. Geophys. Res. Solid Earth 116.
Daniel, G., Prono, E., Renard, F., Thouvenot, F., Hainzl, S., Marsan, D., Helmstetter, A., Traversa, P., Got, J.-L., Jenatton, L., 2011. Changes in effective stress during the 2003–2004 Ubaye seismic swarm, France. J. Geophys. Res. Solid Earth 116.
De Barros, L., Baques, M., Godano, M., Helmstetter, A., Deschamps, A., Larroque, C., Courboulex, F., 2019. Fluid-Induced Swarms and Coseismic Stress Transfer: A Dual Process Highlighted in the Aftershock Sequence of the 7 April 2014 Earthquake (Ml 4.8, Ubaye, France). J. Geophys. Res. Solid Earth 124, 3918–3932.
https://doi.org/10.1029/2018JB017226
De Barros, L., Bean, C.J., Zecevic, M., Brenguier, F., Peltier, A., 2013. Eruptive fracture location forecasts from high-frequency events on Piton de la Fournaise Volcano. Geophys. Res. Lett. 40, 4599–4603.
https://doi.org/10.1002/grl.50890
De Barros, L., Deschamps, A., Sladen, A., Lyon-Caen, H., Voulgaris, N., 2017. Investigating Dynamic Triggering of Seismicity by Regional Earthquakes: The Case of the Corinth Rift (Greece). Geophys. Res. Lett. 44, 10,921-10,929.
De Barros, L., Guglielmi, Y., Rivet, D., Cappa, F., Duboeuf, L., 2018. Seismicity and fault aseismic deformation caused by fluid injection in decametric in-situ experiments. Comptes Rendus Geosci., Invited contributions by 2016–2017
geoscience laureates of the French Academy of Sciences 350, 464–475. https://doi.org/10.1016/j.crte.2018.08.002
Dublanchet, P., Godano, M., Bernard, P., 2015. Inferring fault mechanical conditions from the source parameters of a complex microseismic multiplet in the Corinth rift, Greece. J. Geophys. Res. Solid Earth 120, 7655–7682. Duverger, C., Godano, M., Bernard, P., Lyon-Caen, H., Lambotte, S., 2015. The 2003–2004 seismic swarm in the western
Corinth rift: Evidence for a multiscale pore pressure diffusion process along a permeable fault system. Geophys. Res. Lett. 42, 7374–7382.
Duverger, C., Lambotte, S., Bernard, P., Lyon-Caen, H., Deschamps, A., Nercessian, A., 2018. Dynamics of microseismicity and its relationship with the active structures in the western Corinth Rift (Greece). Geophys. J. Int. 215, 196–221. Eyre, T.S., Eaton, D.W., Zecevic, M., D’Amico, D., Kolos, D., 2019. Microseismicity reveals fault activation before M w 4.1
hydraulic-fracturing induced earthquake. Geophys. J. Int. 218, 534–546.
Ford, M., Rohais, S., Williams, E.A., Bourlange, S., Jousselin, D., Backert, N., Malartre, F., 2013. Tectono-sedimentary evolution of the western Corinth rift (Central Greece). Basin Res. 25, 3–25. https://doi.org/10.1111/j.1365-2117.2012.00550.x
Gao, H., Schmidt, D.A., Weldon, R.J., 2012. Scaling Relationships of Source Parameters for Slow Slip Events. Bull. Seismol. Soc. Am. 102, 352–360. https://doi.org/10.1785/0120110096
Gautier, S., Latorre, D., Virieux, J., Deschamps, A., Skarpelos, C., Sotiriou, A., Serpetsidaki, A., Tselentis, A., 2006. A new passive tomography of the Aigion area (Gulf of Corinth, Greece) from the 2002 data set. Pure Appl. Geophys. 163, 431–453.
Guglielmi, Y., Cappa, F., Avouac, J.-P., Henry, P., Elsworth, D., 2015. Seismicity triggered by fluid injection–induced aseismic slip. Science 348, 1224–1226. https://doi.org/10.1126/science.aab0476
Hainzl, S., 2004. Seismicity patterns of earthquake swarms due to fluid intrusion and stress triggering. Geophys. J. Int. 159, 1090–1096.
Hatch, R.L., Abercrombie, R.E., Ruhl, C.J., Smith, K.D., 2020. Evidence of Aseismic and Fluid-Driven Processes in a Small Complex Seismic Swarm Near Virginia City, Nevada. Geophys. Res. Lett. 47, e2019GL085477.
https://doi.org/10.1029/2019GL085477
Kaneko, Y., Shearer, P.M., 2014. Seismic source spectra and estimated stress drop derived from cohesive-zone models of circular subshear rupture. Geophys. J. Int. 197, 1002–1015.
Kapetanidis, V., Deschamps, A., Papadimitriou, P., Matrullo, E., Karakonstantis, A., Bozionelos, G., Kaviris, G., Serpetsidaki, A., Lyon-Caen, H., Voulgaris, N., 2015. The 2013 earthquake swarm in Helike, Greece: seismic activity at the root of old normal faults. Geophys. J. Int. 202, 2044–2073.
Keranen, K.M., Weingarten, M., 2018. Induced Seismicity. Annu. Rev. Earth Planet. Sci. 46, 149–174. https://doi.org/10.1146/annurev-earth-082517-010054
Lambotte, S., Lyon-Caen, H., Bernard, P., Deschamps, A., Patau, G., Nercessian, A., Pacchiani, F., Bourouis, S., Drilleau, M., Adamova, P., 2014. Reassessment of the rifting process in the Western Corinth Rift from relocated seismicity. Geophys. J. Int. 197, 1822–1844.
Liu, Y., Rubin, A.M., 2010. Role of fault gouge dilatancy on aseismic deformation transients. J. Geophys. Res. Solid Earth 115. https://doi.org/10.1029/2010JB007522
Llenos, A.L., McGuire, J.J., Ogata, Y., 2009. Modeling seismic swarms triggered by aseismic transients. Earth Planet. Sci. Lett. 281, 59–69.
Lohman, R.B., McGuire, J.J., 2007. Earthquake swarms driven by aseismic creep in the Salton Trough, California. J. Geophys. Res. Solid Earth 112.
McNutt, S.R., 2005. Volcanic seismology. Annu Rev Earth Planet Sci 32, 461–491.
Parcharidis, I., Kourkouli, P., Karymbalis, E., Foumelis, M., Karathanassi, V., 2011. Time Series Synthetic Aperture Radar Interferometry for Ground Deformation Monitoring over a Small Scale Tectonically Active Deltaic Environment (Mornos, Central Greece). J. Coast. Res. 325–338. https://doi.org/10.2112/JCOASTRES-D-11-00106.1
Parotidis, M., Rothert, E., Shapiro, S.A., 2003. Pore-pressure diffusion: A possible triggering mechanism for the earthquake swarms 2000 in Vogtland/NW-Bohemia, central Europe. Geophys. Res. Lett. 30.
https://doi.org/10.1029/2003GL018110
Rigo, A., Lyon-Caen, H., Armijo, R., Deschamps, A., Hatzfeld, D., Makropoulos, K., Papadimitriou, P., Kassaras, I., 1996. A microseismic study in the western part of the Gulf of Corinth (Greece): implications for large-scale normal faulting mechanisms. Geophys. J. Int. 126, 663–688.
Roland, E., McGuire, J.J., 2009. Earthquake swarms on transform faults. Geophys. J. Int. 178, 1677–1690.
Ruhl, C.J., Abercrombie, R.E., Smith, K.D., Zaliapin, I., 2016. Complex spatiotemporal evolution of the 2008 Mw 4.9 Mogul earthquake swarm (Reno, Nevada): Interplay of fluid and faulting. J. Geophys. Res. Solid Earth 121, 8196–8216. Shapiro, S.A., Huenges, E., Borm, G., 1997. Estimating the crust permeability from fluid-injection-induced seismic emission
at the KTB site. Geophys. J. Int. 131, F15–F18.
Shapiro, S.A., Rothert, E., Rath, V., Rindschwentner, J., 2002. Characterization of fluid transport properties of reservoirs using induced microseismicity. Geophysics 67, 212–220.
Sibson, R.H., 1990. Conditions for fault-valve behaviour. Geol. Soc. Lond. Spec. Publ. 54, 15–28. https://doi.org/10.1144/GSL.SP.1990.054.01.02
Stein, R.S., 1999. The role of stress transfer in earthquake occurrence. Nature 402, 605.
Uchida, N., Bürgmann, R., 2019. Repeating earthquakes. Annu. Rev. Earth Planet. Sci. 47, 305–332.
Utsu, T., Ogata, Y., 1995. The centenary of the Omori formula for a decay law of aftershock activity. J. Phys. Earth 43, 1–33. Vallée, M., Nocquet, J.-M., Battaglia, J., Font, Y., Segovia, M., Regnier, M., Mothes, P., Jarrin, P., Cisneros, D., Vaca, S., 2013.
Intense interface seismicity triggered by a shallow slow slip event in the Central Ecuador subduction zone. J. Geophys. Res. Solid Earth 118, 2965–2981.
Vidale, J.E., Shearer, P.M., 2006. A survey of 71 earthquake bursts across southern California: Exploring the role of pore fluid pressure fluctuations and aseismic slip as drivers. J. Geophys. Res. Solid Earth 111.
Waldhauser, F., Ellsworth, W.L., 2000. A double-difference earthquake location algorithm: Method and application to the northern Hayward fault, California. Bull. Seismol. Soc. Am. 90, 1353–1368.
Wei, S., Avouac, J.-P., Hudnut, K.W., Donnellan, A., Parker, J.W., Graves, R.W., Helmberger, D., Fielding, E., Liu, Z., Cappa, F., 2015. The 2012 Brawley swarm triggered by injection-induced aseismic slip. Earth Planet. Sci. Lett. 422, 115–125. Yoshida, K., Hasegawa, A., 2018. Sendai-Okura earthquake swarm induced by the 2011 Tohoku-Oki earthquake in the stress
shadow of NE Japan: Detailed fault structure and hypocenter migration. Tectonophysics, Physics of Earthquake Rupture Propagation 733, 132–147. https://doi.org/10.1016/j.tecto.2017.12.031