HAL Id: hal-02045615
https://hal.archives-ouvertes.fr/hal-02045615
Submitted on 26 Feb 2020HAL is a multi-disciplinary open access
archive for the deposit and dissemination of sci-entific research documents, whether they are pub-lished or not. The documents may come from teaching and research institutions in France or abroad, or from public or private research centers.
L’archive ouverte pluridisciplinaire HAL, est destinée au dépôt et à la diffusion de documents scientifiques de niveau recherche, publiés ou non, émanant des établissements d’enseignement et de recherche français ou étrangers, des laboratoires publics ou privés.
Monazite, rhabdophane, xenotime & churchite:
Vibrational spectroscopy of gadolinium phosphate
polymorphs
Nicolas Clavier, Adel Mesbah, Stephanie Szenknect, N. Dacheux
To cite this version:
Nicolas Clavier, Adel Mesbah, Stephanie Szenknect, N. Dacheux. Monazite, rhabdophane, xenotime & churchite: Vibrational spectroscopy of gadolinium phosphate polymorphs. Spec-trochimica Acta Part A: Molecular and Biomolecular Spectroscopy, Elsevier, 2018, 205, pp.85-94. �10.1016/j.saa.2018.07.016�. �hal-02045615�
Monazite, rhabdophane, xenotime & churchite :
vibrational spectroscopy of gadolinium phosphate
polymorphs
N. Clavier
1,*, A. Mesbah
1, S. Szenknect
1, N. Dacheux
11 ICSM, CEA, CNRS, ENSCM, Univ Montpellier, Site de Marcoule, BP 17171, 30207 Bagnols/Cèze
cedex, France
* Corresponding author: Dr. Nicolas CLAVIER
ICSM, CEA, CNRS, ENSCM, Univ Montpellier Site de Marcoule
BP 17171
30207 Bagnols sur Cèze France
Phone : + 33 4 66 33 92 08 Fax : + 33 4 66 79 76 11 nicolas.clavier@icsm.fr
Abstract :
Rare-earth phosphates with the general formula REEPO4·nH2O belong to four distinct
structural types: monazite, rhabdophane, churchite, and xenotime. We report herein the first direct comparison between vibrational spectra of these compounds for the same metal cation i.e. gadolinium. The four GdPO4·nH2O samples were prepared through wet chemistry methods
and first characterized by X-Ray Diffraction. Three distinct spectral domains, associated to the deformation and stretching modes of phosphate tetrahedra (PO4) and to water molecules
vibrations were then analyzed from FTIR and Raman data, and discussed regarding the structural characteristics of each sample. The most obvious differences between the spectra were associated to (H2O) and s(PO4) modes and led to propose a simple method to rapidly
and unambiguously discriminate the four polymorphs.
1. Introduction
Rare-earth phosphate minerals with the general formula REEPO4·nH2O belong to four
distinct structural types, mainly depending on their hydration content and the atomic weight of the rare-earth elements incorporated (i.e. light or heavy REE) [1]. Among them, monazite LnPO4 (hexagonal, P21/n), typically crystallizing with Ln = La-Tb [2], is probably the most
widespread in nature and is therefore widely documented. Monazite constitutes one of the main ores exploited for lanthanide extraction, and naturally bears high contents in uranium and thorium (up to 15 wt.%), mainly through coupled substitutions with divalent elements such as calcium [3]. For heavy rare-earth elements, i.e. Ln = Gd-Lu, as well as for yttrium and scandium, anhydrous LnPO4 phase adopts the zircon structure type (tetragonal, I41/amd) [4],
leading to the formation of xenotime. This latter frequently coexists with monazite within granitic and metamorphic rocks [5].
In comparison, related hydrated counterparts are far less present in nature. For light rare-earth elements, rhabdophane LnPO4·0.667H2O (monoclinic, C2) [6], is frequently restricted to
the uppermost portion of the crust due to its metastable character regarding to monazite [7]. Hence, rhabdophane is one of the main LREE carriers in bauxite, laterites and hydrothermal systems, while monazite dominates in magmatic and metamorphic silicic rocks [8]. Finally, churchite is most often reported with the ideal formulae YPO4·2H2O (monoclinic, isostructural
to gypsum) and also contains variable amounts of heavy rare-earth elements such as dysprosium and erbium. It was found in association with limonite deposits, but also in laterites [9]. One must note that this mineral is still frequently called as weinschenkite even if this name was early discarded by the Commission on New Minerals and Mineral Names [10].
Owing to their numerous potential applications in several fields of research, such as phosphor light emitters [11], geochronometers [12], thermal barrier coatings [13] or ceramics for the storage [14, 15] or the transmutation [16] of nuclear waste, REEPO4·nH2O compounds
were investigated through a wide range of physico-chemical techniques of characterization. Among them, vibrational spectroscopy was frequently considered, due to its easy operation and to the intense signal provided by the vibration modes of the PO4 tetrahedra. As a matter of fact,
Raman spectra were used to validate the formation of monazite-type BkPO4, CfPO4, and EsPO4,
which remain up to now among the few samples prepared at a weighable scale with these heavy transuranic elements [17]. Raman spectroscopy was also demonstrated for long as a powerful tool in the analysis of scarce natural samples, such as REEPO4·2H2O churchite [18].
Along with the studies devoted to minerals, numerous works were also undertaken on synthetic samples series. Once again, monazite-type compounds were widely investigated, most often through comparisons along the light lanthanides series (Ln = La-Gd) [19-21] which allowed to point out a shift of the vibration modes towards the highest wavenumbers with the atomic number of the cation. Isostructural cheralite samples incorporating tetravalent actinides also present similar spectroscopic features [22]. In comparison, the studies concerning the xenotime series, obtained for heavy rare earth elements (Ln = Tb – Lu) [20, 23], appear to be more ancient and scarce. However, recent works renewed the interest for spectroscopy in this field, with some works dealing with the calculations of vibrational dynamics [24] and to the behavior of xenotime samples under pressure [25]. Quite similarly, only the Assaoudi’s group undertook systematic spectroscopic investigations of the hydrated rare earth phosphates, rhabdophane and churchite [26, 27].
However, if the evolution of the vibrational spectra was studied for each REEPO4·nH2O
structural type as a function of the metal center, no study compared FTIR and Raman spectra of the four polymorphs for the same cation. This lack probably arises from the difficulty to stabilize the different phases for one given lanthanide element, gadolinium being the only one possible. Indeed, if GdPO4 monazite as well as GdPO4·0.667H2O rhabdophane are well
described [28, 29], a very limited number of synthesis protocols is available for xenotime and churchite [30]. The present study then reports for the first time the direct comparison of both Raman and FTIR spectra of the four gadolinium phosphate structures and establishes connections between their crystal structure, including symmetry of PO4 groups and hydrogen
2. Experimental
2.1 Preparation and characterization of the samples
All the samples were synthesized from GdCl3·6H2O (99%) as well as concentrated
H3PO4 (85%) and HCl, all supplied by Sigma-Aldrich. In order to avoid any weighing bias due
to the hygroscopic character of the gadolinium salt, this latter was first dissolved in 1M HCl. Gadolinium concentration was finally accurately determined by Inductively Coupled Plasma Atomic Emission Spectroscopy (ICP-AES) and was always in the 0.5-1M range.
GdPO4·0.667H2O rhabdophane [6] was obtained following the protocol reported in our
previous work [7]. Hydrochloric solution containing gadolinium was mixed with 5M H3PO4 in
a PTFE-lined vessel, an excess of 2 mol.% being considered to ensure the quantitative precipitation of the cations. The container was then transferred into an oven and left at 90°C for two weeks. The precipitate formed afterwards was recovered by centrifugation at 14000 rpm, then successively washed twice with deionized water and once with ethanol, and finally dried overnight in air at 90°C. The GdPO4 monazite counterpart was obtained by heating the former
compound at 1100°C for 6 hours in air. These firing conditions were chosen in order to fully convert rhabdophane into monazite, the transition being reported around 850°C [31].
GdPO4·2H2O churchite was obtained through a similar protocol than that described for
the preparation of rhabdophane. However, in this case, the mixture of reactants was placed in a fridge at 4°C for several months. Separation of the precipitate, as well as washing and drying steps were repeated as described above. Finally, GdPO4 xenotime was prepared after firing the
churchite precursor at 1000°C for 6 hours in air [30].
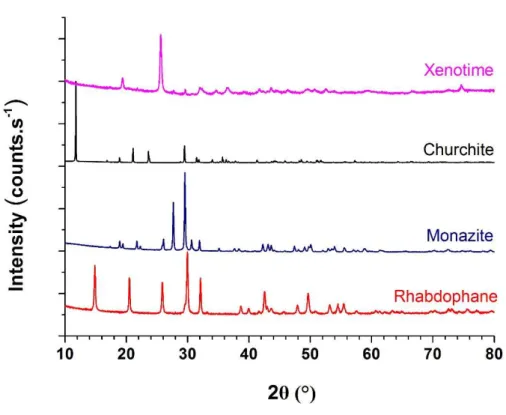
The nature of the various GdPO4·nH2O phases prepared was first checked by the means
of powder X-ray diffraction (PXRD) using a Bruker D8 advance diffractometer equipped with a lynxeye detector and having copper radiation (λ=1.54184Å). The collected patterns confirm the formation of four different polymorphs (Figure 1), in good agreement with the structures reported in the literature for Gd-based monazite (PDF file #01-083-0657 [4]), xenotime (#00-062-824 [32]), rhabdophane (#00-039-0232) and churchite (#00-021-0337 [33]). Associated unit cell parameters obtained from Rietveld refinement are gathered in Table 1.
Figure 1. XRD patterns obtained for the four gadolinium phosphate samples.
Table 1. Unit cell parameters determined for GdPO4·nH2O samples.
a (Å) b (Å) c (Å) β (°) V (Å3)
Rhabdophane 28.0273(2) 6.9262(1) 11.9914(1) 115.17(1) 2106.67(4) Monazite 6.6515(1) 6.8446(1) 6.3340(2) 104.02(1) 279.77(1) Churchite 6.2102(1) 15.1104(2) 5.6162(1) 114.95(1) 477.81(2)
Xenotime 6.9612(7) 6.1026(10) 295.73(9)
As previously stated, Gd-monazite adopts a P21/n monoclinic structure. This latter is
based on the widely-described nine-fold coordination of the cation which can be described as a pentagon interpenetrated by a distorted tetrahedron. These REEO9 polyhedra then form chains
along the [001] direction [2]. Within the xenotime structure, the PO4 tetrahedra share corners
and edges with REEO8 polyhedra, which themselves share edges together to form chains
parallel to the [100] direction. These chains are cross-linked with PO4 units by sharing corners.
consists in a shift of the (100) planes along with a slight rotation of the PO4 tetrahedra around
[001].
Described for long as an hexagonal structure, GdPO4·0.667H2O rhabdophane was only
recently reported to crystallize in the monoclinic system in the C2 space group. The structural arrangement consists in infinite channels oriented along the [101] direction and formed by the connection of six chains. One must note that the channels contain two types of chains, depending on the coordination of the cation which can be 8 or 9 [6].
Finally, the churchite crystallizes in the gypsum structure type in the C2/c space group of the monoclinic system [34]. Each Gd atom is coordinated to 8 oxygen atoms, six being provided by the phosphate groups and two by water molecules, to form distorted square antiprisms. These polyhedra are separated by phosphate groups and form infinite 2D layers stacked down the b axis.
Figure 2. View of the structure of : a) GdPO4.0.667 rhabdophane (along the [101] direction; b)
GdPO4 monazite ([100] direction); c) GdPO4·2H2O churchite ([001] direction); d)
2.2. Raman spectroscopy
Raman spectra were recorded by the means of a Horiba - Jobin Yvon Aramis apparatus equipped with an edge filter and using a Nd:YAG laser (532 nm). In order to avoid any laser-induced degradation of the compound, the power was turned down by the means of optical filters to about 1-4 mW depending on the sample analyzed. The laser beam was then focused on a small fraction of powder simply deposited on a glass lamella using an Olympus BX 41 microscope. A 100 objective with a numerical aperture of 0.9, resulting in a spot size of about 1 m2 was used. The scattered Raman light was collected in a 180° backscattering geometry
and dispersed by a grating of 1800 grooves/mm after having passed a 150 µm entrance slit, resulting in a spectral resolution lower than 1 cm-1.For each spectrum, a dwell time of 90 to
180 seconds was considered with an average of 3 scans. Before analysis, the apparatus was calibrated with a silicon wafer, using the first-order Si line at 520.7 cm-1.
2.3. FTIR spectroscopy
FTIR spectra were recorded in the 380-4000 cm-1 range thanks to a Perkin-Elmer FTIR
Spectrum 100 device. Powdered samples were deposited at the surface of an ATR crystal without any prior preparation. The spectra collected in such operating conditions exhibited a resolution lower than 2 cm-1.
3. Results and discussion
3.1 General overview
The FTIR and Raman spectra recorded for the four gadolinium phosphate polymorphs are gathered in Figure 3. Band component analysis of the different data sets was carried out by the means of the Jandel Peakfit software, using pseudo-Voigt functions (Gaussian-Lorenzian ratio systematically higher than 0.7) with the minimum number of components. Correlation coefficients R2 greater than 0.992 were usually obtained for the results reported in Table 2.
Figure 3. FTIR and Raman spectra recorded for the four gadolinium phosphate polymorphs : rhabdophane, monazite, churchite and monazite.
4000 3600 3200 2800 2400 2000 1600 1200 800 400 T ra n s m it ta n ce ( % ) Wavenumber (cm-1) Xenotime Churchite Monazite Rhabdophane 4000 3500 3000 2500 2000 1500 1000 500 In te n s it y (c o u n ts .s -1 ) Xenotime Churchite Monazite Raman shift (cm-1 ) Rhabdophane
Table 2. Assignment of the vibration bands observed on the FTIR and Raman spectra recorded for the four gadolinium phosphate polymorphs: rhabdophane, monazite, churchite and monazite. Bands indicated into parenthesis are shoulders.
Band assignment
Rhabdophane Monazite Churchite Xenotime FTIR Raman FTIR Raman FTIR Raman FTIR Raman
(H2O) 3535 3540 3365 3380 3475 3470 3132 (3280) 3350 (3330) (2870) 3210 (2360) 3125 (H2O) (1630) 1705 1615 (1690) 1630 (1610) as(PO4) 1070 1106 1137 1092 1052 1058 1117 1057 1027 1103 1071 1085 1046 1001 (1070) 1042 1045 1013 1022 1004 s(PO4) 972 994 995 987 995 977 988 991 (930) 985 960 (943) 928 984 (933) (878) (870) as(PO4) 620 634 (642) 632 (649) (634) 636 646 576 585 623 598 630 560 (616) 586 538 547 585 577 521 578 574 570 (567) 566 567 538 539 549 557 523 (513) s(PO4) (506) 471 492 476 (493) 497 481 (646) 429 428 (458) (483) Lattice modes 404 362 364 346 332
All the spectra recorded for the four polymorphs could be split in three distinct zones of interest. The first one, comprised between 300 and 800 cm-1, corresponds to the deformation
modes of the PO4 tetrahedron, while stretching modes led to characteristic bands in the
900-1200 cm-1 range. If these regions are similar for the various compounds studied herein, the
number of vibration bands assigned to PO4 groups differs depending on the crystal symmetry
of the samples. The subsequent factor group analysis was reported by many authors for monazite [19-21], including recent papers bringing ab initio simulations to the state of the art [35]. Meanwhile, some data also exists in the literature for xenotime [20] and churchite [27]. However, it has to be reconsidered for rhabdophane due to the recent description of its structure as monoclinic (C2 space group) instead of the hexagonal P6222 [6]. Up to date, factor group
analysis is then presented in Table 3. In parallel, the vibration bands assigned to the water molecules can be found between 1500 and 1700 cm-1 (bending) and around 3600 cm-1
(stretching). The results corresponding to these three different regions, i.e. to stretching and bending modes of phosphate entities, then to structural water vibrations, will be discussed in the following sections.
Table 3. Correlation of free PO4 ion and the corresponding factor groups of gadolinium
phosphate polymorphs.
Free ion Site
symmetry Factor group symmetry Td C1 C2h M on az it e A1 9 Ag E 9 A 9 Bg 9 Au 2 F2 9 Bu Td D2d D4h X en ot im e A1 E 2 F2 2 A1 2 A1g 1 A1u B1 2 A2u 2 B1g 2 B2 B2g 2 B2u 2 E 2 Eg 2 Eu Td C1 C2 R h ab d . A1 5 A E 9 A 2 F2 4 B Td C2 C2h C h u rc h it e A1 E 2 F2 5 A 4 B 5 Ag 4 Bg 5 Au 4 Bu
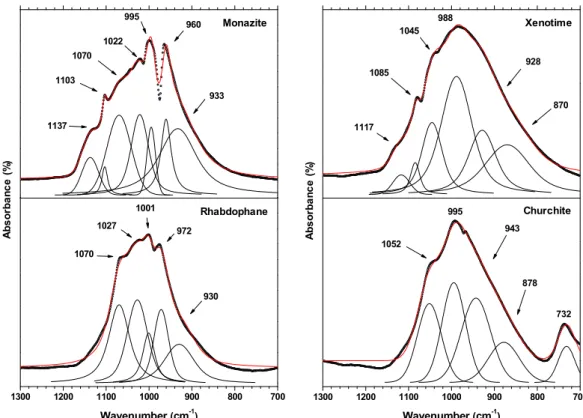
3.3 Phosphate stretching modes
The stretching modes of the PO4 groups are observed in the Raman spectra gathered in
Figure 4. In this zone (900-1200 cm-1), the symmetric vibration, frequently labelled as 1,
appears to be located on a very small wavenumber range for the four crystal structures considered, i.e. at 977, 984, 987 and 994 cm-1 for churchite, xenotime, monazite and
rhabdophane, respectively. On this basis, the wavenumber assigned to the s(PO4) vibrations
can be hardly used to accurately discriminate the various polymorphs even if some differences can be underlined concerning the number of band components. Indeed, monazite and churchite led to a single vibration band, while shoulders can be observed for xenotime (991 cm-1, i.e. at
higher wavenumber than the main vibration band) and rhabdophane (985 cm-1, i.e. at lower
wavenumber).
On the other hand, the vibrations associated to the antisymmetric stretching mode (3)
located above 1040 cm-1 are generally of lower intensity. Nevertheless, they present significant
differences depending on the sample considered, particularly concerning the position of the main vibration band. Indeed, the wavenumber of the band with the maximal intensity varies from 1048 cm-1 for xenotime to 1058, 1071 and 1108 cm-1 for churchite, monazite and
rhabdophane, respectively. Even if no clear correlation can be established between the P-O distance in the different structures and the 3 wavenumber, the lowest wavenumbers were
measured for xenotime and churchite. In both these structural type, gadolinium is eight-fold coordinated, while its coordination is 9 for rhabdophane and monazite. This lower coordination state results in shorter Gd-O distances, then in longest P-O lengths, in good agreement with the position of the PO4 stretching bands in the spectra. One must also note that if only one
antisymmetric vibration band is observed for rhabdophane and churchite, several smaller vibration bands were detected for monazite and xenotime. Particularly, the existence of three bands of weak intensity at around 1000, 1040, and 1090 cm-1 for GdPO
4 monazite, that was
already evidenced by Begun et al. and also observed for the other members of the LnPO4 series
Figure 4. Raman spectra recorded in the 900-1200 cm-1 domain for gadolinium-bearing
rhabdophane, monazite, churchite and monazite.
Compared to Raman ones, the FTIR spectra (Figure 5) recorded for the four samples appear much more convoluted. Indeed, a wide massif was systematically recorded between 800 and 1200 cm-1, which makes it difficult to unambiguously discriminate the components
assigned to symmetric and antisymmetric stretching vibration modes. Nevertheless, a sharp band can be observed for rhabdophane (at 972 cm-1) and monazite (at 960 cm-1). It could be
assigned to the 1 symmetrical stretching mode. Also, these values are in good agreement with
that recently reported by Heuser et al. [21]. For xenotime and churchite, the resolution of the spectra collected was probably lowered by the crystallization state. Also, it might arise from the presence of bands related to forbidden vibration modes. Nevertheless, a simple first-basis approach could be considered in this case by assigning all the vibration bands above 1000 cm -1 to antisymmetric stretching vibration modes (
3). Finally, one must note that a specific
vibration mode related to water molecules can be observed for churchite at 732 cm-1. It will be
discussed in the dedicated section.
1200 1150 1100 1050 1000 950 900 1106 994 985 Raman shift (cm-1 ) 1092 1071 1042 1004 987 1200 1150 1100 1050 1000 950 900 1058 977 Raman shift (cm-1 ) In te n s it y (c o u n ts .s -1) Xenotime Churchite In te n s it y (c o u n ts .s -1) Monazite Rhabdophane 1057 1046 1013 991 984
Figure 5. FTIR spectra recorded in the 700-1300 cm-1 range for gadolinium bearing
rhabdophane, monazite, churchite and monazite.
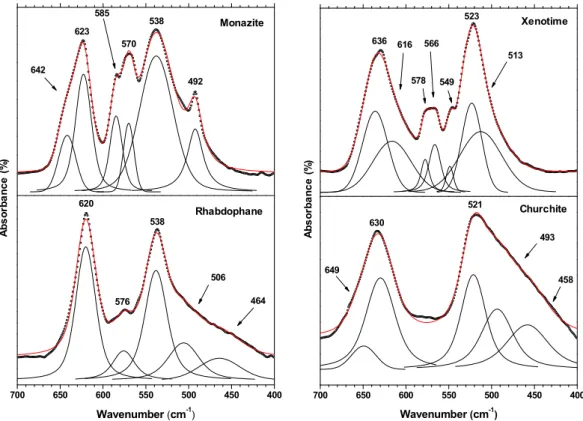
3.4 Phosphate deformation modes
The Raman spectral zone corresponding to the bending modes of the PO4 groups is
mainly characterized by the presence of an intense band around 470-480 cm-1 (Figure 6) and
assigned to the symmetric vibration (frequently labelled as 2). As already noted by Silva et al.,
this mode occurs systematically as a broad band, regardless of any splitting of the degeneracy [19]. The position of this vibration mode appears to be weakly dependent on the structural type considered, with monazite, rhabdophane and xenotime features occurring on a 10 cm-1 range.
More specifically, churchite is characterized by the very low intensity of the 2 mode. For this
sample, the most intense band occurs at around 360 cm-1, i.e. just above the wavenumber
domain usually assigned to external vibration modes. Nevertheless, it was systematically correlated to phosphate internal modes in the literature [26, 27]. On the FTIR spectra, the 2
vibration mode of the PO4 units was observed for monazite, rhabdophane and churchite, even
if it appears frequently as a shoulder. For the two hydrated compounds, the existence of the 2
band confirms the C2 site symmetry proposed from crystal structure. On the contrary, the D2d
A b s o rb a n c e ( % ) Monazite Rhabdophane A b s o rb a n c e ( % ) Xenotime Churchite 1117 1085 1045 988 928 870 1300 1200 1100 1000 900 800 700 1070 1027 1001 972 Wavenumber (cm-1 ) 930 1300 1200 1100 1000 900 800 700 1052 995 943 878 Wavenumber (cm-1 ) 732 1137 1103 1070 1022 995 960 933
site symmetry of the phosphate groups in the xenotime structure leads the symmetrical bending vibration to be absent on the FTIR spectra [21].
Figure 6. Raman spectra recorded in the 400-800 cm-1 range for gadolinium based
rhabdophane and monazite and between 300 and 700 cm-1 for gadolinium based
churchite and monazite.
At higher wavenumber, i.e. typically between 500 and 700 cm-1, the antisymmetric
bending modes (4) mostly generate intense vibration bands in the FTIR spectra, which result
in some large massifs. For rhabdophane, churchite, and xenotime, two main bands were detected at around 520-540 cm-1 and 620-640 cm-1, while monazite exhibited more complex
features between 500 and 600 cm-1, which were sometimes depicted as the succession of two
doublets (538/570 then 585/623 cm-1) [36]. On the other hand, Raman spectra often present a
collection of several low-intensity bands, which wavenumbers match with that of FTIR vibrations. These latter then do not follow the geometry selection rules and probably come from the presence of solid defects. However, the structure of these additional bands can be considered as characteristic of a given structural type. Particularly, the various publications dealing with monazite-type samples systematically report bands at about 540, 580 and 600 cm-1 [19]. The
same applies for the quadruplet recorded between 557 and 586 cm-1 for xenotime.
404 567 632 598 577 539 476 428 800 750 700 650 600 550 500 450 400 634 585 547 471 Raman shift (cm-1) 429 700 650 600 550 500 450 400 350 300 634 560 497 483 Raman shift (cm-1 ) 362 In te n s it y (c o u n ts .s -1) Xenotime Churchite In te n s it y (c o u n ts .s -1) Monazite Rhabdophane 646 586 574 567 557 481 364 346 332
Figure 7. FTIR spectra recorded in the 400-700 cm-1 range for GdPO
4·nH2O rhabdophane,
monazite, churchite and monazite.
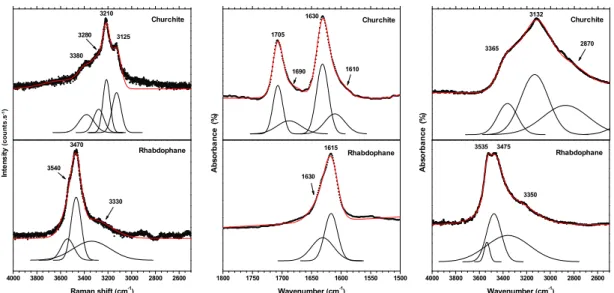
3.5 Water molecules
The spectral zones associated to the vibrations of water molecules, i.e. bending modes typically between 1500 and 1600 cm-1 and stretching modes above 3000 cm-1, were particularly
probed for GdPO4·0.667H2O rhabdophane and GdPO4·2H2O churchite samples, which are well
known to be hydrated compounds (Figure 8). One must note that a characteristic water rocking mode can also be observed for churchite on the FTIR spectra as a broad band at around 730 cm-1 [27]. Also, even if xenotime sometimes showed some weak intensity bands in the regions
mentioned above, it was more likely correlated to absorbed water due to the powder’s small grain size (thus to an important number of surface adsorption sites), and the existence of structural water molecule in the structure was ruled out.
Whether regarding FTIR or Raman spectra, the characteristic features of water molecules appear to be strongly different between churchite and rhabdophane. For the FTIR-active bending modes, churchite presents two distinct bands at 1630 and 1705 cm-1 with small
shoulders at lower wavenumbers (i.e. 1610 and 1690 cm-1) which can be assigned to forbidden
700 650 600 550 500 450 400 620 576 538 506 Wavenumber (cm-1 ) 464 A b s o rb a n c e ( % ) Xenotime Churchite A b s o rb a n c e ( % ) Monazite Rhabdophane 700 650 600 550 500 450 400 649 630 521 493 Wavenumber (cm-1 ) 458 636 616 578 566 549 523 513 642 623 585 570 538 492
vibration modes, while rhabdophane exhibits only strong vibration band at 1615 cm-1 with a
shoulder at 1630 cm-1. A similar behavior was observed for stretching modes, since more
complex signals were systematically recorded for churchite. As a matter of fact, rhabdophane only presented one main vibration at around 3500 cm-1 both in Raman and FTIR spectra, which
is accompanied by smaller shoulders. On the other hand, churchite is characterized by large massifs in the 3000-4000 cm-1 region, which are systematically composed by three components
or more.
Figure 8. Raman spectra in the 2500-4000 cm-1 range and FTIR spectra in the 1500-1800
cm-1 and 2500-4000 cm-1 regions, recorded for gadolinium rhabdophane,
monazite, churchite and monazite.
Such differences can be easily correlated to the crystal structure of the two compounds. Indeed, churchite bears two non-equivalent water molecules in its structure, one being strongly attached to the PO4 network and the other more loosely bound in the interlayer space [34, 37].
On this basis, the bending band observed at higher wavenumber (i.e. around 1700 cm-1) should
correspond to the longest bond distance, then to the less strongly coordinated water molecule. A similar assignment was already made for isostructural CaSO4·2H2O gypsum, for which the
second band (1685 cm-1) was found to progressively disappear upon dehydration while the first
one (1620 cm-1) remained present in the final CaSO
4·0.5H2O spectra [38]. Moreover, the
wavenumber of the stretching modes observed on the FTIR spectra can be used to evaluate the d(H···O) bond lengths in the hydrogen bond network thanks to the empirical relation established by Libowitzky from mineral samples (including silicates and phosphates) [39]. Based on the three band components at 2870, 3132 and 3365 cm-1, distances of about 1.67,
4000 3800 3600 3400 3200 3000 2800 2600 3535 3475 3350 Wavenumber (cm-1 ) 3365 3132 2870 A b so rb a n ce ( % ) Churchite Rhabdophane In te n s it y (c o u n ts .s -1) Churchite Rhabdophane 4000 3800 3600 3400 3200 3000 2800 2600 3540 3470 3330 Raman shift (cm-1 ) 3380 3280 3210 3125 A b so rb a n ce ( % ) Churchite Rhabdophane 1800 1750 1700 1650 1600 1550 1500 1630 1615 Wavenumber (cm-1 ) 1705 1690 1630 1610
1.76, and 1.89 Å, respectively, were obtained, which are in the same range of magnitude than those reported by Frost et al. for natural samples of Y-churchite [40].
In the case of rhabdophane, the recently revised structure includes four non-equivalent water molecules [6]. Nevertheless, all of them take part to the coordination of the metal center, resulting in a close set of M-Ow bond distances. As a consequence, both Raman and FTIR
spectra present strongly overlapping bands in the 3000-4000 cm-1 range. The narrowing of the
stretching vibration bands can also be associated to the decrease of the hydration content of the GdPO4 sample compared to churchite. Indeed, it led to the weakening of the hydrogen bonding
which generally tends to broaden the signal in this region [41]. Similarly, the existence of only one bending mode at 1615 cm-1 could be correlated to the quasi-equivalent nature of the water
molecules in the rhabdophane structure. Also, as in the case of churchite, a parallel can be drawn with hydrated forms of gypsum. Indeed, Mesbah et al. already stressed out the isostructural character of CaSO4·0.625H2O and rhabdophane, as well as that of CaSO4·0.5H2O with the
hexagonal LnPO4·0.5H2O [42]. Nevertheless, if numerous studies were undertaken concerning
the vibrational characterization of dehydrate and hemihydrate gypsum, no reference spectra seems to exist, to our knowledge, for CaSO4·0.625H2O. Only Fritz et al. reported a Raman
spectra for the selenite counterpart CaSeO4·0.625H2O [43] but without investigating the typical
wavenumber range of water molecules vibration. In these conditions, the FTIR and Raman data collected in this study for GdPO4·0.667H2O rhabdophane can be considered as a potential
first-basis approach to forecast the spectral characteristics of water in these compounds.
3.6 Discussion
The comparison of the vibrational spectra of LnPO4·nH2O lanthanide phosphate
polymorphs was undertaken for the first time using a single metal cation, i.e. gadolinium. Even if the assignment of the various vibration modes was reported for long in the literature for several monazite, rhabdophane, churchite and xenotime type samples, this direct comparison can be used to propose some guidelines to quickly discriminate the different structural types. First, whereas the symmetrical stretching vibrations of the phosphate tetrahedra usually led to the more intense vibration bands, they appeared to have very close wavenumbers. Also, their resolution is strongly dependent on the crystallization state of the samples, which can bias their analysis, particularly for natural samples. On this basis, their examination should be discarded to unambiguously identify the sample.
Conversely, the identification of water vibration modes seems to be the more rapid way to identify the crystal structure of any LnPO4·nH2O sample. Indeed, the existence of
well-defined vibration bands in the 1500-1600 cm-1 range of the FTIR spectra, related to the (H 2O)
modes, attests of the existence of structural water in the sample. Here, bending modes are to be preferred, as the spectral region associated to stretching vibration modes could also show some large bands in the presence of adsorbed water. Thereafter, the number of (H2O) modes easily
lead to identify the structure, churchite being associated to two bands, while rhabdophane only exhibits one single signal in this region.
For anhydrous samples adopting the xenotime or monazite structures, the main difference in the spectral signature probably comes from the vibrations associated to the phosphate bending modes. In the FTIR spectra, the s(PO4) mode (2) is inactive for the
tetragonal xenotime, while it led to one vibration band for the monoclinic monazite. Nevertheless, the corresponding signal is frequently merged into a large massif gathering both symmetric and anti-symmetric modes, which can hampers its identification. Then, we suggest to use the Raman data in this case. Indeed, xenotime presents only one intense 2 band, while
two signals are detected for monazite, the second band located at about 430 cm-1 being almost
as intense.
Based on these recommendations, a schematic methodology is proposed in Figure 9 to rapidly discriminate the four gadolinium phosphate polymorphs. Once again, it demonstrates the complementarity of FTIR and Raman spectroscopies, which have to be used together to unambiguously assign one of the four polymorphs. Also, as the method is mainly based on the number of vibration bands observed, it could be easily applied to any chemical system, including pure parent compounds or solid solutions involving several metal cations. In these conditions, it appears suitable for field investigations, particularly in the domain of geochemistry where monazite, rhabdophane, churchite and xenotime have already dragged a significant attention.
Figure 9. Schematic methodology for the discrimination of lanthanide phosphate polymorphs through vibrational spectroscopy.
4. Conclusion
Gadolinium phosphates with monazite, rhabdophane, churchite, and xenotime structures were analyzed by vibrational spectroscopy (FTIR and Raman), leading to the first direct comparison of LnPO4·nH2O polymorphs for a single metal cation. General overview led
to split the spectra into three zones, corresponding to the bending and the stretching vibration modes of phosphate tetrahedra and to the vibration modes of water molecules. For all the samples studied, the wavenumbers associated to s(PO4) bands were found to be very close,
and can be hardly used to discriminate the various structural type, despite of their important intensities. Conversely, phosphate bending modes were found to be more informative. Particularly, the number of bands observed on the Raman spectra can differentiate monazite from xenotime, provided that the presence of water molecules was previously ruled out. For hydrated samples, i.e. rhabdophane and churchite, the (H2O) modes were found to be
well-defined in FTIR spectra, and attested of the structural character of the water molecules. Moreover, the number of bands observed can once again be used to identify the structure of the GdPO4·nH2O sample.
The comparison of the vibrational spectroscopy data led to propose a simple methodology to rapidly discriminate the four LnPO4·nH2O polymorphs, which could be applied
during field investigations, for example in the domain of geochemistry.
Vibration bands between 1500 and 1600 cm-1
FT
IR
Number of bands between 1500 and 1600 cm-1
FT
IR Vibration band around
430 cm-1
Ra
m
an
Rhabdophane Churchite Monazite Xenotime
Yes
Yes
No
No
Acknowledgements
The authors would like to thank Clémence Gausse, Danwen Qin and Mariano Sandate Dominguez for their help during the synthesis of the gadolinium phosphate polymorphs.
References
[1] S.N. Achary, S. Bevara, A.K. Tyagi, Recent progress on synthesis and structural aspects of rare-earth phosphates, Coordin Chem Rev, 340 (2017) 266-297.
[2] N. Clavier, R. Podor, N. Dacheux, Crystal chemistry of the monazite structure, J Eur Ceram Soc, 31 (2011) 941-976.
[3] D.W. Qin, A. Mesbah, C. Gausse, S. Szenknect, N. Dacheux, N. Clavier, Incorporation of thorium in the rhabdophane structure: Synthesis and characterization of Pr
1-2xCaxThxPO4·nH2O solid solutions, J Nucl Mater, 492 (2017) 88-96.
[4] Y.X. Ni, J.M. Hughes, A.N. Mariano, Crystal-Chemistry of the Monazite and Xenotime Structures, American Mineralogist, 80 (1995) 21-26.
[5] H.J. Forster, The chemical composition of REE-Y-Th-U-rich accessory minerals in peraluminous granites of the Erzgebirge-Fichtelgebirge region, Germany. Part II: Xenotime, American Mineralogist, 83 (1998) 1302-1315.
[6] A. Mesbah, N. Clavier, E. Elkaim, C. Gausse, I. Ben Kacem, S. Szenknect, N. Dacheux, Monoclinic Form of the Rhabdophane Compounds: REEPO4.0.667H2O, Cryst Growth Des,
14 (2014) 5090-5098.
[7] C. Gausse, S. Szenknect, D.W. Qin, A. Mesbah, N. Clavier, S. Neumeier, D. Bosbach, N. Dacheux, Determination of the Solubility of Rhabdophanes LnPO4.0.667H2O (Ln = La to
Dy), Europ J Inorg Chem, (2016) 4615-4630.
[8] A. Berger, E. Gnos, E. Janots, A. Fernandez, J. Giese, Formation and composition of rhabdophane, bastnasite and hydrated thorium minerals during alteration: Implications for geochronology and low-temperature processes, Chemical Geology, 254 (2008) 238-248. [9] B.P. Onac, K. Ettinger, J. Kearns, I.I. Balasz, A modern, guano-related occurrence of foggite, CaAl(PO4)(OH)2·H2O and churchite-(Y), YPO4·2H2O in Cioclovina Cave, Romania,
Mineralogy and Petrology, 85 (2005) 291-302.
[10] G.F. Claringbull, M.H. Hey, A Re-Examination of Churchite, Mineral Mag, 223 (1953) 211-217.
[11] K.N. Shinde, S.J. Dhoble, Europium-Activated Orthophosphate Phosphors For Energy-Efficient Solid-State Lighting: A Review, Critical Reviews in Solid State and Materials Sciences, 39 (2014) 459-479.
[12] T.M. Harrison, E.J. Catlos, J.M. Montel, U-Th-Pb dating of phosphate minerals, Phosphates: Geochemical, Geobiological, and Materials Importance, 48 (2002) 523-558.
[13] O.H.M. Sudre, David B.; Morgan, Peter E. D., Monazite-based thermal barrier coatings United States Patent, (2005).
[14] N. Dacheux, N. Clavier, R. Podor, Monazite as a promising long-term radioactive waste matrix: Benefits of high-structural flexibility and chemical durability, American Mineralogist, 98 (2013) 833-847.
[15] H. Schlenz, J. Heuser, A. Neumann, S. Schmitz, D. Bosbach, Monazite as a suitable actinide waste form, Z Kristallogr, 228 (2013) 113-123.
[16] M. Burghartz, H. Matzke, C. Leger, G. Vambenepe, M. Rome, Inert matrices for the transmutation of actinides: fabrication, thermal properties and radiation stability of ceramic materials, Journal of Alloys and Compounds, 271 (1998) 544-548.
[17] D.E. Hobart, G.M. Begun, R.G. Haire, H.E. Hellwege, Raman-Spectra of the
Transplutonium Ortho-Phosphates and Trimetaphosphates, J Raman Spectrosc, 14 (1983) 59-62.
[18] R.L. Frost, A. Lopez, R. Scholz, Y.F. Xi, M.C. Filho, A vibrational spectroscopic study of the phosphate mineral churchite (REE)(PO4)·2H2O, Spectrochim Acta A, 127 (2014)
429-433.
[19] E.N. Silva, A.P. Ayala, I. Guedes, C.W.A. Paschoal, R.L. Moreira, C.K. Loong, L.A. Boatner, Vibrational spectra of monazite-type rare-earth orthophosphates, Opt Mater, 29 (2006) 224-230.
[20] G.M. Begun, G.W. Beall, L.A. Boatner, W.J. Gregor, Raman-Spectra of the Rare-Earth Ortho-Phosphates, J Raman Spectrosc, 11 (1981) 273-278.
[21] J. Heuser, A.A. Bukaemskiy, S. Neumeier, A. Neumann, D. Bosbach, Raman and infrared spectroscopy of monazite-type ceramics used for nuclear waste conditioning, Prog Nucl Energ, 72 (2014) 149-155.
[22] R. Podor, Raman spectra of the actinide-bearing monazites, Eur J Mineral, 7 (1995) 1353-1360.
[23] E.N. Yurchenko, E.B. Burgina, V.I. Bugakov, E.N. Muravev, V.P. Orlovskii, T.V. Belyaevskaya, Infrared and Raman-Spectra of Anhydrous Ortho-Phosphates from Tb to Lu, Inorganic Materials, 14 (1978) 1586-1588.
[24] M. Giarola, A. Sanson, A. Rahman, G. Mariotto, M. Bettinelli, A. Speghini, E.
Cazzanelli, Vibrational dynamics of YPO4 and ScPO4 single crystals: An integrated study by
polarized Raman spectroscopy and first-principles calculations, Phys Rev B, 83 (2011). [25] A. Tatsi, E. Stavrou, Y.C. Boulmetis, A.G. Kontos, Y.S. Raptis, C. Raptis, Raman study of tetragonal TbPO4 and observation of a first-order phase transition at high pressure, J
Phys-Condens Mat, 20 (2008).
[26] H. Assaoudi, A. Ennaciri, Vibrational spectra and structure of rare earth orthophosphates, weinschenkite type, Spectrochim Acta A, 53 (1997) 895-902.
[27] H. Assaaoudi, A. Ennaciri, A. Rulmont, Vibrational spectra of hydrated rare earth orthophosphates, Vibrational Spectroscopy, 25 (2001) 81-90.
[28] L.X. Yu, D.C. Li, M.X. Yue, J. Yao, S.Z. Lu, Dependence of morphology and
photoluminescent properties of GdPO4 : Eu3+ nanostructures on synthesis condition, Chemical
Physics, 326 (2006) 478-482.
[29] O. Terra, N. Clavier, N. Dacheux, R. Podor, Preparation and characterization of
lanthanum-gadolinium monazites as ceramics for radioactive waste storage, New Journal of Chemistry, 27 (2003) 957-967.
[30] H. Assaaoudi, A. Ennaciri, A. Rulmont, M. Harcharras, Gadolinium orthophosphate weinschenkite type and phase change in rare earth orthophosphates, Phase Transitions, 72 (2000) 1-13.
[31] R.G. Jonasson, E.R. Vance, Dta Study of the Rhabdophane to Monazite Transformation in Rare-Earth (La-Dy) Phosphates, Thermochim Acta, 108 (1986) 65-72.
[32] A.S. Celebi, J.W. Kolis, Hydrothermal synthesis of xenotime-type gadolinium orthophosphate, J Am Ceram Soc, 85 (2002) 253-254.
[33] A. Hezel, S.D. Ross, X-Ray Powder Data and Cell Dimensions of Some Rare Earth Orthophosphates, J Inorg Nucl Chem, 29 (1967) 2085-&.
[34] L.S. Ivashkevich, A.S. Lyakhov, A.F. Selevich, Preparation and structure of the yttrium phosphate dihydrate YPO4·2H2O Phosphor. Res. Bull., 28 (2013) 45-50.
[35] D. Errandonea, O. Gomis, P. Rodriguez-Hernandez, A. Munoz, J. Ruiz-Fuertes, M. Gupta, S.N. Achary, A. Hirsch, F.J. Manjon, L. Peters, G. Roth, A.K. Tyagi, M. Bettinelli, High-pressure structural and vibrational properties of monazite-type BiPO4, LaPO4, CePO4, and PrPO4, J Phys-Condens Mat, 30 (2018).
[36] R. Kijkowska, E. Cholewka, B. Duszak, X-Ray diffraction and IR-absorption
characteristics of lanthanide orthophosphates obtained by crystallisation from phosphoric acid solution, J Mater Sci, 38 (2003) 223-228.
[37] M. Kohlmann, H. Sowa, K. Reithmayer, H. Schulz, R.R. Kruger, W. Abriel, Structure of a Y1-x(Gd,Dy,Er)xPO4·2H2O Microcrystal Using Synchrotron-Radiation, Acta Crystallogr C,
50 (1994) 1651-1652.
[38] A. Putnis, B. Winkler, L. Fernandezdiaz, In situ IR Spectroscopic and
Thermogravimetric Study of the Dehydration of Gypsum, Mineral Mag, 54 (1990) 123-128. [39] E. Libowitzky, Correlation of O-H stretching frequencies and O-H···O hydrogen bond lengths in minerals, Monatsh Chem, 130 (1999) 1047-1059.
[40] R.L. Frost, J. Sejkora, E.C. Keeffe, J. Plasil, J. Cejka, S. Bahfenne, Raman spectroscopic study of the phosphate mineral churchite-(Y) YPO4·2H2O, J Raman Spectrosc, 41 (2010)
202-206.
[41] P.K. Mandal, T.K. Mandal, Anion water in gypsum (CaSO4·2H2O) and hemihydrate
[42] A. Mesbah, N. Clavier, E. Elkaim, S. Szenknect, N. Dacheux, In pursuit of the rhabdophane crystal structure: from the hydrated monoclinic LnPO4·0.667H2O to the
hexagonal LnPO4 (Ln = Nd, Sm, Gd, Eu and Dy), J Solid State Chem, 249 (2017) 221-227.
[43] S. Fritz, H. Schmidt, I. Paschke, O.V. Magdysyuk, R.E. Dinnebier, D. Freyer, W. Voigt, CaSeO4.0.625H2O - water channel occupation in a bassanite related structure, Acta
![Figure 2. View of the structure of : a) GdPO 4 .0.667 rhabdophane (along the [101] direction; b) GdPO 4 monazite ([100] direction); c) GdPO 4 ·2H 2 O churchite ([001] direction); d) GdPO 4 xenotime ([001] direction)](https://thumb-eu.123doks.com/thumbv2/123doknet/13225744.394302/8.892.110.754.522.970/structure-rhabdophane-direction-monazite-direction-churchite-direction-direction.webp)