Publisher’s version / Version de l'éditeur:
Journal of Thermal Spray Technology, 13, 3, pp. 405-414, 2004-09-01
READ THESE TERMS AND CONDITIONS CAREFULLY BEFORE USING THIS WEBSITE. https://nrc-publications.canada.ca/eng/copyright
Vous avez des questions? Nous pouvons vous aider. Pour communiquer directement avec un auteur, consultez la première page de la revue dans laquelle son article a été publié afin de trouver ses coordonnées. Si vous n’arrivez pas à les repérer, communiquez avec nous à PublicationsArchive-ArchivesPublications@nrc-cnrc.gc.ca.
Questions? Contact the NRC Publications Archive team at
PublicationsArchive-ArchivesPublications@nrc-cnrc.gc.ca. If you wish to email the authors directly, please see the first page of the publication for their contact information.
NRC Publications Archive
Archives des publications du CNRC
This publication could be one of several versions: author’s original, accepted manuscript or the publisher’s version. / La version de cette publication peut être l’une des suivantes : la version prépublication de l’auteur, la version acceptée du manuscrit ou la version de l’éditeur.
For the publisher’s version, please access the DOI link below./ Pour consulter la version de l’éditeur, utilisez le lien DOI ci-dessous.
https://doi.org/10.1361/10599630419328
Access and use of this website and the material on it are subject to the Terms and Conditions set forth at
Bending behavior of HVOF produced WC-17Co coating: Investigated by
acoustic emission
Bouaricha, S.; Legoux, J.-G.; Marcoux, P.
https://publications-cnrc.canada.ca/fra/droits
L’accès à ce site Web et l’utilisation de son contenu sont assujettis aux conditions présentées dans le site LISEZ CES CONDITIONS ATTENTIVEMENT AVANT D’UTILISER CE SITE WEB.
NRC Publications Record / Notice d'Archives des publications de CNRC:
https://nrc-publications.canada.ca/eng/view/object/?id=1a1f836c-8fa0-4b19-80f4-57a828384e4e https://publications-cnrc.canada.ca/fra/voir/objet/?id=1a1f836c-8fa0-4b19-80f4-57a828384e4eBending Behavior of HVOF
Produced WC-17Co Coating:
Investigated by Acoustic Emission
S. Bouaricha, J-G. Legoux, and P. Marcoux
(Submitted March 12, 2003; in revised form May 29, 2003)
A four-point bend test using acoustic emission (AE) was used to compare coating properties under mechani-cal solicitation, mainly the toughness and spalling behavior. Coatings are made from the same material; Sulzer-Metco (Westbury, NY) 2005NS (WC-17Co) sprayed with an HVOF gun with different spray param-eters. Coatings deposited on thin rectangular substrates were first bent in tension then in compression. AE features like the event number, energy per event, and cumulative energy were used to assess the damages in the coatings. The results are analyzed in relation to the coating microstructure.
Keywords acoustic emission, cermet coatings, four-point bend-ing test, HVOF, thermal spray, WC-Co
1. Introduction
WC-Co-Cr and WC-Co coatings are largely used for wear resistance applications. Their behavior under tests like erosion, abrasion, and corrosion has been studied in numerous publica-tions. However, unlike thermal barrier coatings (TBCs),[1-6]
there are few studies dedicated to the evaluation of WC-based materials under mechanical solicitations such as the bend test coupled with acoustic emission.[7-9]
This test could be a mean of predicting deleterious failure phenomenon like coating spalling or delamination from the sub-strate. It allows establishing a better understanding of the rela-tionship among processing, microstructure, and coating proper-ties.
The test consists of a four-point bending test, which allows the online monitoring of the damage development of the coat-ings. Indeed, it is performed by simultaneously applying a cer-tain strain rate, while measuring and analyzing the characteris-tics of acoustic emissions. The formation of a crack during loading releases energy in the form of an acoustic wave, which propagates through the sample and may be detected using a pi-ezoelectric sensor attached to the sample. Generally, cracks are known to either nucleate from defects, which are located within and between adjacent splats or are already present in the coatings prior to the bending test.
In four-point bend evaluation, the acoustic emissions (AEs) are known as burst type events. Analyzing their features allows a comparison among different samples that exhibit specific me-chanical behaviors due to their different microstructures.
In this study, an attempt will be made to correlate the coating
damage after bending and the characteristics of the acoustic emissions recorded during the mechanical solicitation.
2. Experimental Details and Set-Up
2.1 In-Flight Particles and Coatings Characterization
The diagnostic system DPV-2000 (Tecnar Automation, St.-Bruno, Que´bec, Canada) was used to measure the in-flight tem-perature, velocity and mean particle size during spraying.
Microhardness (HV0.3) was averaged from ten random
in-dentations on the cross section of the coatings, with a load of 300 g and duration of 20 s.
The initial powder and coatings were examined using a Hi-tachi S-4700 (Rexdale, Ontario, Canada) scanning electron mi-croscope (SEM). The polished longitudinal side planes between inner spans of the four-point bend test were observed. Before SEM observations, all deformed coatings were entirely vacuum impregnated in epoxy resin to stabilize cracks generated by the bend test and cut in two places at the positions where the inner spans of the four-point bend test were placed. The coatings were vacuum impregnated in epoxy resin a second time before finally been polished. These steps insure to avoid creating new cracks during cutting and polishing procedures.
X-ray diffraction (XRD) measurements were carried out us-ing a Bruker-AXS (Madison, WI) diffractometer with Cu K␣
radiation to determine the phases present in the coatings. Residual stresses were evaluated from the curvatures of an Almen strip type N.
2.2 Thermal Spraying
The starting feedstock material is the D-2005NS spray-dried and sintered powder from Sulzer-Metco (Westbury, NY), made of 83WC and 17Co in weight percentage as assessed by the manufacturer.
Coatings made from this powder were sprayed using the Dia-mond Jet HVOF gun (Sulzer Metco), with hydrogen as fuel and
S. Bouaricha, J-G. Legoux, and P. Marcoux, National Research Council Canada, 75 de Mortagne, Boucherville J4B 6Y4, Que´bec, Canada. Contact e-mail: Salim.Bouaricha@imi.cnrc-nrc.gc.ca. JTTEE5 13:405-41 DOI: 10.1361/10599630419328 1059-9630/$19.00 © ASM International
Peer
Reviewed
4different sets of spray parameters. They were deposited onto grit-blasted mild steel substrates. Substrates have rectangular shape (Almen strip type N) with a size of 79.2 mm in length, 19.2 mm in width and approximately 1 mm in thickness.
Spray parameter sets are listed in Table 1. They were defined to produce different coatings for further evaluation. An L-8 or-thogonal array was used to produce coatings with eight sets of spray conditions. The spray parameters and their effects were analyzed using standard procedures for a Taguchi type matrix, based on design of experiments (DOE) to find quantitative rela-tionships, as those described in a previous paper.[10]The
follow-ing parameters were chosen as independent variables: H2/O2
ra-tio, total gas flow, spraying stand-off distance, carrier gas flow, substrate temperature, and thickness per pass. Each parameter varied between two levels.
A total of four samples were produced for each spray param-eter set. A special cylindrical shape sample-holder was designed to contain the four samples. During thermal spraying, the cylin-der rotated around its longitudinal axis, insuring that all the samples would be produced with similar thickness and substrate temperature. The temperature of the substrate was monitored us-ing a pyrometer. An air jet directed onto the surface of the samples was used for cooling to maintain the average tempera-ture of the substrates at the desired value.
2.3 Four-Point Bending Test
The four-point bending test set up was designed in our labo-ratory. The lengths of the inner and outer spans were 20 and 50 mm, respectively. The motion of stress points is driven by a step-ping motor power driver (from Klinger Scientific Corp., Garden City, NY), which allows a continuous crosshead displacement rate as low as 50 µm/s.
2.4 Acoustic Emission
The AE signals were detected by a piezoelectric sensor hav-ing a diameter of 6 mm (Panametrics, Montreal, Que´bec) and a frequency response up to 1.5 MHz. The sensor signal was cap-tured by an acquisition board card NI 5112 from National Instru-ment (Austin, TX). Data acquisition was processed using a di-agnostic apparatus developed in our laboratory and the post-test analysis was performed using a program built from LabView software (National Instrument).
Typically, an input AE signal that crosses a preset threshold level acts as a trigger signal. During testing, the acquired signals
were preamplified and stored on the computer for subsequent data processing. Adequate filtering and threshold settings elimi-nated noises, created by the testing machine at known frequency and the specimen grips, which is a continuous type signal. Ul-trasonic grease was used as a couplant between the sensor and the coupon. The capture rate was set so that the time length saved for each digitized waveform was 2 ms, including a 0.2 ms pre-trigger before the waveform, to delineate the beginning of the waveform. The measurements of AE signals were representative after testing two to four samples.
3. Results and Discussion
3.1 Bending Test
Only tensile bending tests were performed on all coatings. However, compressive bending tests were also performed on the coatings but did not give reliable AE signatures. Indeed, for all coatings bent in compression, the few recorded AE events were of weak AE energy and a close look to their signal shapes shows that they are likely formed from Almen sliding in between the four point of the bend test rather than real AE generated by cracks.
The 20 mm central region of the sample was in pure bending (constant bending moment and no shear forces). Thus, the bend test was run until a maximum deflection of 5 mm was achieved and a crosshead speed of 50 µm/s. This maximum deflection corresponds by calculation (Appendix 1) to about 0.91% strain for 1 mm thick sample in the tensile surface of the substrate. The value of 5 mm in deflection was chosen in such way that after loading the substrate alone (Almen strip without coating), no permanent bending remains on it.
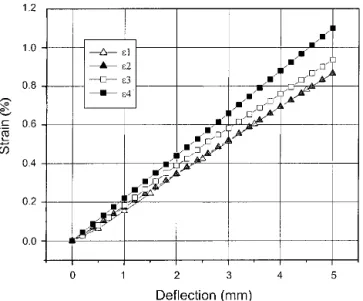
Figure 1 shows strain as a function of the deflection for the four-point bend test; 1 and 2 represent the strains for the me-tallic substrate without coating, whereas 3 and 4 are the strains for the substrate with coating #6, which was randomly chosen. Strains 1 and 3 were measured from strain gauge while apply-ing deflection durapply-ing the four-point bend test, while strains 2 and 4 were derived from the formula that takes into account the applied deflection, the thickness of the tested sample, and the distances (inner and outer spans) between loading and support bars of the four-point bend test. In the case where only the me-tallic substrate was deformed, it demonstrates that values of strain from the formula exhibit a good fitting with those mea-sured by the strain gauge. On the other hand, the strain for the coating-substrate sample is slightly different but stays within a
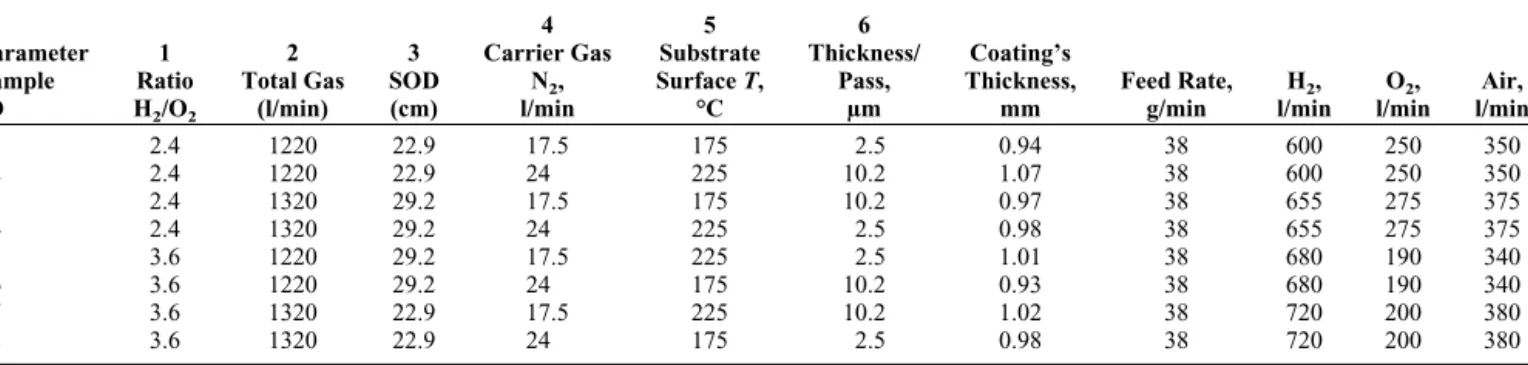
Table 1 Sets of Spray Parameters Used for the Diamond Jet HVOF Gun to Produce Samples #1 to #8
Parameter Sample ID 1 Ratio H2/O2 2 Total Gas (l/min) 3 SOD (cm) 4 Carrier Gas N2, l/min 5 Substrate Surface T, °C 6 Thickness/ Pass, µm Coating’s Thickness, mm Feed Rate, g/min H2, l/min O2, l/min Air, l/min #1 2.4 1220 22.9 17.5 175 2.5 0.94 38 600 250 350 #2 2.4 1220 22.9 24 225 10.2 1.07 38 600 250 350 #3 2.4 1320 29.2 17.5 175 10.2 0.97 38 655 275 375 #4 2.4 1320 29.2 24 225 2.5 0.98 38 655 275 375 #5 3.6 1220 29.2 17.5 225 2.5 1.01 38 680 190 340 #6 3.6 1220 29.2 24 175 10.2 0.93 38 680 190 340 #7 3.6 1320 22.9 17.5 225 10.2 1.02 38 720 200 380 #8 3.6 1320 22.9 24 175 2.5 0.98 38 720 200 380
Peer
Reviewed
range of 10% of error. Indeed, the difference between calculated (4) and measured (3) strains has proportionally increased with the applied deflection. A few explanations can be provided to substantiate this imperfect fitting. First, the deflection equation is most probably limited to the cases where the thickness of the coating is much smaller than the thickness of the substrate. The experiments presented here attempted to respect that limit by using coating thickness below 10% of the substrate’s thickness. Second, mostly due to their different modulus of elasticity, coat-ings behave differently from their monolithic substrate. Finally, as will be shown later on, the apparition of cracks in the coating, which releases stress, changes the cross section and the stiffness of the coating/substrate system, which has a direct impact on the deflection of the sample.
3.2 Effect of Parameters on Particles Temperature and Velocity
The average particle temperature and velocity profiles were calculated from the four profiles obtained with a parameter set at one level and were compared with the average profile for the same parameter set at its second level, as explained in Sec. 2.2. From Fig. 2, the effects of H2/O2ratio, total gas and carrier
gas parameters on in-flight temperature and velocity of the par-ticles can be summarized as follows:
• At all stand-off distance, the increase in the stoichiometry (H2/O2ratio) from 2.4-3.6 increases the in-flight
tempera-ture but slightly decreases the velocity.
• Increasing the total gas from 1220 to 1320 l/min., increases both temperature and velocity.
• The carrier gas has no effect on temperature and velocity when varied from 17.5 to 24 l/min.
Table 2 shows the in-flight particles temperature and veloc-ity, of particles for coatings #1 to #8 at stand-off distances, as defined earlier in Table 1. It also indicates the microhardness and the residual stresses obtained from curvature of Almen strips. Due to the different coating thicknesses, curvatures were normalized to an Almen thickness value of 1 mm.
Table 2 In-Flight Particles Temperature and Velocity;
Coatings Microhardness and Compressive Residual Stresses (Stress is Normalized for Similar Thickness) Sample ID V, m/s T, °C Hv(St. Dev.), kgf/mm2 Almen, mm(a) #1 538 1746 1082.7 (80.6) 0.0111 #2 568 1804 1200.3 (109.1) 0.0421 #3 566 1754 1120.2 (72.3) 0.0099 #4 571 1794 1091.3 (73.9) 0.0112 #5 498 1795 1111.2 (70.3) 0.0077 #6 505 1775 1057.2 (68.3) 0.0055 #7 599 1923 1202.4 (91.2) 0.0128 #8 600 1943 1121.1 (97.2) 0.0096
(a) From curvature of the Almen strip in compression Fig. 1 Strain as a function of the deflection with the four-point bend
test, 1 and 2 for substrate without coating, and 3 and 4 with coating (#6, randomly chosen); 1 strain for substrate (Almen-type N) measured from strain gauge, 2 strain for substrate (Almen-type N) calculated with the measured deflection, 3 strain for coating on substrate (Almen-type N) measured from strain gauge, 4 strain for coating on substrate (Almen-type N) calculated with the measured deflection
Fig. 2 Effect of spraying parameters on in-flight particles temperature and velocity (square marks for temperature and circle marks for veloc-ity, open and full marks for lowest and highest levels, respectively, of the studied parameter as presented in Table 1
Peer
3.3 Microstructure Characterization
First of all, it is important to mention that all produced coat-ings presented a very low porosity, typically less than 1%, as determined by image analysis. Figure 3 shows SEM microstruc-tures for coatings #1 to #8 after the four-point bend test. The
density and morphology of the cracks qualitatively represent the major damages in the observed area.
None of the studied coatings spalled out or delaminated from their substrates. All coatings exhibited clearly defined transver-sal cracks. The cracks apparently propagated from the surface, normal to the load axis, to the coating-substrate interface
with-Fig. 3 Cracks images for deformed coatings #1 to #8 obtained by SEM; d is the average distance separating the transversal cracks
Peer
out branches, and then propagated parallel along the interface. Surface defects and defects within the coating lead to stress con-centrations and are believed to constitute the cracking origins and paths, respectively. Also, it can be noted in all coatings that cracks were observed to be regularly spaced with distances vary-ing from 0.4 to 1.1 mm (not shown here). The average distance
d separating two cracks is reported in Fig. 3. Cracks formed in
the coatings at regular intervals are consistent with the four-point bend test since the cracks will relieve the stress in a uni-form manner. Depending on spray conditions, similar observa-tions were already mentioned in numerous publicaobserva-tions.[6,9,11]
The averaged width (opening) of transversal and interfacial cracks was determined qualitatively from image analysis of four cracks. It also was found to vary with coatings. Indeed, coating
#5 (∼1.5-2.0 µm) has the largest cracks, followed by #6 (∼0.8-1.0 µm), while coatings #1 (∼0.5-0.7 µm) and #7 (∼ 0.3-0.5 µm) exhibit the smallest crack opening.
The XRD patterns for coatings #1 to #8 were examined. They revealed that all coatings consist of WC as the major phase, with W2C and W in small amounts resulting from the WC
decarbur-ization. No clear peak related to the Co phase was found. On the other hand, all patterns show a broad diffraction halo at a range of 2 ∼ (37°, 47°). This indicates the presence of a quantity of an amorphous or nanocrystalline phase in each coating, probably composed of W, Co and C. Figure 4 shows an example of the XRD patterns for coatings #2 and #3.
For all coatings, peaks related to W2C and W phases are very
small, which makes for instance, their quantification difficult by the Rietveld method. However, it is possible by using other means, to compare the amorphous fraction present in coatings.
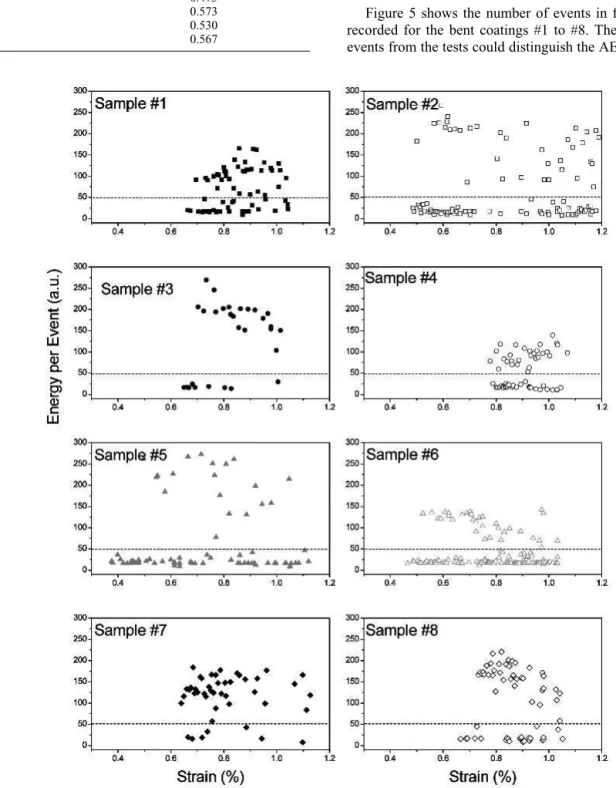
Fig. 4 X-ray diffraction patterns of coatings #2 and #3 Fig. 5 AE event number versus strain
Fig. 6 Residual stresses obtained from Almen curvature versus (a) AE event number and (b) onset of cracking
Peer
This is possible by using the index of crystallinity (Ic) as adopted
by Verdon et al.[12]The I
cis defined as the ratio between the
areas of the Bragg peaks (crystalline material) and the total areas of the spectrum for 2 between 30° and 55°. It gives relative
proportions of crystalline and amorphous materials. Since one does not have the amorphous structure factor, the values ob-tained for Icare not absolute but can be used to rank the materials
in a relative manner. Thus, the larger Icis, the more the coating
is composed of crystalline material and undergone less carbide degradation. Table 3 shows the crystallinity index for all coat-ings. For example, it can be seen that coating #2 is less degraded than coating #3 (shown in Fig. 4), which is reflected by a higher portion of crystalline WC phase and Icvalue.
3.4 Acoustic Emission Features
Figure 5 shows the number of events in function of strain recorded for the bent coatings #1 to #8. The total number of events from the tests could distinguish the AE feature of either
Table 3 Indexes of Crystallinity for Coatings #1 to #8
Sample ID Ic #1 0.597 #2 0.613 #3 0.445 #4 0.489 #5 0.475 #6 0.573 #7 0.530 #8 0.567
Fig. 7 AE energy of events versus strain
Peer
catastrophic failure or microcracking. As mentioned earlier, no catastrophic failure was observed in any of the coatings. Conse-quently, it is assumed that microcracking was the main damage mechanism in the coating microstructure during bending. Con-tinuous monitoring of AE events during the bend test could be a reliable indicator for determining the damage mechanism in the coatings.
The first AE event corresponds to the onset of cracking. Coatings #5, #6, and #2 had the earliest crack initiation occur-rence. This means that these coatings require less strain to initi-ate cracking. They also exhibit, over all the bending tests, a much larger number of events than the other coatings. Figure 6(a) shows the event number plotted in function of the residual stresses in the coating. The residual stress was determined from the curvature of Almen and was found to be compressive in all coatings. Of the eight points plotted, six fall almost on a straight line, which suggests a relationship between them. It was ob-served earlier that the coatings for which cracking were initiated first presented the highest number of event. On this basis and regarding the linearity between event number and residual stresses, one could attempt to link, by a transitive way through the event number, the onset of cracking and residual stresses. Figure 6(b) shows the onset of cracking versus residual stresses. Unfortunately, it does not show a clear relationship between them, implying that other factors may play roles. Nevertheless, it suggests that delaying the initiation of cracking could be achieved by spraying coatings that present higher compressive residual stress values. However, caution must be made on this point and more work has to be done to verify this hypothesis.
Each coating exhibited AE events of different characteristics. The distinction between them, being a weak or strong event, is expressed by the released AE energy.[1]Figure 7 reports the
en-ergy of each event as a function of strain, recorded for coatings #1 to #8. The energy of an event is defined from the signal en-velope, which implies a time integration of the signal voltage output of the sensor over its duration. It can be seen that all coat-ings could be visibly separated in two energy distributions as delimited by dotted lines, lower and higher than 50 a.u. (arbi-trary unit), a value chosen arbi(arbi-trary. This distribution threshold’s value could also be taken within the range of 40-60 a.u. Dalmas et al.[9]have also observed, for coatings made from WC-Co, two
different types of acoustic events in term of energy. On the basis of microscopic observations, they attributed low absolute en-ergy to transversal macrocracks and high enen-ergy to delamina-tion. In our study, we do not have any proof that contradicts such attributions. On the contrary, these distributions illustrate clearly that weak and strong events alternate during all the range of ap-plied strain, which corroborates the energy attribution made by Dalmas. One can also add that strong events are not generated only when approaching final failure, as showed by Lin et al.[1,13]
for plasma sprayed TBCs. This confirms the damage mechanism by microcracking.
Although a coating can develop a large number of very small cracks, they could be not dangerous to its integrity. On the other hand, it can develop a few large cracks that could be deleterious for the coating structure. Therefore, the analysis of the extent of damage is better described with the AE cumulative energy. Fig-ure 8 is a graph showing the AE cumulative energy versus strain for the deformed coatings. The cumulative energy is defined as the sum of energy of all events. This time, coatings #2, #8, #6,
and #7 present higher cumulative energy values than the rest of the coatings. They also present higher cumulative energy for strong events (as shown in Table 4). It seems clear that the total cumulative energy is driven by the cumulative energy of strong events, rather than weak events.
3.5 Correlations Between Microstructure and AE Features
Since none of the eight coatings spalled from the substrate, the differentiation between coatings will be made in terms of acoustic emission features, confirmed by damage extent from microstructures. Nevertheless, damage sustained by a coating has to be defined since it is application dependent. In coating applications for wear resistance purposes like corrosion or seal-ant, it is of primary importance to avoid the presence of cracks that could expose the substrate, otherwise coatings do not pro-vide their intended corrosion or leak-barrier protection. With its ability to detect the occurrence of microcracking, the onset of cracking detected by acoustic emission could answer this issue. Earlier, the onset of cracking was linked to residual stresses. Thus, to maximize the coating resistance to crack initiation, one has to choose thermal spray parameter set that gives coatings high compressive residual stresses.
If one would expect to estimate the remaining lifetime of a coating before spalling or delamination or to determine the amount of damage accumulation, further investigations would have to be conducted to understand different correlations.
The examination of specimen surface during interrupted tests (low applied strain, not shown here) revealed that cracks initi-ated from the surface and then propaginiti-ated towards the substrate. This is consistent with the fact that tensile stresses would be greatest near the coating surface. Also, it seems that all cracks are not formed simultaneously; rather, they are formed one after another. Indeed, it was observed in many coatings for which de-formation was interrupted that a first crack had already propa-gated toward the substrate and along the interface, followed by another crack, which had also initiated from the surface and only propagated for a portion of the coating’s thickness. This clearly
Fig. 8 AE cumulative energy versus strain
Peer
indicates both the progressive formation of the cracks and their distribution along the sample length.
Detailed examinations of the crack shape are shown in Fig. 3, in which the largest crack openings were observed for coatings #5, #6, #2, and #3, and the smallest for #7, #1, and #4. Note that the large crack openings seem to correlate with highest mean energy per event for strong events (> 50 a.u.), as reported in Table 4. This is in conformity with results published by Brown et al.,[14] who also observed that large cracks produced high-energy AE events. The crack opening is believed to become larger with increasing applied strain.[15]
In addition, crack spacing was found to correlate with the total cumulative energy. Indeed, with the exception of coating #1, Fig. 9(a) shows almost linearity between these two param-eters. Coatings exhibiting larger crack spacing present the lower total AE cumulative energy. According to Zhou et al.,[11] the
interface fracture toughness is proportional to the square root of the crack spacing, which is in our case the mean distance d sepa-rating two successive cracks. Thus, it is possible to establish a ranking among coatings regarding their interface fracture tough-ness, and on this basis, coatings #3, #4 and #5 are the toughest among the eight deformed coatings. They have, respectively, 0.99, 0.90, and 0.83 mm as separating distance d. Those coatings also present lower AE cumulative energy values (Table 4). Thus, associating this AE feature to coating with higher interface frac-ture toughness can also be done.
In another approach, as it was pointed out earlier, the WC phase, that constitutes the major phase of all coatings, has un-dergone a decarburization during the thermal spray process. De-pendent on the thermal spray parameter set used, the carbide’s degradation generated different amounts of amorphous phase. Figure 9(b) reports the total cumulative energy versus the index of crystallinity and illustrates dependence between the amount
of amorphous material and the cumulative energy. The amor-phous compound is suspected to be much softer than crystalline phases WC, W, and W2C. Subsequently, coatings that have the
largest amount of amorphous material are the toughest ones. Moreover, Fig. 9(c) illustrates, in a transitive manner, the linear relationship between crack spacing and phase degradation from the ICvalue.
In this study, no clear correlation between microhardness and AE features was found. However, it can be said, as already re-ported by Cox,[7] “for applications where the toughness of a
coating is of primary importance, hardness is probably not a re-liable measure, but it is still valid as a quality control tool.”
3.6 Choice of Thermal Spray Parameter Set Based on AE Features
From the above analysis, it seems that toughness is the key-characteristic to preserve coatings from failure by spalling or delamination. By going back to thermal spray parameter sets, we will determine which parameters influence the coatings tough-ness. Table 5 shows the effect of the chosen parameters on the AE features, as listed from the L-8 matrix conditions in Table 1. It can be summarized as follows:
• The spray distance influences the total cumulative energy and their event number, the AE cumulative energy of strong events, the index of crystallinity, the distance between cracks and the residual stresses.
• The total gas has an influence on the onset of cracking, the mean energy per event, as well as the index of crystallinity. • Surprisingly, the substrate temperature has no major effect. Thus, mainly two parameters, the total gas and spray distance are affecting the AE features and the microstructure. The choice
Table 5 Effect of Spraying Parameters on AE Features
Property Ratio H2/O2 Total Gas Spray Distance Carrier Gas Surface Temperature Thickness
Per Pass Interaction
Onset of cracking −0.29 −0.83 0.15 −0.06 0.35 0.34 0.51
Total cumulative energy −830 883 1542 −1038 −77 −735 −1062
Mean energy per event −1.32 −39.47 16.48 27.28 9.64 −16.22 −23.29
Cumulative energy of strong events −567 −64 1840 −502 −163 −524 −1179
Mean energy of strong event −14 3 −2 22 −10 −11 −65
Number of events −1.25 −0.25 11.75 −5.75 1.25 −0.75 5.25
Index of cristallinity: Ic −0.00025 0.0567 0.0812 −0.0487 0.0187 −0.0082 0.0222
Distances between cracks 0.09 −0.13 −0.16 0.05 −0.05 0.01 −0.1
Almen N deflection 119 −50 129 0 −94 −14 −46
Table 4 AE Features for All Bent Coatings
Sample ID Onset of Cracking, Event Number Mean Energy per Event, a.u.(a) Cumulative Energy, a.u.(a) Event Number, <50 a.u.(a) Mean Energy per Event, <50 a.u(a) Cumulative Energy, <50 a.u.(a) Event Number, >50 a.u.(a) Mean Energy per Event, >50 a.u.(a) Cumulative Energy, >50 a.u.(a) #1 0.664 67 67 4533 30 24 710 37 103 3822 #2 0.485 106 70 7446 69 18 1259 37 167 6186 #3 0.65 30 130 3905 9 19 169 21 178 3736 #4 0.778 60 53 3223 30 18 528 30 90 2695 #5 0.376 75 66 4961 55 20 1079 20 194 3881 #6 0.465 135 41 5595 101 20 2021 33 108 3573 #7 0.639 46 115 5292 7 22 155 39 132 5137 #8 0.666 63 104 6581 24 19 447 39 157 6134
(a) Abbreviation: a.u., arbitrary unit
Peer
of the favorable thermal spray parameter set will be only based on how they influence favorably toughness through low AE cu-mulative energy.
3.7 Toughness Versus Spray Distance and Total Gas
As previously established, low AE cumulative energy is the signature of coatings with high toughness. Thus, on the ranking basis between coatings of low total cumulative energy and cu-mulative energy of strong events, as presented in Table 4, spray-ing at a SOD of 29.2 cm is more suitable than at 22.9 cm. The four coating sets sprayed at 29.2 cm (#3, #4, #5, and #6; Table 1) globally presented lower cumulative energy than the four coat-ing sets sprayed at 22.9 cm (#1, #2, #7, and #8). This is in con-formity to the work of Kucuk et al.,[4]where they reported that
plasma sprayed coatings at shorter stand-off distance exhibited higher cracking activities. The stand-off distance condition im-plies that particles should have a long residence time in the flame. Moreover, among the first set of coatings, coating #3 and #4 presented the lowest AE cumulative energy. As these two coatings used the highest level of total gas (i.e., 1320 l/min), it can be stated that (toughness wise) 1320 l/min of total gas is better than 1220 l/min.
Considering the chosen stand-off distances and total gas, and looking at the average particle in-flight temperature and velocity during spraying, higher total gas produces higher temperatures and velocities independent of both stand-off distances (Fig. 2). Microstructures showed that at higher total gas, coatings under-went more carbide degradation. This could be interpreted by the fact that the increase in velocity does not sufficiently reduce the dwell time to overcome the effect of the temperature.
4. Conclusions
For all coatings, no delamination or spalling has occurred. Instead, a network of regularly spaced parallel cracks was ob-served on the surface of the coating and propagated through the coating toward the substrate and along the interface. Also, no catastrophic failure occurred, instead, microcracking was found to be the leading mechanism.
This study showed the ability of AE to differentiate among coatings sprayed under different thermal spray conditions. De-tailed investigations showed that coatings with higher compres-sive residual stresses seem to have a higher resistance to crack initiation. This point has to be confirmed by adequately measur-ing the residual stresses with more reliable methods than the cur-vature of the Almen strip, like the x-ray analysis or the removal layer method.
From the damage extent observed and measured from the mi-crostructure, the AE event number and total cumulative energy are parameters describing with enough reliability the coating’s cracking activity. In particular, the distance separating cracks seems to apparently indicate the level of toughness in coatings. Also, it seems that the presence of more amorphous fraction in a coating plays a role in enhancing the toughness.
Acknowledgments
Thanks to Jan Wigren from Volvo for exchanging informa-tion regarding the bend test. Thanks to B. Harvey for software
Fig. 9 (a) Relationship between AE cumulative energy and average distance, (b) relationship between cracks, (c) and index of crystallinity.
Peer
programming, to F. Belval for HVOF spraying, to M. Lamon-tagne for DPV-2000 measurements, to E´ ric Poirier for metallog-raphy and M. Thibodeau for SEM images. The authors would like to acknowledge the participants in HCAT and C-HCAT pro-grams for the fruitful interactions that led to the development of this work.
Appendix 1
At the center the deflection is maximal[16]and is given by: ⌬c= W a 24E I共3l 2 − 4a2兲 (Eq 1)
On the other hand, strain is defined as:
=
E (Eq 2)
At each load, the stress in the extreme fiber of the sample is given by: = W a Z (Eq 3) where, Z = I 共TⲐ2兲= 2I T (Eq 4)
with Z the section modulus of the cross-section of the sample and
I the moment of inertia of the cross-section of the sample. By
substituting Eq 4 and Eq 3: = WaT 2I (Eq 5) and Eq 5 in Eq 2: = WaT 2I 1 E (Eq 6) By combining Eq 6 and 5, E = WaT 2I (Eq 7)
Finally, by substitution of Eq 7 into Eq 1: ⌬c= Wa 24I共3l 2 − 4a2兲 2I WaT= 12T共3l 2 − 4a2兲 → = 12T ⌬ c 共2l2 − 4a2兲
which gives strain in the extreme fiber of the sample as a func-tion of the deflecfunc-tion at the center, thickness of the sample, and distances between the loading and supporting bars of the four-point bend test.
References
1. C.-K. Lin, C.C. Berndt, S.-H. Leigh, and K. Murakami: “Acoustic Emission Studies of Alumina-13% Titania Free-Standing Forms During Four-Point Tests,” J. Am. Ceram. Soc., 1997, 80(9), pp. 2382-94. 2. J. Voyer, F. Gitzhofer, and M.I. Boulos: “Study of the Performance of
TBC Under Thermal Cycling Conditions Using an Acoustic Emission Rig,” J. Therm. Spray Technol., 1998, 7(2), pp. 181-90.
3. A. Kucuk, C.C. Berndt, U. Senturk, R.S. Lima, and C.R.C. Lima: “In-fluence of Plasma Spray Parameters on Mechanical Properties of Yttria Stabilized Zirconia Coatings. I: Four Point Bend Test,” Mater. Sci. Eng., 2000, A284, pp. 29-40.
4. A. Kucuk, C.C. Berndt, U. Senturk, and R.S. Lima: “Influence of Plasma Spray Parameters on Mechanical Properties of Yttria Stabilized Zirconia Coatings. II: Acoustic Emission Response,” Mater. Sci. Eng., 2000, A284, pp. 41-50.
5. P. Robin, F. Gitzhofer, and M.I. Boulos: “Acoustic Emission Tech-niques for Life Prediction of TBCs under Thermal Cycling Conditions” in Thermal Spray 2001: New Surfaces for a New Millenium, C.C. Berndt, K.A. Khor, and E. Lugscheider, ed., ASM International, Mate-rials Park, OH, 28-30 May 2001, pp. 1247-53.
6. A. Kucuk, C.G. Dambra, and C.C. Berndt: “Influence of Plasma Spray Parameters on the Cracking Behavior of Yttria Stabilized Zirconia Coatings,” Practical Failure Analysi, 2001, 1(1), pp. 55-64.
7. L.C. Cox: “The Four-Point Bend Test as a Tool for Coating Character-ization,” Surf. Coat. Technol., 1988, 36, pp. 807-15.
8. C.S. Richard, G. Be´ranger, J. Lu, J-F. Flavenot, and T. Gre´goire: “Four-Point Bending Tests of Thermally Produced WC-Co Coatings,” Surf. Coat. Technol., 1996, 78, pp. 284-94.
9. D. Dalmas, S. Benmedakhene, C. Richard, and A. Laksimi: “Character-ization of Cracking Within WC-Co Coated Materials by an Acoustic Emission Method During Four Point Bending Tests” in Proceedings of ITSC, Montre´al, Quebec, C.C. Berndt, ed., ASM International, Materi-als Park, OH, 2000, pp.1335-40.
10. J-G. Legoux and S. Bouaricha: “Evaluation of Starting Material and Process Parameters for HVOF WC-10Co-4Cr Coatings” in Proceeding of ITSC, Essen, Germany, E. Lugscheider, ed., DVS Deutscher Verbaud fu¨r Schweissen, Germany, 2002, pp. 289-94.
11. Y.C. Zhou, T. Tonomori, A. Yoshida, L. Liu, G. Bignall, and T. Hashida: “Fracture Characteristics of Thermal Barrier Coatings After Tensile and Bending Tests,” Surf. Coat. Technol., 2002, 157, pp. 118-27. 12. C. Verdon, A. Karimi, and J.-L. Martin: “A Study of High Velocity
Oxy-Fuel Thermally Sprayed Tungsten Carbide Based Coatings. Part 1: Microstructures,” Mater. Sci. Eng., 1998, A246, pp. 11-24.
13. C-K. Lin and C.C. Berndt: “Acoustic Emission Studies on Thermal Spray Materials,” Surf. Coat. Technol., 1998, 102, pp. 1-7.
14. S.R. Brown and I.G. Turner: “Acoustic Emission Analysis of Thermal Sprayed Hydroxyapatite Coatings Examined Under Four-Point Bend Loading,” Surf. Eng., 1998, 14(4), pp. 309-13.
15. K. Akita, G. Zhang, S. Takahashi, H. Misawa, and S. Tobe: “In-Situ Observation and AE Analysis of Microscopic Fracture Process of Ther-mal Spray Coatings” in Proceeding of ITSC, Nice, France, Christian Coddet, ed., ASM International, Materials Park, OH, 1998, pp. 837-42. 16. E. Oberg, F.D. Jones, H.L. Horton, and H.H. Ryffel: “Strength of Ma-terials,” Machinery’s Handbook, R.E. Green, ed., 24th ed., Industrial Press, New York, 1992, pp. 221-22.
Fig. A1 Schematic illustration of the four-point bend test; Wais the load applied at the four points; T is the thickness of the sample (substrate plus coating);. l is the distance between the two supporting bars (outer spans) of the four-point bend test; and a is the distance between adjacent loading and support bars of the four-point bend test.