Publisher’s version / Version de l'éditeur:
Vous avez des questions? Nous pouvons vous aider. Pour communiquer directement avec un auteur, consultez la
première page de la revue dans laquelle son article a été publié afin de trouver ses coordonnées. Si vous n’arrivez pas à les repérer, communiquez avec nous à PublicationsArchive-ArchivesPublications@nrc-cnrc.gc.ca.
Questions? Contact the NRC Publications Archive team at
PublicationsArchive-ArchivesPublications@nrc-cnrc.gc.ca. If you wish to email the authors directly, please see the first page of the publication for their contact information.
https://publications-cnrc.canada.ca/fra/droits
L’accès à ce site Web et l’utilisation de son contenu sont assujettis aux conditions présentées dans le site LISEZ CES CONDITIONS ATTENTIVEMENT AVANT D’UTILISER CE SITE WEB.
Internal Report (National Research Council of Canada. Institute for Research in Construction), 1991-12
READ THESE TERMS AND CONDITIONS CAREFULLY BEFORE USING THIS WEBSITE.
https://nrc-publications.canada.ca/eng/copyright
NRC Publications Archive Record / Notice des Archives des publications du CNRC :
https://nrc-publications.canada.ca/eng/view/object/?id=6e2d22cf-8a5c-4de6-8a1b-5307772dc98f https://publications-cnrc.canada.ca/fra/voir/objet/?id=6e2d22cf-8a5c-4de6-8a1b-5307772dc98f
NRC Publications Archive
Archives des publications du CNRC
For the publisher’s version, please access the DOI link below./ Pour consulter la version de l’éditeur, utilisez le lien DOI ci-dessous.
https://doi.org/10.4224/20358628
Access and use of this website and the material on it are subject to the Terms and Conditions set forth at Fire resistance test of a square reinforced concrete column
- - --I I R e f
1
1 C - . .3 e r
TH1 National Research Consell national
R 4 2 7 Council Canada de recherches Canada !
6 2 ~nstitute for
i
B,k D G.9.1 iR esearch in recherche en lnstitut dei
.. - . . . j~onstruction construction
Fire Resistance Test of a Sauare Reinforced
Concrete Column
by J. Myliymaki and T.T. Lie
Internal Report No. 619
Date of issue: December 1991 N n c
-
Cl.TlL I B R A R Y
This is an internal report of the institute for Research in Construction. Although not intended for general distribution, it may be cited as a reference in other publications
FIRE RESISTANCE TEST OF A SQUARE REINFORCED CONCRETE COLUMN
by
J. Myllym&i and T. T. Lie
ABSTRACT
The results of a fire resistance test conducted at NRC on a reinforced concrete column, made by the Technical Research Centre of Finland (VTT), are described. The test was carried out as a part of a study on concrete-filled steel columns to determine the
influence of the steel encasing on the fire resistance of the column. This influence can be assessed by comparing the results with those obtained for a similar column with steel encasing. The dimensions of the tested column were 300 mm x 300 mm x 3810 mm and it
was constructed of Finish siliceous aggregate concrete.
1 . INTRODUCTION
For a number of years, the National Rcscarch Council of Canada (NRC) and the Technical Rcscarch Centre of Finland (V'lT) have independently been enrared in studies lo
predict the fire resistance of concrete filled steel columns. The mutual interest in these studies led to an agreement between NRC and V'lT to conduct joint studies on the fire resistance of concrete-filled steel columns. These studies include theoretical as well as experimental studies.
As a part of these studies, a reinforced concrete column without steel encasing was tested to obtain information on the influence of the steel encasing on the fire resistance of the column. This influence can be assessed by comparing the fire resistance of the bare reinforced concrete column with the fire resistance of similar reinforced concrete columns with steel encasing, tested earlier for V l T at the University of Braunschweig in Germany [I].
In this report, the results of a test, conducted at NRC, on the reinforced concrete column without steel encasing are described. The column was designed by the Fire Technology Laboratory and fabricated by the Building Materials Laboratory of VTT in Finland. It was tested at the National Fire Laboratory of the Institute for Research in Construction, NRC.
2 . TEST SPECIMEN
One reinforced concrete column (300 mm x 300 mm x 3810 mm) was constructed and tested under a concentric load. Details of the test specimens are given in Table 1 and illustrated in Fig. 1. Further details of the test specimen and its fabrication are given below.
2 . 1 Dimensions
The column was 3810 mm long from end plate to end plate. The cross section of the column was 300 x 300 mm. The column had 24 mm cover to the 6 mm dia. tie bars
and 20 mm cover to the 10 mm dia. tie bars. The cover to the vertical main bars was 30 mm.
2 . 2 Materials
The column end plates consisted of steel meeting the requirements of Finnish Standard SFS 200 grade Fe 52 C [2].
I
Weldable ribbed bars meeting the requirements of Standard SFS 1215 grade A 500
i
HW the column was 16 mm. The diameters of the ties were 6 and 10 mm. A tensile test was [3] were used for the main and tie bars. The diameter of the longitudinal steel bars in performed for each bar size to determine yield and ultimate strength. The test results areI Listed in Table 2.
Cement:
The concrete mix was poured in the Building Materials Laboratory of the Technical Research Centre of Finland. In the pour, a general purpose portland cement for
construction of concrete structures was used. The cement was manufactured by Oy Partek Ab.
Agrrregate:
The aggregate used was Finnish siliceous sand and gravel, both from Lohja Oy Rudus. A sieve analysis was conducted. The results of the sieve analysis are given in Table 3.
Concrete Mix:
Batch quantities for the mix are given in Table 3. The mix contained a supcr plasticizer called SP 62. The average 28-day concrete cube strength was 37.5 MPa.
2 . 3 Fabrication
The column was cast in vertical forms made of smooth plywood.
The column length was 3810 mm measured from end plate to end plate. The longitudinal 16 mm reinforcement bars were cut to 3790 mm.
The dimensions of the end plates were 508 x 610 x 40 mm. Holes with a diameter 4 mm larger than the diameter of the longitudinal reinforcing bars were drilled through the plates.
The main bars and ties were joined together to complete the steel cage. The steel cage was then placed vertically into the form on a levelled end plate in such a way that the ends of the bars were positioned in the holes.
The bottom steel end plate and the bars were then welded. Centering and perpendicularity of the end plates were given special attention. A fillet weld was made around the bars on the outer face of the bottom plate. The type of welding rod used was OK Autrod 12.51, which has a tensile strength of 400 MPa. The rough surfaces of the welds on the outer face of the plate were ground to a smooth finish.
The welding of the top steel plate was performed after the casting of the column. Before positioning the top plate, a 20 mm layer of mortar was spread over the top of the column to ensure good contact between the steel plate and concrete. The mortar, called Rapid Set Grout, was non-shrinkable high strength mortar, which had a compressive strength of 84.4 MPa at 28 days. Using the same procedure as for the bottom, plate, the top plate was welded on the outer side of the bars and smoothed.
Concrete Placement:
The concrete was mixed in a paddle mixer, called Zyklos. A concrete placement bucket and a long plastic tube were used to deposit the mix in the steel column. When necessary, an internal vibrator was carefully applied to consolidate the concrete. To avoid possible moisture leaks, the column was sealed at the top end with a plastic sheet and tape before and after the welding of the top plate.
After 20 days, the forms were stripped and the column conditioned in an atmosphere controlled at about 20°C and 30% relative humidity.
Type K chromel-alumel thermocouples, with a thickness of 0.5 mm, were used for measuring concrete and reinforcement temperatures at several locations in different cross sections of the columns. At each level, some of the thermocouples in the concrete were tied to steel rods that were f m l y secured to the main reinforcing bars. The temperatures were measured at approximately one-quarter height, mid-height and three-quarters height. At mid-heieht. the temoeratures were measured along the whole length of an axis and a diagonarof the section; at the other two levels, thgtemperatures were measured only in the middlc of the section and at the surface of the section. The steel temperaures were also measured at various locations. The locations of the thermocouple leiels in the column are shown in Fig. 2. The location of the thermocouples at various levels is shown in Fig. 3.
3 . MATERIAL PROPERTIES TESTS
3 . 1 Cube Compressive Strength
From the concrete mix, ten 150 mm cubes were made using steel forms.
Compression strength tests were conducted for three specimens at 7 and 28 days and on the test date. The tests were conducted according to Finnish Standard SFS 4474 [4]
( I S 0 4012).
3 . 2 Thermal Properties
From the concrete mix, ten 100 x 200 x 50 mm prisms were made, using wooden forms. Details concerning the thermal properties measurements are given in the Appendix. Values of the measured properties as a function of temperature are given in Figs. A1-A4 and Tables A1-A4 in the Appendix.
3 . 3 Cylinder Compressive Strength a n d Moisture Content
From the concrete mix, a short column was constructed. The size of the column was 300 x 300 x 600 mm. On the test date, two cylinders with a diameter and height of 100 mm were cut from the concrete, using a core drill. The cylinders were used for the measurement of the strength of the concrete.
4 . TEST APPARATUS
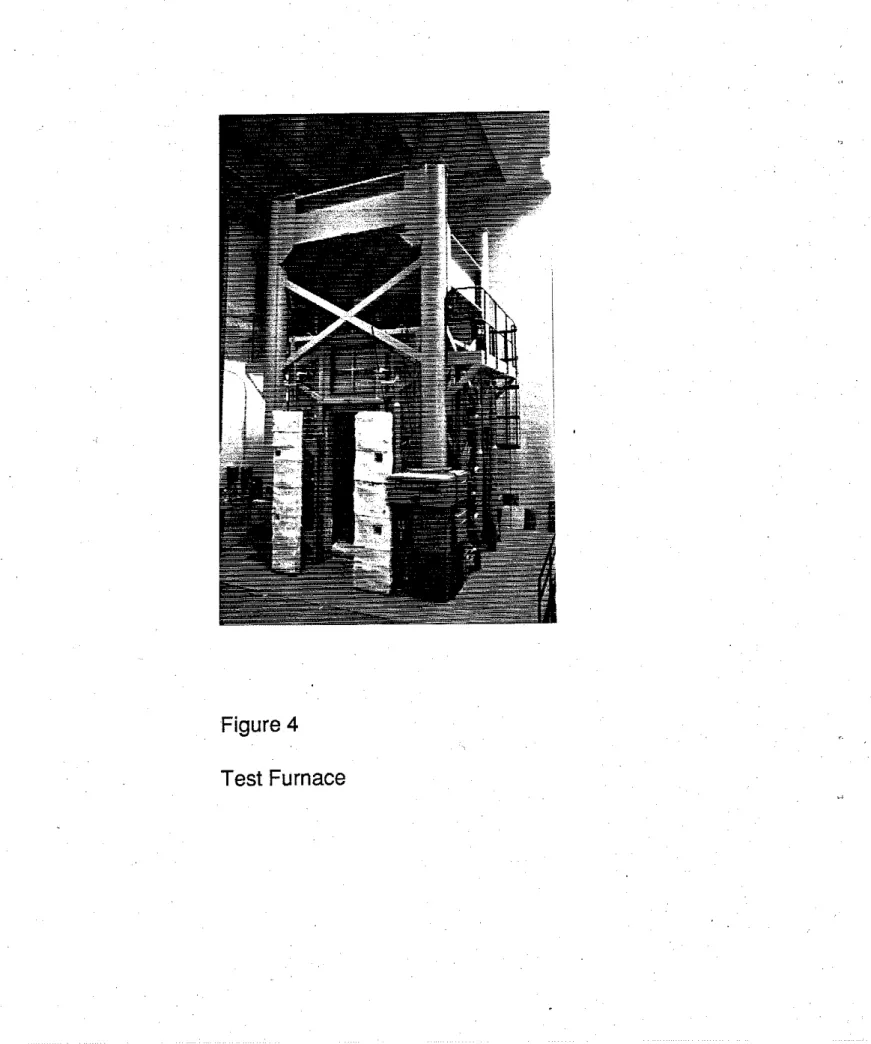
The test was carried out by exposing the column to heat in a furnace specially built for testing loaded columns and walls. The test furnace produces conditions to which a member might be exposed during a fire, i.e., temperatures, structural loads and heat
transfer. It consists of a steel framework s u ~ ~ o r t e d by four steel columns, with the furnace chamber inside the framework (Fig. 4). Thecharacte6stics and instrumentation of the furnace are described in detail in Ref. [5]. Only a brief description of the furnace and the main components is given here.
4 . 1 Loading Device
A hydraulic jack with a capacity of 9778 kN produces a load (N1) along the axis of
the test column (Fig. 5). The jack is located at the bottom of the furnace chamber.
Eccentric loads can be applied by means of hydraulic jacks (Nz), one at the top and one at the bottom of the column, located at a distance of 508 mm from the axis of the column. The capacity of the top jack is 587 kN and that of the bottom jack 489 kN.
4 . 2 Furnace Chamber
The furnace chamber has a floor area of 2642 x 2642 mm and is 3048 mm high. The interior faces of the chamber are lined with insulating materials that efficiently transfer
, heat to the specimen. There are 32 propane gas burners
m
the furnace chamber, arranged in eight columns containing four burners each. The total capacity of the burners is 4700 kW. Each burner can be adjusted individually, which allows for a high degree of temperature uniformity in the furnace chamber. The pressure in the furnace chamber is also adjustable and was set somewhat lower than atmospheric pressure.4 . 3 Instrumentation
The furnace temperatures were measured with the aid of eight chromel-alumel thermocouples. The thermocouple junctions were located 305 mm from the test specimen at various heights. Two thermocouples were placed opposite each other at intervals of 610 mm along the height of the furnace chamber. The locations of their junctions and their numbering are shown in Fig. 6. Thermocouples 4 and 6 were located at a height of 610 mm from the floor, Thermocouples 2 and 8 at 1220 mm, Thermocouples 3 and 5 at 1830 mm and Thermocouples 1 and 7 at 2440 mm. The temperatures measured by the
thermocouples were averaged automatically and the average temperature used as the criterion for controlling the furnace temperature.
The loads were controlled by servocontrollers and measured with pressure
transducers. The accuracy of controlling and measuring loads is about 4 kN at lower load levels and relatively better at higher loads.
The lateral deflection of the column at mid-height was measured using a theodolite. The axial deformation of the test column was determined by measuring the displacement of the jack that supports the column. The rotation of the end plates of the column was
determined by measuring the displacement of the plates at a distance of 7 11 mm from the centre of the hinge at the top and at a distance of 1295 mm from the centre of the hinge at the bottom. The displacements were measured using transducers with an accuracy of
rn 0.002 mm.
5 . TEST CONDITIONS AND PROCEDURE
The column was tested with both ends hinged. The column was installed in the furnace by securing the end plates to the plates of the bearings (Fig. 5). The bearings were bolted to a loading head at the top and to the plate of the main hydraulic jack at the bottom.
Before the test, the moisture condition in the centre of a column section was measured by inserting a Vaisala moisture sensor in a hole drilled in the concrete at a height of 380 mm above the bottom of the column. The readings are given in Section 6.
5 . 1 Loading
The column was subjected to a concentric load of 1400 kN. The load was applied approximately 45 minutes before the start of the test. At that stage, a condition was reached at which no further increase of the axial deformation of the column could be measured. This condition was selected as the initial condition of the column deformations.
5 . 2 Fire Exposure
During the test, the column was exposed to heating controlled in such a way that the average temperature in the furnace followed, as closely as possible, the I S 0 834 [6] standard temperature-time curve. This curve can be given by the following equation:
where: t = time in minutes
Tf = temperature of furnace in "C
To = initial furnace temperature in "C
During the test, temperatures in the furnace and in the colunln were measured at the locations described earlier.
5 . 3 Recording of Results
Temperature readings were taken at each thermocouple location at intervals of two minutes. The axial deformation of the column, the lateral deflection of the column at mid- height and the rotation of the end plates of the column were measured with varying
frequencies, depending on the rate of change of the measured quantities.
The column was considered to have failed, and the test was terminated, when the axial hydraulic jack, which has a maximum speed of 76 mmlmin, could no longer maintain the load.
I
6 . TEST RESULTSI
characteristics, already given in Table 1, are reiterated. This section contains results and observations for the test. The basic Date tested: Loading: June 12,1991 1400 kN, Concentric Specimen Characteristics: Cross section: 300 x 300 mm Length: 3810 mmReinforcement 4 I$I 16 mm, A500 HW, ribbed bars
Casting day: January 25,1991
Elevation, cross section and finishing detail: Fig. 1
Layout of thermocouples: Figs. 2 and 3
Measured Properties: Concrete Strength
150 mm cube strengths: 29.6 MPa at 7 days 37.5 MPa at 28 days 37.8 MPa at test date
100 mm drilled cylinder strength: 40.3 MPa on October 18, 1991 Steel Strength
Yield and ultimate strength of the reinforcing bars: see Table 2. Moisture Condition
Relative humidity in long test column measured with
Vaisala moisture sensor: 99 % R.H. at test date
Test duration: 60 min
Type of failure: Compression
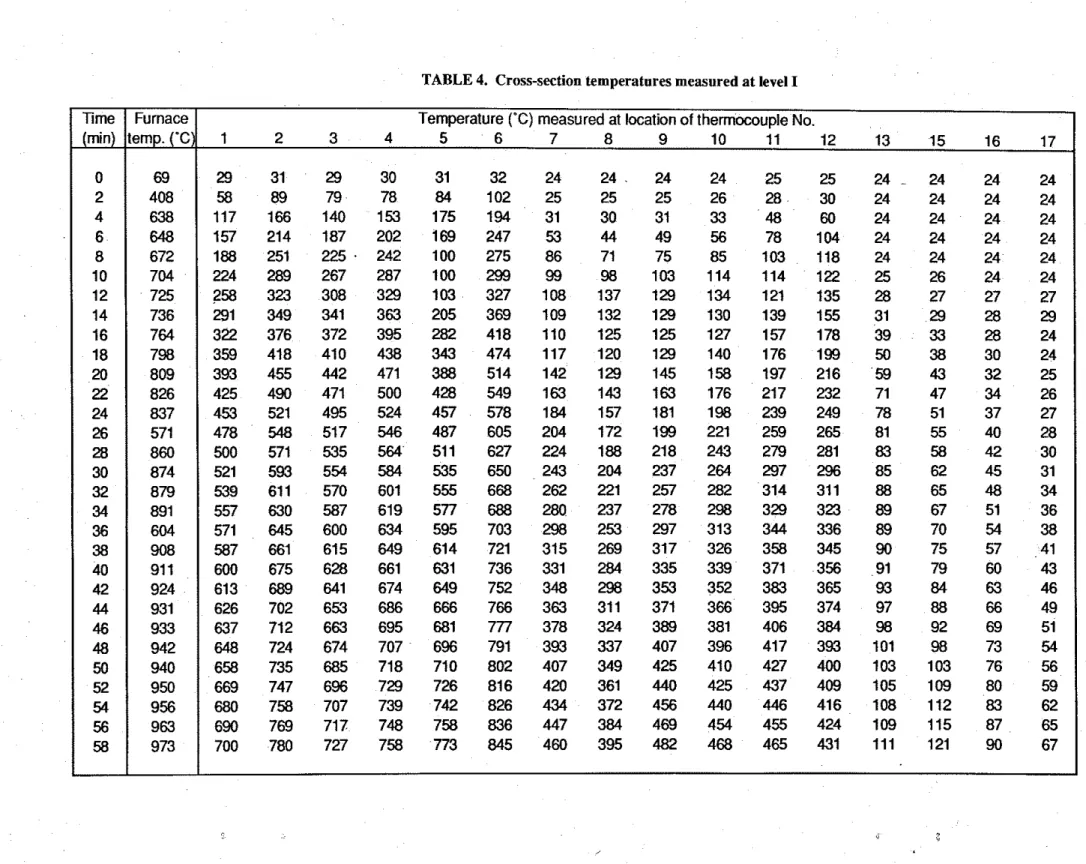
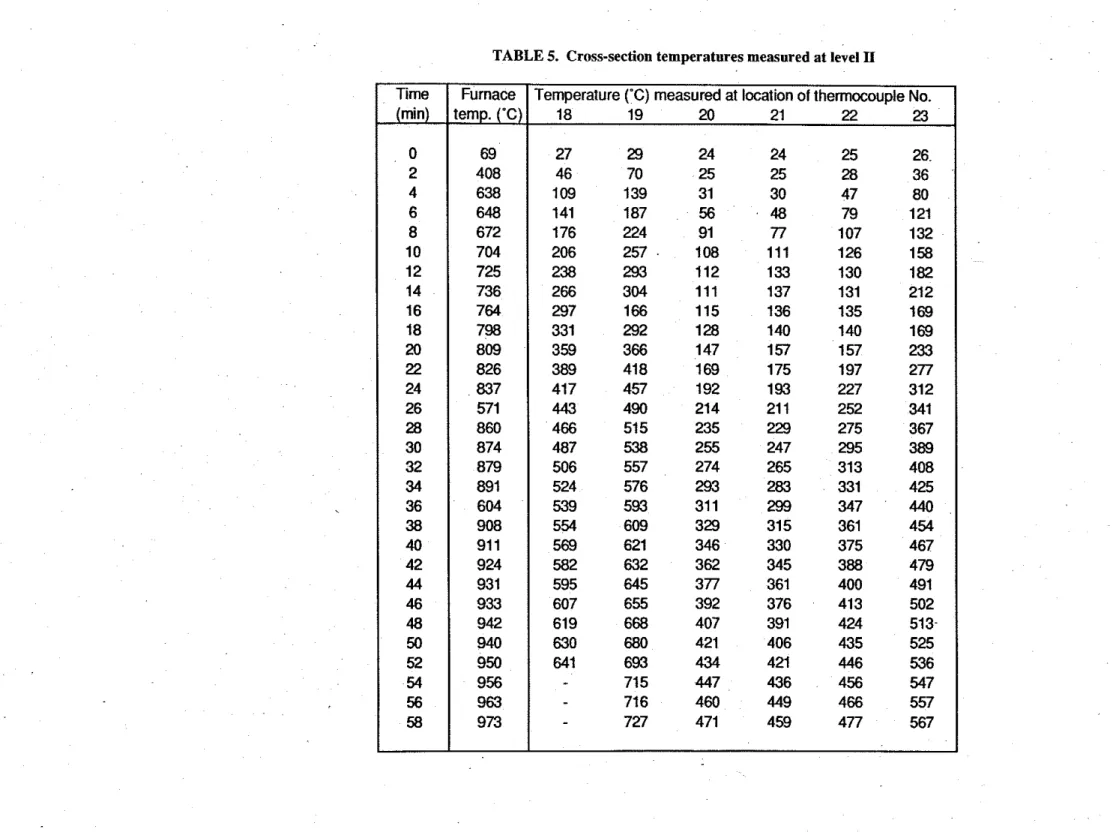
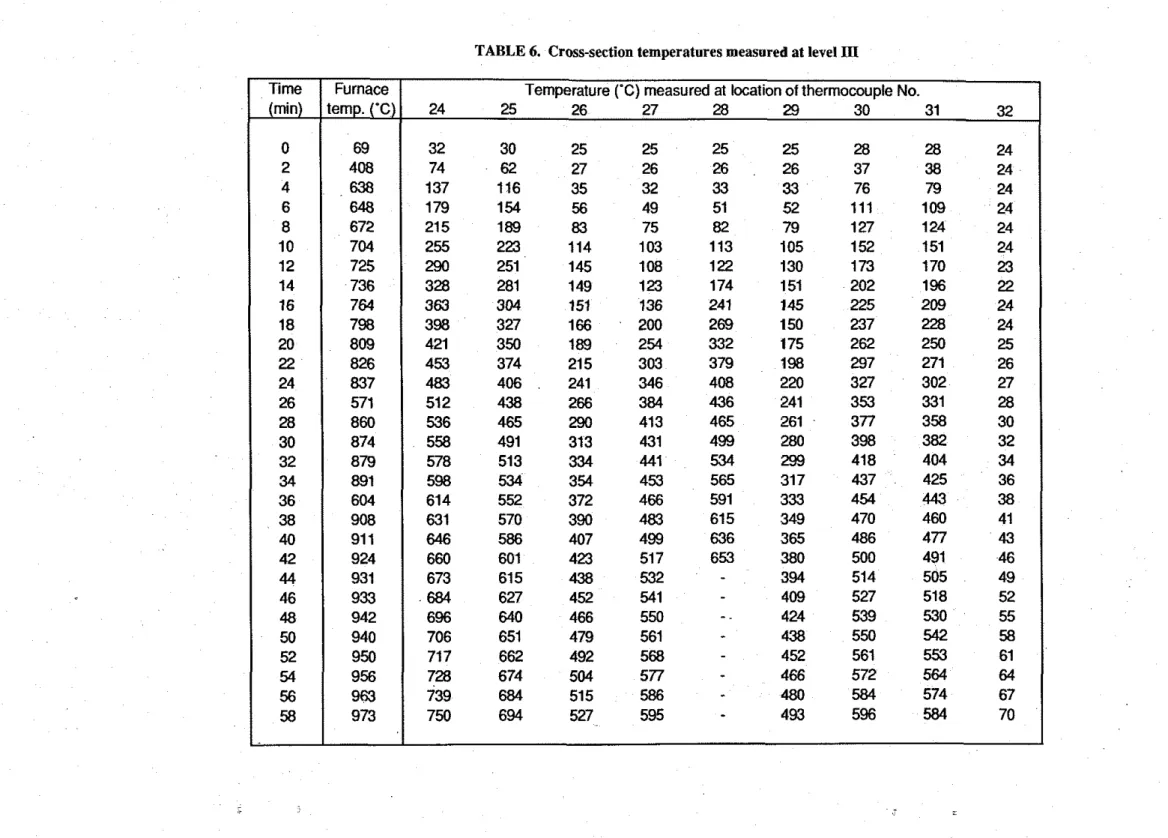
Temperatures: Tables 4-6
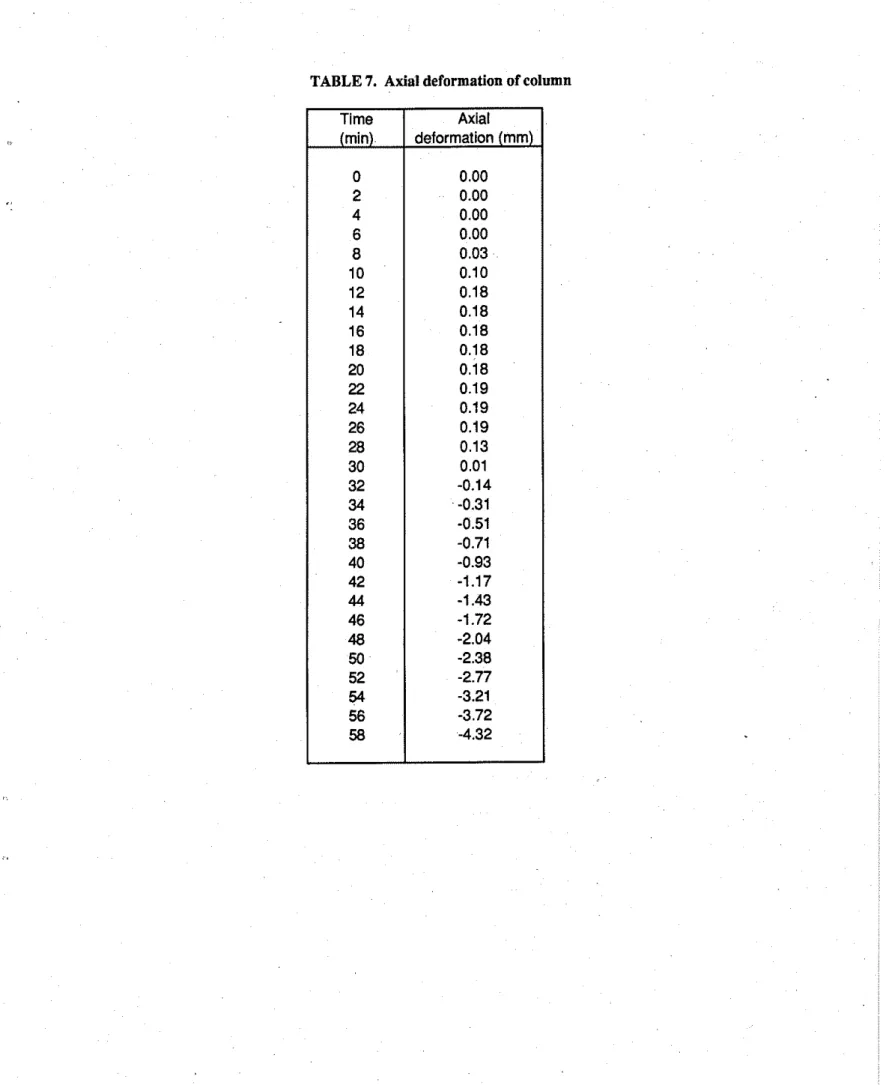
Axial deformation: Table 7
Horizontal deformation at midspan: Not obtained due to early spalling of the concrete, causing the measurement markings to come off.
Observations:
At 10 Min:
-
The concrete spalled at several locations, mainly at the North and West side at about 113 of the column height (the door of Ule furnace is at the East side) and at at the south side at about 314 height.reinforcing bar was visible at the North-West comer.
-
Moisture was visible at the West side surface.-
Because the measurement markings for lateral midheight deflection on the column came off with the spalled concrete, these measurements were no longer possible.at 50 min:
-
Cracks were visible at the North-West comer at approximately midheight, at the North-East comer at approximately 113 height and at the South-East comer at approximately 213 height. All cracks were close to the locationswhere the concrete spalled.
at 60 min:
-
The column failed due to crushing of the concrete and buckling of the reinforcing steel at the locations where the concrete spalled (Figs. 7-10).REFERENCES
1. Prtifung von Vier VerbundstUtzen auf Brandverhalten bei einer Brandbeanspruchung gemtiB Entwurf IS0 834, Ausgabe 111988. Untersuchungsbericht Nr. 853611978- Nau/Rm
-
(26.5.89). Amtliche Materialpriifanstalt fiir das Bauwesen beim Institut fiir Baustoffe, Massivbau und Brandschutz, Tu Braunschweig, pp. 10.2. Steels for General Structural Pumoses; Quality Specifications, Standard SFS 200 . . ,
1985.
3. Hot Rolled Weldable Ribbed Steel Bars for the Reinforcement of Concrete, Standard SFS 1215, 1989.
4. Concrete Compressive Strength, Standard SFS 4474, 1983.
5. Lie, T. T., New Facility to Determine F i e Resistance of Columns, Canadian Journal of Civil Engineering, Vol. 7, 1980.
6. Fire Resistance Tests - Elements of Building Construction, I S 0 834, International Organization for Standardization, 1975.
TABLE 1
Concrete column details
Cross Section: Length:
Reinforcement:
300 x 300 mm
3810 mm
4 $16 mm, A500 HW, ribbed bars
Casting Date: January 25, 1991
Test Date: June 12, 1991
Moisture Condition of
Specimen: 99 % R.H. at test date
Concrete Strength:
150 mm Cube: 29.6 MPa at 7 days
37.5 MPa at 28 days 37.8 MPa at test date 100 mm Drilled Cylinder
TABLE 2
Average tensile strength of reinforcing bars (three tests for each bar size, steel grade A 500 HW)
Ultimate strength WPa) 696.3 679.7 657.3 Bar Size (mm) 6.0 12.0 16.0 Yield strength (MPa) 510.0 543.7 582.3
TABLE 3
Batch quantities and properties of concrete
Average 150 mm cube strength in MPa:
at 7 days 29.7 at 28 days 37.5 Component Cement Fine aggregate: 0
-
0.6 mm 0.5-
1.2 mm 1 - 2 m m Coarse aggregate: 2 - 3 m m 3 - 5 m m 5 - 1 0 m m Water Super plasticizer: SP 62Water cement ratio
Quantity 0cglm3) 371.9 400.0 217.2 331.3 170.3 118.8 559.4 200.0 1.86 0.54
TABLE 4. Cross-section temperatures measured at level I Time (rnin) 0 2 4 6 8 10 12 14 16 18 20 22 24 26 28 30 32 34 36 38 40 42 44 46 48 50 52 54 56 58 Furnace temp. ('C) 69 408 638 648 672 704 725 736 764 798 809 826 837 571 860 874 879 891 604 908 91 1 924 931 933 942 940 950 956 963 973
Temperature ('C) measured at location of thermocouple No.
1 2 3 4 5 6 7 8 9 10 11 12 13 15 16 17 29 31 29 30 31 32 24 24 24 24 25 25 24 24 24 24 58 89 79 78 84 102 25 25 25 26 28 30 24 24 24 24 117 166 140 153 175 194 31 30 31 33 48 60 24 24 24 24 157 214 187 202 169 247 53 44 49 56 78 104 24 24 24 24 188 251 225 242 100 275 86 71 75 85 103 118 24 24 24 24 224 289 267 287 100 299 99 98 103 114 114 122 25 26 24 24 258 323 308 329 103 327 108 137 129 134 121 135 28 27 27 27 291 349 341 363 205 369 109 132 129 130 139 155 31 29 28 29 322 376 372 395 282 418 110 125 125 127 157 178 39 33 28 24 359 418 410 438 343 474 117 120 129 140 176 199 50 38 30 24 393 455 442 471 388 514 142 129 145 158 197 216 58 43 32 25 425 490 471 500 428 549 163 143 163 176 217 232 71 47 34 26 453 521 495 524 457 578 184 157 181 198 239 249 78 51 37 27 478 548 517 546 487 605 204 172 199 221 259 265 81 55 40 28 500 571 535 564 511 627 224 188 218 243 279 281 83 58 42 30 521 593 554 584 535 650 243 204 237 264 297 296 85 62 45 31 539 611 570 601 555 668 262 221 257 282 314 311 88 65 48 34 557 630 587 619 577 688 280 237 278 298 329 323 89 67 51 36 571 645 600 634 595 703 298 253 297 313 344 336 89 70 54 38 587 661 615 649 614 721 315 269 317 326 358 345 90 75 57 41 600 675 628 661 631 736 331 284 335 339 371 356 91 79 60 43 613 689 641 674 649 752 348 298 353 352 383 365 93 84 63 46 626 702 653 686 666 766 363 311 371 366 395 374 97 88 66 49 637 712 663 695 681 777 378 324 389 381 406 384 98 92 69 51 648 724 674 707 696 791 393 337 407 396 417 393 101 98 73 54 658 735 685 718 710 802 407 349 425 410 427 400 103 103 76 56 669 747 696 729 726 816 420 361 440 425 437 409 105 109 80 59 680 758 707 739 742 826 434 372 456 440 446 416 108 112 83 62 690 769 717 748 758 836 447 384 469 454 455 424 109 115 87 65 700 780 727 758 773 845 460 395 482 468 465 431 111 121 90 67
TABLE 5. Cross-section temperatures measured at level 11 Time (min) 0 2 4 6 8 10 12 14 16 18 20 22 24 26 28 30 32 34 36 38 40 42 44 46 48 50 52 54 56 58 Furnace temp. ('C) 69 408 638 648 672 704 725 736 764 798 809 826 837 571 860 874 879 891 604 908 91 1 924 931 933 942 940 950 956 963 973
Temperature ('C) measured at location of thermocouple No.
18 19 20 21 22 23 27 29 24 24 25 26 46 70 25 25 28 36 109 139 31 30 47 80 141 187 56 48 79 121 176 224 91 77 107 132 206 257 108 111 1 26 158 238 293 112 133 130 1 82 266 304 111 137 131 212 297 166 115 136 135 169 331 292 128 140 140 169 359 366 1 47 157 1 57 233 389 418 169 175 197 277 417 457 192 1 93 227 312 443 490 214 21 1 252 341 466 515 235 229 275 367 487 538 255 247 295 389 506 557 274 265 313 408 524 576 293 283 331 425 539 593 31 1 299 347 440 554 609 329 315 361 454 569 621 346 330 375 467 582 632 362 345 388 479 595 645 377 361 400 491 607 655 392 376 413 502 619 668 407 391 424 513 630 680 421 406 435 525 641 693 434 421 446 536 715 447 436 456 517 716 460 449 466 557 - 727 471 459 477 567
TABLE 6. Cross-section temperatures measured at level HI Time (min) 0 2 4 6 8 10 12 14 16 18 20 22 24 26 28 30 32 34 36 38 40 42 44 46 48 50 52 54 56 58 Furnace temp. ('C) 69 408 638 648 672 704 725 736 764 7% 809 826 837 571 860 874 879 891 604 908 91 1 924 931 933 942 940 950 956 9 M 973
Temperature ('C) measured at location of thermocouple No.
24 25 26 27 28 29 30 31 32 32 30 25 25 25 25 28 28 24 74 62 27 26 26 26 37 38 24 137 116 35 32 33 33 76 79 24 1 79 154 56 49 51 52 111 109 24 21 5 1 89 83 75 82 79 1 27 1 24 24 255 223 114 1 03 113 105 1 52 151 24 290 251 145 108 122 130 1 73 1 70 23 328 281 1 49 123 1 74 151 202 196 22 363 304 151 136 241 145 225 209 24 398 327 166 200 269 150 237 228 24 421 350 189 254 332 175 262 250 25 453 374 21 5 303 379 198 297 271 26 483 406 241 346 408 220 327 302 27 512 438 266 384 436 241 353 331 28 536 465 290 413 465 261 377 358 30 558 491 313 431 499 280 398 382 32 578 51 3 334 441 534 299 418 404 34 598 534 354 453 565 317 437 425 36 614 552 372 466 591 333 454 443 38 631 570 390 483 615 349 470 460 41 646 586 407 499 636 365 486 477 43 660 601 423 51 7 653 380 500 491 46 673 615 438 532 394 514 505 49 684 627 452 541 409 527 518 52 696 640 466 550 424 539 530 55 706 651 479 561 438 550 542 58 717 662 492 568 452 561 553 61 728 674 504 577 466 572 564 64 739 684 51 5 586 480 584 574 67 750 694 527 595 493 596 584 70
TABLE 7. Axial deformation of column Time (min) 0 2 4 6 8 10 12 14 16 18 20 22 24 26 28 30 32 34 36 38 40 42 44 46 48 50 52 54 56 58 Axial deformation (rnm) 0.00 0.00 0.00 0.00 0.03 0.10 0.18 0.18 0.18 0.18 0.18 0.19 0.19 0.19 0.13 0.01 -0.14 -0.31 -0.51 -0.71 -0.93 -1.17 -1.43 -1.72 -2.04 -2.38 -2.77 -3.21 -3.72 -4.32
Figure
1
-
508x610 x40 mm Steel plate 8 l i e s 10 mm Dia at 40 mmr
30 mm Coverto main reinforcing bars
p
l
o
m
J
16 Bars mm Dia16 mm Dia bar
40 mm thick plate
Detail
'C'
Elevation, cross section and finishing detail of the reinforced
concrete column
Level
Level
Level
Figure
2
Levels at which thermocouples in the concrete
column were installed
Level
I
Levels II and Ill
Thermocouples Nos. 18
-
23at
level II Thermocouples Nos. 24-
32at
level IllFigure 3
Location of thermocouples at various levels in column
Figure
4
I
'
FURNtCE FRAME ECCENTRIC JACK HEAD EXTENSION ECCENTRIC JACK SUPPORT BEAM SUPPORT COLUMN CONCRETE FLOORSOUTH ELEVATION
COLUMNI
FURNAC FRAME7
*
I CONCRETEI
FLOOR IEAST ELEVATION
BEAMFigure
5
TOP V I E W
7 COLUMN
COLUMN FURNACE CHAMBER DOOR
FRONT
V I E W
/- CEILING INSULATION
FLOOR INSULATION
Figure
6
Location and numbers of thermocouples in
column furnace chamber
Figure
7
Figure
8
Figure 9
Figure
10
APPENDIX
Methods and Instruments
I
The following methods and instruments were used to measure the thermal
i
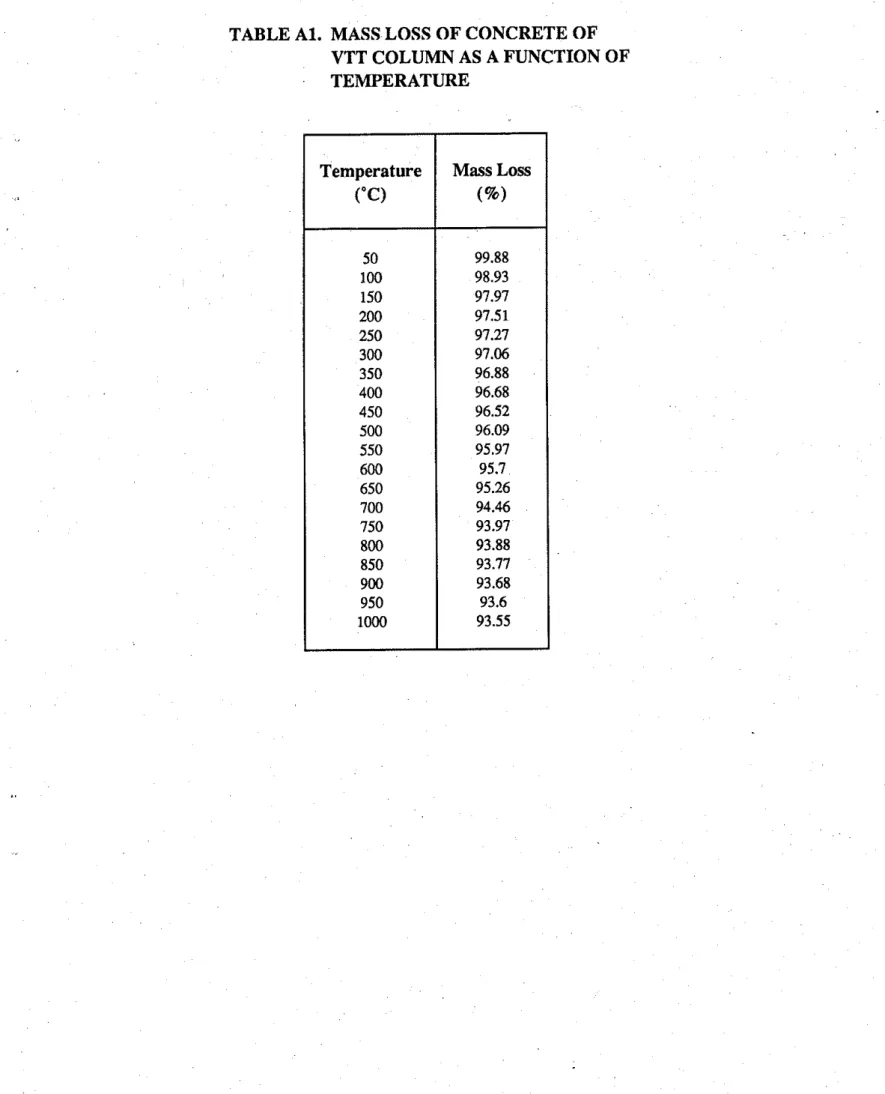
properties of the concrete of the VTT column: II Mass Loss
The mass loss curve was produced by a DuPont 951 Thermogravimewic Analyzer. The specimens that were tested weighed between 30 and 40 mg. Scanning rates of 10"CImin in a nitrogen atmosphere and of 20"C/min in air static were used. Thermal Expansion
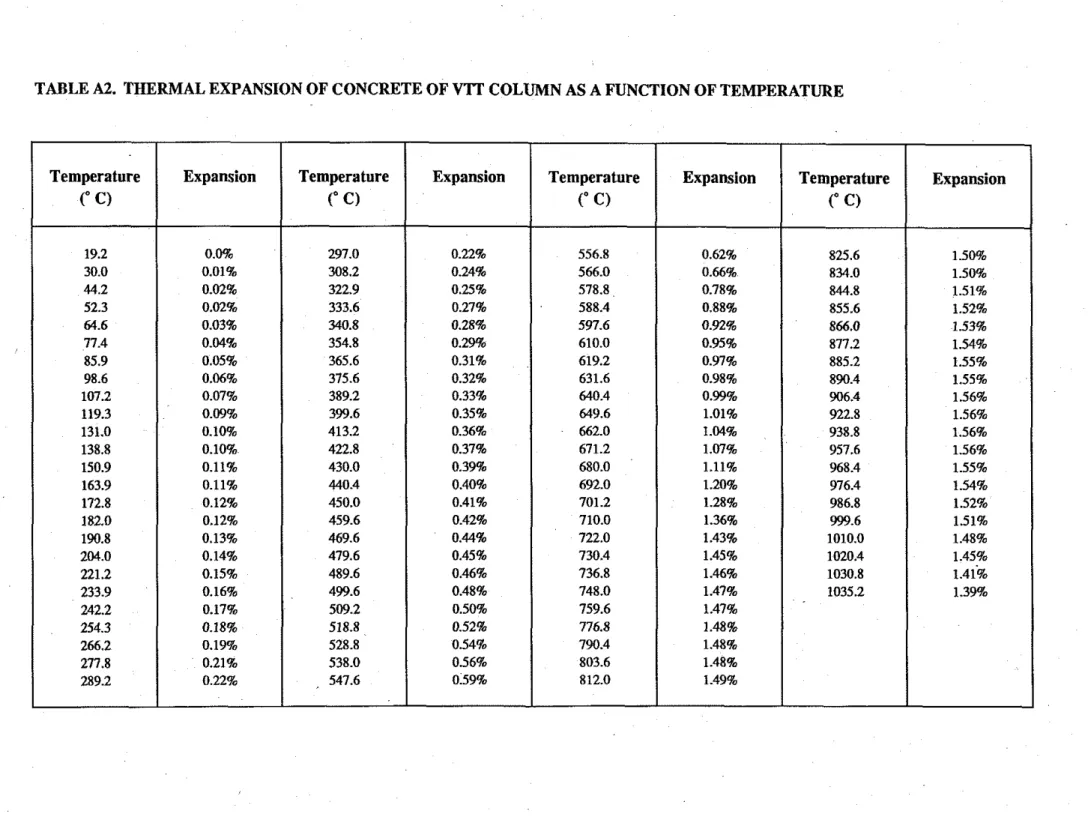
The thermal expansion curve was produced by a Theta Dilatronic apparatus. The specimens were 40 mm long and 12.5 mm square in cross-section, The rate of heating was 10"C/min in air static from room temperature to 1200°C.
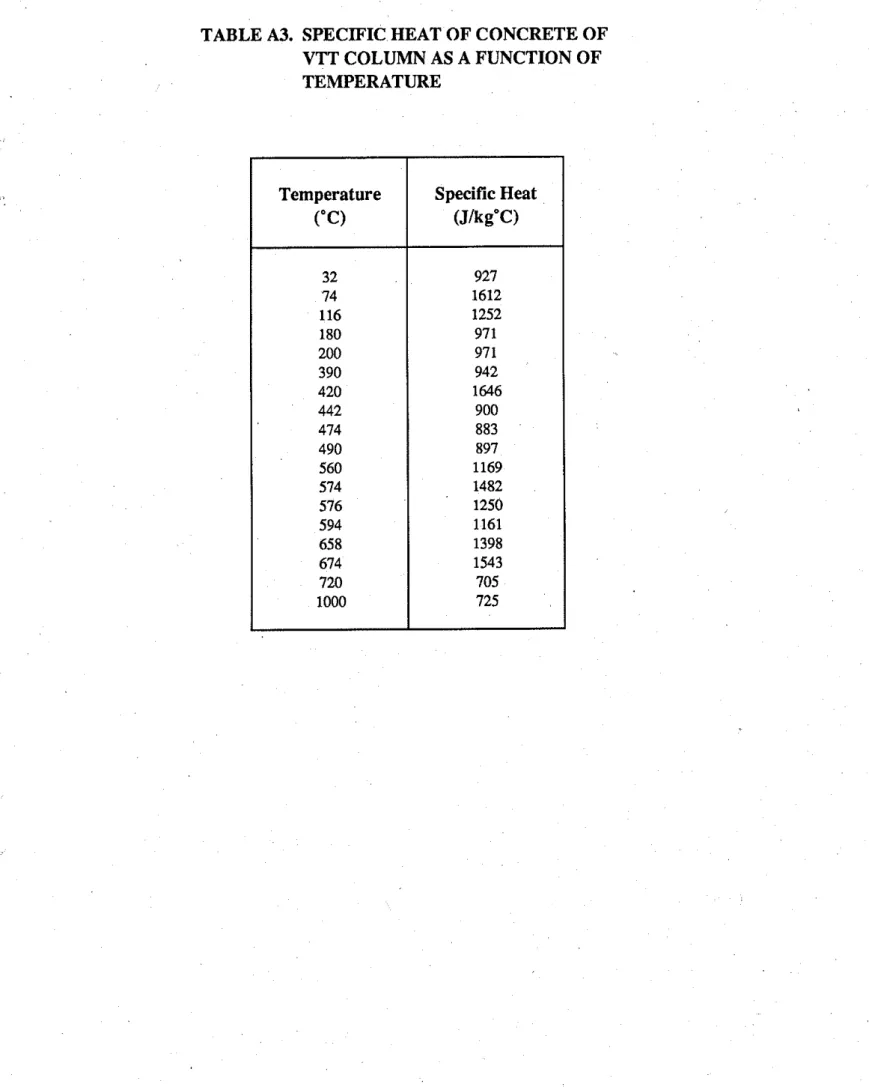
Specific Heat
The specific heat of the concrete was measured with two instruments: A DuPont 2910 Differential Scanning Calorimeter (DSC) and a DuPont 1600°C High Temperature Differential Thermal Analyzer (DTA).
The specimens tested in the DSC weighed between 30 and 40 mg. The DSC analyzed the samples from room temperature to 725'C in a nitrogen atmosphere. A scanning rate of 10"CImin was used. The error in reproducibility of the specific heat, determined with Aluminum, was 1.5%.
The DTA was used to determine the specific heat of the concrete from 725'C to 1000°C
.
Scanning rates of 10"Clrnin and 20"Clmin were used on 50 mg samples in both a nitrogen atmosphere and in air static. The DTA error in reproducibility was for silver wire 3%.Thermal Conductivity
A TC-31 Thermal Conductivity Meter made by Kyoto Electronics was used to determine the thermal conductivity curve.
TABLE Al. MASS LOSS OF CONCRETE OF VTT COLUMN AS A FUNCTION OF TEMPERATURE Temperature ("C) 50 100 150 200 250 300 350 400 450 500 550 600 650 700 750 800 850 900 950 loo0 Mass Loss 99.88 98.93 97.97 97.51 97.27 97.06 96.88 96.68 96.52 96.09 95.97 95.7 95.26 94.46 93.97 93.88 93.77 93.68 93.6 93.55
92
0 100 200 300 400 500 600 700 800 900 1000
0
Temperature,
CFigure
A1
Mass Loss of Concrete of
VTT
Column as a Function of
Temperature
TABLE A2. THERMAL EXPANSION OF CONCRETE OF VlT COLUMN AS A FUNCTION OF TEMPERATURE Temperature (" C) 19.2 30.0 44.2 52.3 64.6 77.4 85.9 98.6 107.2 119.3 131.0 138.8 150.9 163.9 172.8 182.0 190.8 204.0 221.2 233.9 242.2 254.3 266.2 277.8 289.2 Expansion 0.W 0.01% 0.02% 0.02% 0.03% 0.04% 0.05% 0.06% 0.07% 0.09% 0.10% 0.10% 0.11% 0.11% 0.12% 0.12% 0.13% 0.14% 0.15% 0.16% 0.17% 0.18% 0.19% 0.21% 0.22% Temperature (" C) 297.0 308.2 322.9 333.6 340.8 354.8 365.6 375.6 389.2 399.6 413.2 422.8 430.0 440.4 450.0 459.6 469.6 479.6 489.6 499.6 509.2 518.8 528.8 538.0 547.6 Expansion 0.22% 0.24% 0.25% 0.27% 0.28% 0.29% 0.31% 0.32% 0.33% 0.35% 0.36% 0.37% 0.39% 0.40% 0.41% 0.42% 0.44% 0.45% 0.46% 0.48% 0.50% 0.52% 0.54% 0.56% 0.59% Temperature (" C) 556.8 566.0 578.8 588.4 597.6 610.0 619.2 631.6 640.4 649.6 662.0 671.2 680.0 692.0 701.2 710.0 722.0 730.4 736.8 748.0 759.6 776.8 790.4 803.6 812.0 Expansion 0.62% 0.66% 0.78% 0.88% 0.92% 0.95% 0.97% 0.98% 0.99% 1.01% 1.04% 1.07% 1.11% 1.20% 1.28% 1.36% 1.43% 1.45% 1.46% 1.47% 1.47% 1.48% 1.48% 1.48% 1.49% Temperature (" C) 825.6 834.0 844.8 855.6 866.0 877.2 885.2 890.4 906.4 922.8 938.8 957.6 968.4 976.4 986.8 999.6 1010.0 1020.4 1030.8 1035.2 Expansion 1.50% 1.50% 1.51% 1.52% 1.53% 1.54% 1.55% 1.55% 1.56% 1.56% 1.56% 1.56% 1.55% 1.54% 1.52% 1.51% 1.48% 1.45% 1.41'% 1.39%
0
Temperature,
CFigure
A2
Thermal Expansion of Concrete of
VTT
Column as
a
Function of
Temperature
TABLE A3. SPECIFIC HEAT OF CONCRETE OF VTT COLUMN AS A FUNCTION OF TEMPERATURE Temperature ("C) 32 74 116 180 200 390 420 442 474 490 560 574 576 594 658 674 720 1000 Specific Heat (Jlkg°C) 927 1612 1252 971 97 1 942 1646 900 883 897 1169 1482 1250 1161 1398 1543 705 725
0
Temperature, C
Figure
A3
Specific Heat of Concrete of
VTT
Column as a Function of
Temperature
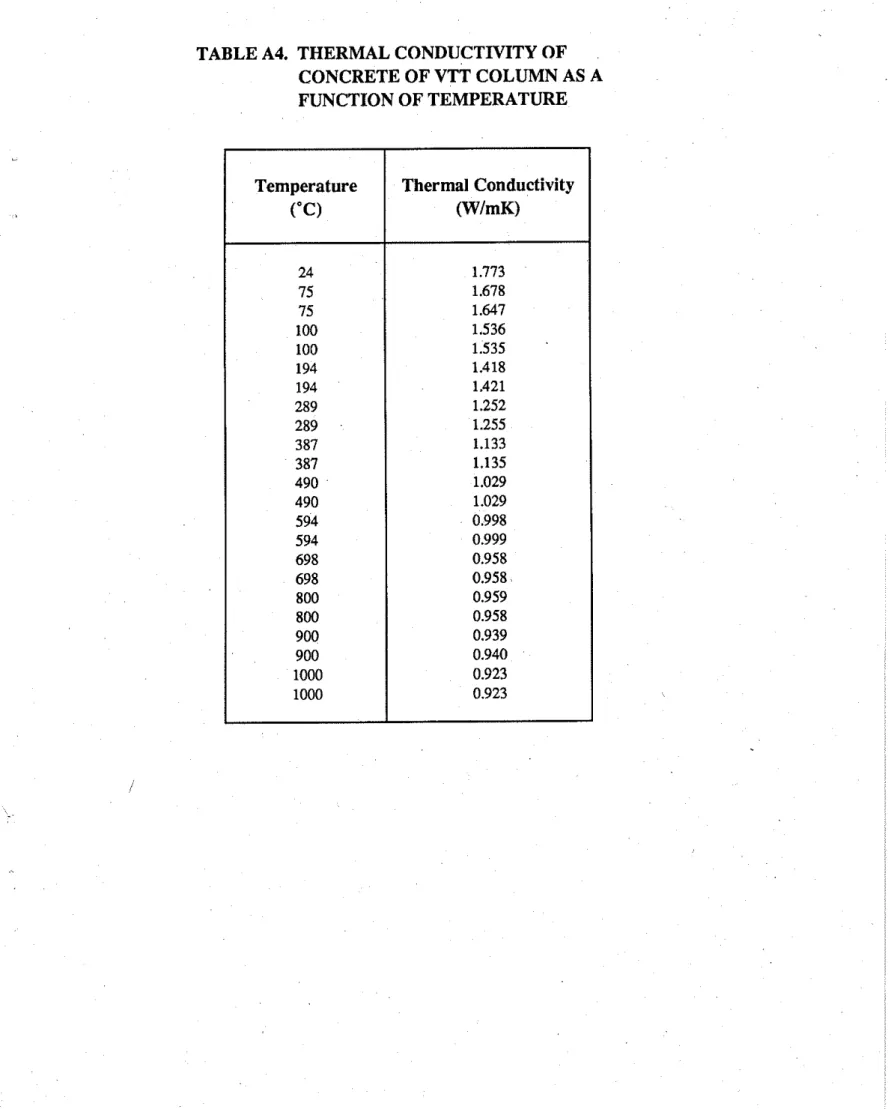
TABLE A4. THERMAL CONDUCTIVITY OF CONCRETE OF VTT COLUMN AS A FUNCTION OF TEMPERATURE Temperature ( " c ) 24 75 75 100 100 194 194 289 289 387 387 490 490 594 594 698 698 800 800 900 900 1000 1000 Thermal Conductivity (WImK) 1.773 1.678 1.647 1.536 1.535 1.418 1.421 1.252 1.255 1.133 1.135 1.029 1.029 0.998 0.999 0.958 0.958 0.959 0.958 0.939 0.940 0.923 0.923
0