Publisher’s version / Version de l'éditeur:
Journal of the Acoustical Society of America, 3, 4, pt.1, pp. 1978-1986, 1993-04
READ THESE TERMS AND CONDITIONS CAREFULLY BEFORE USING THIS WEBSITE. https://nrc-publications.canada.ca/eng/copyright
Vous avez des questions? Nous pouvons vous aider. Pour communiquer directement avec un auteur, consultez la première page de la revue dans laquelle son article a été publié afin de trouver ses coordonnées. Si vous n’arrivez pas à les repérer, communiquez avec nous à [email protected].
Questions? Contact the NRC Publications Archive team at
[email protected]. If you wish to email the authors directly, please see the first page of the publication for their contact information.
NRC Publications Archive
Archives des publications du CNRC
This publication could be one of several versions: author’s original, accepted manuscript or the publisher’s version. / La version de cette publication peut être l’une des suivantes : la version prépublication de l’auteur, la version acceptée du manuscrit ou la version de l’éditeur.
Access and use of this website and the material on it are subject to the Terms and Conditions set forth at
Disturbance caused by residential air conditioner noise
Bradley, J. S.
https://publications-cnrc.canada.ca/fra/droits
L’accès à ce site Web et l’utilisation de son contenu sont assujettis aux conditions présentées dans le site
LISEZ CES CONDITIONS ATTENTIVEMENT AVANT D’UTILISER CE SITE WEB.
NRC Publications Record / Notice d'Archives des publications de CNRC:
https://nrc-publications.canada.ca/eng/view/object/?id=1317a659-136a-4ff6-bd3d-6d2634a79500 https://publications-cnrc.canada.ca/fra/voir/objet/?id=1317a659-136a-4ff6-bd3d-6d2634a79500
Dist urba nc e c a use d by re side nt ia l a ir c ondit ione r noise
N R C C - 3 7 0 0 2
B r a d l e y , J . S .
A p r i l 1 9 9 3
A version of this document is published in / Une version de ce document se trouve dans:
Journal of the Acoustical Society of America,
3, (4, pt.1), pp. 1978-1986,
April-93
http://www.nrc-cnrc.gc.ca/irc
The material in this document is covered by the provisions of the Copyright Act, by Canadian laws, policies, regulations and international agreements. Such provisions serve to identify the information source and, in specific instances, to prohibit reproduction of materials without written permission. For more information visit http://laws.justice.gc.ca/en/showtdm/cs/C-42
Les renseignements dans ce document sont protégés par la Loi sur le droit d'auteur, par les lois, les politiques et les règlements du Canada et des accords internationaux. Ces dispositions permettent d'identifier la source de l'information et, dans certains cas, d'interdire la copie de documents sans permission écrite. Pour obtenir de plus amples renseignements : http://lois.justice.gc.ca/fr/showtdm/cs/C-42
Disturbance caused by residential
air
conditioner noise
J. S. Bradley
Institute for Research in Construction, National Research Council, Ottawa KJA OR6, Canada
(Received 13 January 1992; accepted for publication 2 December 1992)
This paper reports the results of a field survey of disturbance caused by outdoor residential air conditioner noise. For 550 subjects, questionnaire responses along with integrated air conditioner and ambient noise levels were obtained. Reported hearing of neighbors' air conditioners and annoyance to the noise from neighbors' air conditioners were
significantly related to measured noise levels. Responses were most strongly related to the level by which the air conditioner noise exceeded the ambient noise. Residents of
noisier neighborhoods were less disturbed by neighbors' air conditioner noise. Owners of air conditioners were less disturbed by their neighbors' air conditioner noise by an amount equal to an approximate 7-dBA difference in noise levels. Acceptable limits for air conditioner noise levels can be derived from the dose response curves produced in this study.
PACS numbers: 43.50.Sr, 43.50.Qp
INTRODUCTION
In urban areas, the noise produced by residential cen-tral air conditioners and heat pumps can be a source of annoyance to neighbors. While some communities have tried to control the noise of such devices, there have not been extensive studies of the effects of this noise on people. As a result, limits for outdoor residential air conditioner noise have often been somewhat arbitrarily derived, rather than being based on noise levels that residents actually find acceptable.
The purpose of the study was to try to identify accept-able limits for outdoor residential air conditioner noise. As part of this goal, it was desired to determine whether own-ing an air conditioner and the general level of environmen-tal noise ·in the neighborhood affected the acceptability of the noise from a neighbor's air conditioner. A field survey was carried out in the summer of 1990 in metropolitan Toronto to relate subjects' responses concerning the noise from their neighbors' air conditioning and heat pump units to measured noise levels. Subjects were interviewed in their homes and the noise levels of their neighbors' air
condi-ditioner noise is more acceptable in areas with generally higher outdoor noise levels from other sources.
I. PROCEDURE
A. Experimental design
A total of 600 subjects were to be interviewed in four equal groups determined by the four combinations of high and low ambient noise along with owning imd not owning an air conditioner. Subjects had to have at least one neigh-bor with a central air conditioner or heat pump, be at least 18 years of age, and it was hoped to include an approxi-mately equal number of male and female respondents.
To ensure maximum cooperation, subjects first re-ceived an introductory letter describing the survey as con-cerning particular aspects of the neighborhood environ-ment, and encouraging them to participate. No mention was made that the survey concerned air conditioner noise until after the interview.
B. The questionnaire
tioner were measured at several points near the unit and The questionnaire was administered directly to sub-close to the subject's home. jects in their homes by a trained interviewer. Most re-·
Previous field studies have considered: road traffic sponses were in the form of 7 point response scales. The noise, t-s aircraft noise, 6-9 and railroad noise.10 (See also value "1" was labeled "Not at all," the value "4" was
Ref. 11 for many more references.) For these louder trans- labeled "Medium," and the value "7" was labeled "Very". portation noises, speech and sleep interference effects have By not labeling intermediate values of the seven point been reported as well as quite high levels of annoyance. scale, it was hoped that subjects would linearly interpolate These other noise sources are also different because they between the extremes of the end values and valid interval intrude into the neighborhood, whereas air conditioner scale response data would be obtained.
noise is very much a part of the neighborhood. Initial open-ended questions allowed subjects to span-Central air conditioning, along with improved acous- taneously mention air conditioner noise. These were fol-tical insulation, is sometimes used to ensure acceptable in- lowed by questions asking how considerate their neighbors door conditions in areas with higher outdoor environmen- were thought to be, and whether an immediate neighbor tal noise. Of course, outdoor noise levels are then further had a central air conditioner or heat pump.
increased by the addition of central air conditioners. It is This initial section was followed by the main body of often supposed that this is acceptable because owning an the questionnaire that included direct questions concerning air conditioner makes us less sensitive to the noise from a how often they heard or were annoyed by various environ-neighbor's air conditioner, and that added outdoor air con- mental noises. These included road traffic noise, aircraft
noise, train noise, and residential air conditioner noise. This block of questions was repeated four times. The ques-tions were asked for daytime and nighttime condiques-tions as well as for the subject being indoors and outdoors for each time of day. These were followed by questions concerning possible sleep disturbance by each type of environmental noise.
The final section of the questionnaire gathered the usual socio-economic information about respondents. Questions concerned the total family income, the subject's years of formal education, the subject's age, the number of adults and the number of young people in each home. They were also asked whether air conditioner noise was more disturbing in a particular room, whether they owned a central or window air conditioner, and how much extra they would pay if buying a $2000.00 central air conditioner to obtain a very quiet model. The interviewer also recorded whether the subject was male or female, whether they ap-peared to have any hearing problems and whether their home was a row house, semi-detached, or a detached home.
C. Noise measurements
Integrated A-weighted sound level measurements were made at seven positions near each air conditioner. Each measurement was made at a height of approximately 1 m above the ground and consisted of a 30-s integrated level. Three measurements were made at positions 1. 8 m from the air conditioner unit when it was operating. Additional measurements were made at the neighbor's property line, at the facade of the neighbor's home, and at the neighbor's patio. A final measurement was made with the unit not operating to represent ambient background noise levels at each site.
General neighborhood noise levels were measured us-ing miniature noise loggers, that recorded an A-weighted
Leq value for each minute of a complete 24-h period. From
these 1-min Leq values day-time (7:00a.m. to 10:00 p.m.), night-time (10:00 p.m. to 7:00 a.m.), and complete 24-h
Leq values were calculated. Finally, the noise measurement
personnel noted the two most obvious sources of environ-mental noise at each home.
II. THE SURVEY SAMPLE A. Acoustical data
For 550 subjects, air conditioner noise level data were .obtained for at least one neighbor's air conditioning unit, and these integrated A-weighted sound levels are
summa-rized in Table I. The three measurements close to the air
conditioner unit were averaged to give a single source level measurement. At some locations the mean air conditioner noise levels were only a few decibels above the background noise with the air conditioner not operating.
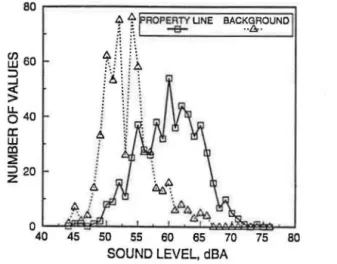
The air conditioner noise levels are further illustrated by the distribution of measured A-weighted air conditioner noise levels shown in Fig. 1 for the property line position measurements. The plot also includes the distribution of background noise levels with the unit not operating. At
1979 J . Acoust. Soc. Am .• Vol. 93, No.4, Pt. 1, April1993
TABLE I. Summary of measured noise level values. Standard
Variable Mean deviation Minimum Maximum N Integrated levels
Source level, dBA 64.3 3.0 54.0 72.5 551 Property line level, dBA 60.1 4.8 45.0 74.0 550
Facade level, dBA 58.3 4.7 48.0 76.0 508
Patio level, dBA 55.8 3.9 45.0 67.0 550
Background level, dBA 53.5 3.9 44.0 66.0 550 Environmental levels
Daytime Leo,, dBA 61.2 3.3 50.0 71.0 599 Nighttime Leo,• dBA 54.5 3.5 47.0 65.0 599
24-h Leo,• dBA 59.7 3.2 53.0 69.0 599
this location, mean air conditioner noise levels were only 6.6 dBA above the mean background level. General
envi-ronmental noise was measured in terms of A-weighted Leq
values obtained from one 24-h measurement at each
loca-tion. These values are also summarized in Table I.
These results suggested two basic problems would be encountered in analyzing this data. First, it is evident that many measured air conditioner noise levels would have been influenced by the existing background noise levels. Thus the measured values would not always correctly rep-resent only air conditioner noise. Second, subjective re-sponses were solicited to air conditioner noises that in many cases may not have been completely audible.
B. Survey data
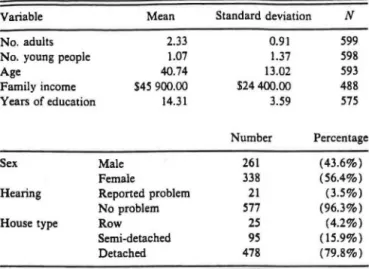
Complete survey and noise data were obtained from 550 respondents. The top part of Table II summarizes the socioeconomic description of the survey sample. The stan-dard deviations of these variables, shown in the top part of Table II, are quite large and indicate that there was a broad range of ages, incomes, and years of education included in the survey sample.
The bottom part of Table II shows the breakdown of the survey sample by sex, reported hearing problems, and
ffi
60 ::::> ..J セ@ セ@ 40 a: w co セ@ セ@ 20 ッセ セセセセセセ セセセセセNNj@ セ@ w セ@ oo セ@ro
セ@ セ@SOUND LEVEL, dBA
FIG. I. Distribution of measured air conditioner noise levels at the prop-erty line compared to the distribution of measured background noise levels.
TABLE II. Top: Means and standard deviations of socioeconomic survey variables. Bottom: Breakdown of sample by sex, reported hearing prob-lems and housing type.
Variable No. adults No. young people Age Family income Years of education Sex Hearing House type Mean 2.33 1.07 40.74 $45 900.00 14.31 Male Female Reported problem No problem Row Semi-detached Detached Standard deviation N 0.91 599 1.37 598 13.02 593 $24 400.00 488 3.59 575 Number Percentage 261 (43.6%) 338 (56.4%) 21 (3.5%) 577 (96.3%) 25 (4.2%) 95 (15.9%) 478 (79.8%)
housing type. There was only a small bias toward female respondents that was not expected to influence the survey results. Very few of the subjects appeared to have hearing problems and most lived in detached homes.
Ill. SPONTANEOUS AND GENERAL RESPONSES
Subjects were first presented with open-ended ques-tions about neighborhood likes and dislikes. Only one sub-ject spontaneously mentioned anything related to air con-ditioners in response to these questions. However, 185 subjects spontaneously mentioned that they liked their neighbor:hood because it was quiet, and 171 subjects men-tioned noise related dislikes about their neighborhood. Thus there is substantial evidence that noise is a determin-ing factor of neighborhood quality, but there was no evi-dence from these results that air conditioner noise was an important source of this noise.
A total of 109 subjects found air conditioner noise most disturbing in their bedroom, but 367 responded that the location in their house had no effect. There seems to be some importance to locating air conditioner units as far away as possible from bedrooms. On average, subjects were prepared to pay $243.91 (just over 12%) extra to obtain a quiet unit when buying a $2000.00 central air conditioning system. From this survey, conducted in the middle of the summer, 78% of the respondents indicated that they kept some windows open.
The noise measurement team noted two most obvious sources of neighborhood noise. In 74% of the cases, road traffic noise was the major source of noise and in 24% of the cases trains were the major source of noise. In only 0.5% of the cases was air conditioner noise considered to be the major source of neighborhood noise, and in only 1% of the cases was it even the second most audible source of noise. Aircraft noise was the most prominent secondary source of noise.
1980 J . Acoust. Soc. Am., Vol. 93, No. 4, Pt. 1, April 1993
IV. INITIAL INDIVIDUAL SUBJECT DATA ANALYSES
The bulk of the questionnaire was composed of ques-tions that directly elicited responses concerning how often subjects heard and how annoyed they were by: road traffic noise, aircraft noise, train noise, and air conditioner noise. Subjects' responses were elicited for conditions when they were indoors as well as when they were outdoors, for both daytime and nighttime periods.
Responses to air conditioner noise were correlated with measured air conditioner noise levels, as well as with the square and the cube of each noise measure. A number of significant correlations were obtained but all were less than 0.16. Only daytime responses produced significant
correlation coefficients (p
<
0.01). Nighttime responseswere not significantly related to any of the noise mea.Sures in these initial results. Correlations with property line air conditioner noise levels produced the highest correlations. Only outdoor daytime annoyance responses were re-lated to the background noise levels and these correlation coefficients were negative, indicating that higher back-ground noise levels were less disturbing. Presumably this was because the higher background noise levels masked the air conditioner noise better.
Responses concerning road traffic noise were related to measured Lcq values. These traffic noise responses were significantly negatively related to the measure of ownership of an air conditioner, indicating that owners of air condi-tioners were less disturbed by road traffic noise.
V. INDIVIDUAL DATA-METHODS TO IMPROVE CORRELATIONS
A. Composite response scales
Composite response scales were formed: summing all responses related to air conditioner noise, and by factor analysis of the responses. None of the composite scales that were formed were substantial improvements over the indi-vidual response scores. They tended to have weaker corre-lations with noise measures than some of the individual
responses. It was concluded that it was not possible to form
a composite response scale that usefully increased the strength or the number of correlations with the various air conditioner noise level measurements.
B. Excluding low signal/noise data
It was often difficult to accurately measure air condi-tioner noise levels, because background noise levels were relatively high, and in many cases subjects may not have been able to hear the neighbor's air conditioner. If the air conditioner noise is considered as the signal that causes disturbance, the amount by which the air conditioner noise exceeds the ambient background noise level can be consid-ered as a signal/noise ratio. The average signal/noise ratios varied among the measurement positions at each home.
Figure 2 shows the distribution of signal/noise ratios obtained from A-weighted air conditioner and background noise levels measured at the property line positions. At this location the distribution of signal/noise ratios includes a
100 en 80 w :::l
_.
<( 60 > u.. 0 a: 40 w CD :::E :::lz
20 0 -10 0 10 20 SIGNAUNOISE, dBFIG. 2. Distribution of signal/noise ratios for property line air condi-tioner noise measurements.
pronounced peak at 0 dB. This indicates that a number of air conditioner noise levels were incorrect and actually re-flected the level of the background noise. The situation was worse at the patio and the facade positions in that there were more 0-dB signal/noise ratios.
Correction for background noise can only be reliably carried out when the air conditioner noise levels are signif-icantly greater than the background levels and therefore corrections were not possible at a large number of loca-tions.
Alternatively, excluding cases where the signal/noise ratios are very low should improve the correlations be-tween noise measurements and subjective responses. A range of cut-off signal/noise ratios were tested for the noise data from each of the four measurement positions. The benefits of excluding data based on signal/noise ratios were limited because the improvements in correlation coeffi-cients were very small and the process greatly reduced the number of subjects included in the analyses.
C. Signal/noise type noise measures
Earlier results suggested that signal/noise ratios and not noise levels were the better predictor of subjective re-sponses. To test this idea, multiple linear regression
anal-yses were performed regressing response scores onto linear combinations of each noise measure and the background · noise level. For background noise and air conditioner noise measured at the property line, all eight responses concern-ing hearconcern-ing or beconcern-ing annoyed by air conditioner noise were significantly related to the combined noise measures. For air conditioner noise measurements at the facade, seven of
the eight responses were significantly related (p < 0.05) to
both noise measures. For air conditioner noise measure-ments at the patio, responses were only related to back-ground noise measures and only for five of the eight re-sponses.
The measured environmental noise Leq values were
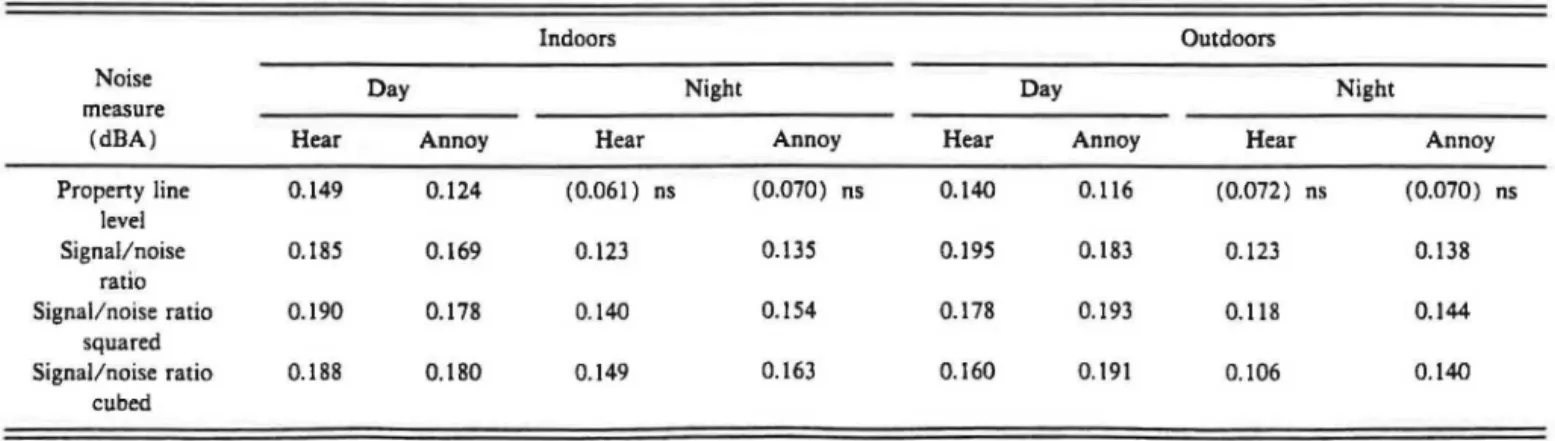
also tested to determine whether they might be a better indicator of ambient noise than the measured background noise levels with the air conditioner unit turned off. Al-though some results were significant, combinations of air conditioner noise levels and the background levels with the units turned off were always better predictors of responses. Because of the success of combinations of propeny line air conditioner noise levels and background noise levels, the signal/noise ratio at the property line was created as a new objective predictor measure. Correlations between the eight principal air conditioner noise responses and this new measure are compared to correlations with the property line noise levels in Table III. Also shown are the results of correlations with the square and the cube of the property line signal/noise ratios. In all cases, the correlations with the signal/noise ratios are larger than with the property line noise levels. Correlations with the square or the cube of the signal/noise ratios tended to be a little stronger than correlations with the linear signal/noise ratios.
The signal/noise ratio was always a better predictor of adverse responses to air conditioner noise. This may at least be partly due to minimizing the influence of cases where air conditioner noise levels were similar to
back-ground noise levels. It may also indicate that the signal/
noise ratio is the more fundamentally correct correlate of adverse responses to air conditioner noise.
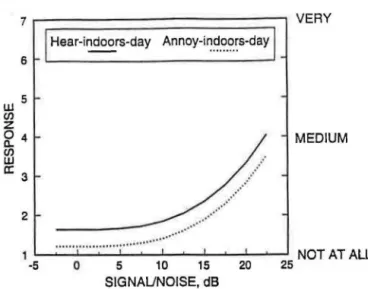
The best fit regression lines for each response versus the cube of the property line signal/noise ratio were plotted and were all similar in form. As an example, Fig. 3 shows responses for indoor daytime situations. In all cases the
TABLE Ill. Comparison of correlations of responses to air conditioner noise with property line noise levels, and property line signal/noise ratios. ( ns =nonsignificant correlation, p < O.OS).
Indoors Outdoors
Noise Day Night Day Night
measure
(dBA) Hear Annoy Hear Annoy Hear Annoy Hear Annoy
Property line 0.149 0. 124 (0.061) ns (0.070) ns 0.140 0.116 (0.072 ) ns (0.070) ns level Signal/ noise 0.185 0.169 0. 123 0. 135 0.195 0. 183 0. 123 0.138 ratio Signal/noise ratio 0.190 0. 178 0.140 0.154 0.178 0.193 0.118 0.144 squared Signal/noise ratio 0.188 0.180 0.149 0.163 0.160 0.191 0.106 0.140 cubed
6 5 UJ en
z
セT@ en UJ a: 3 2 Hear-indoors-day aョョッケMゥセセN_NセセウM、。ケ@...
···/
.·
4.·· ...··
0 5 10 15 20 SIGNAUNOISE, dB VERY MEDIUM NOT AT ALL 25FIG. 3. Best-fit regression lines for indoor daytime responses versus prop-erty line signal/noise ratio.
curves show almost no influence of signal/noise ratio be-low signal/noise ratio values of + 5.0 dB. Between + S-and + 10.0-dB mean responses begin to increase with in-creasing signal/noise ratio. In all cases, subjects report hearing air conditioner noise more often than being an-noyed by it.
All regression curves suggested that adverse responses to air conditioner noise are not related to the air condi-tioner noise level below a signal/noise ratio of + 5 dB. The quietest sites had background noise levels of approximately 45 dBA. Thus at these quietest sites there would be no detectable increase in adverse responses to air conditioner noise below 50 dBA. Even at these very quiet sites, mean annoyance would increase only slightly for air conditioner noise levels of up to approximately 55 dBA.
One must be cautious in interpreting these mean trend regression lines. The standard deviations of the actual re-sponses about these best fit lines ranged between 1.5 and 1.8 response scale points. Thus at the lowest noise levels some subjects were as annoyed as others were at the high-est noise levels. Of course, on average the trend is for an-noyance to increase with signal/noise ratio above a thresh-old value of between +5 and + 10 dB.
VI. INFLUENCE OF OWNERSHIP AND NEIGHBORHOOD AMBIENT NOISE LEVELS
A. Success of subject selection procedure
The experimental design for the survey was planned so that subjects would be equally distributed among the four combinations of high and low ambient noise levels with owners and nonowners of air conditioners. Measured 24-h
Leq values varied from 53 to 69 dBA with a mean of
ap-proximately 60 dBA (see Table I). Thus subjects were split at an Leq24 of 60 into two approximately equal groups
representing higher and lower ambient noise levels. The distribution of the subjects between owners and nonowners was not as successfully achieved. In total, 445 subjects (74.3%) had at least one type of air conditioner (window
1982 J. Acoust. Soc. Am., Vol. 93, No. 4, Pt. 1, April 1993
unit or central) and only 151 ( 25.2%) owned no air con-ditioner. This uneven distribution of owners and nonown-ers compromised the experimental design making it more difficult to obtain statistically significant results.
B. Analysis of variance results
The influence of ownership and of ambient noise levels was first investigated using two-way analyses of variance. The data were divided into four groups so that there were two levels of each of the two independent variables: own-ership, and ambient noise level. The high and low ambient noise groups were first based on the Leq24 values. Subse-quently, high and low noise groups were also created by using daytime and nighttime Leq values. All eight r!!-sponses concerning hearing and being annoyed by air con-ditioner noise were used as dependent variables.
Using Leq24 values to create high and low ambient
noise groups led to significant main effects of ownership on all four annoyance responses such that nonowners tended to be more annoyed. There was also a significant main effect of ambient noise level ( Leq24 ) on responses concern-ing how often air conditioner noise was heard while outside in the day-time. For several other responses a main effect was almost significant (p < 0.05), but there were no signif-icant interaction effects.
When high and low ambient noise level groups were created using either daytime or nighttime Leq values, sim-ilar effects were observed. Thus, there was · a consistent effect for nonowners of air conditioners to be more an-noyed by the noise of their neighbor's air conditioner. However, being able to hear the neighbor's air conditioner was usually not influenced by owning a unit. In some cases the measured ambient noise also had an effect on re-sponses.
C. Influence of air conditioner ownership
The data were first divided into two groups according to whether subjects owned an air conditioner. For each group, regression analyses were carried out for the eight air conditioner noise responses versus measured air condi-tioner noise levels. For the smaller nonowner group, sig-nificant relationships were not found. Thus it was not pos-sible to compare owners and nonowners as a function of air conditioner noise level.
As a simpler form of analysis, the mean response of each group (owners/nonowners) was calculated and the differences were tested using analysis of variance. Three of the four annoyance differences were statistically significant
(p
<
0.05), but the noise level differences were too small to be significant. Thus both owners and nonowners were on average exposed to approximately the same air conditioner and ambient noise levels, but were not equally annoyed. Nonowners were in all cases more annoyed by air condi-tioner noise than were owners. Mean differences in annoy-ance responses varied from 0.32 to 0.45 annoyannoy-ance scale points.The mean differences in annoyance responses were converted to equivalent air conditioner noise level
ウイN]]]]]]]]]]]]]]]セセ@
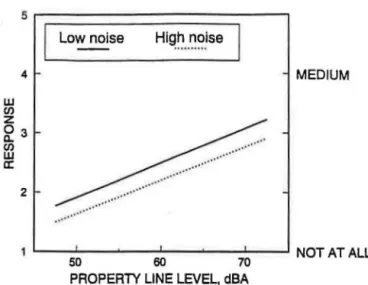
4 w en z 03 c.. en w a: 2 Low noise hゥセセM MセセMゥウ・@ MEDIUM L---...s....--..._ _ _._ _ ⦅N⦅⦅MMセN⦅MMMNNセ@ NOT AT ALL 50 60 70PROPERlY LINE LEVEL, dBA
FIG. 4. Best fit regression lines of how often subjects hear neighbor's air conditioner while outdoors during the daytime for high and low ambient noise groups.
ences from regressions of annoyance responses versus property line air conditioner noise levels for the complete data set. (So that statistically significant relationships were obtained). The slopes of these regression lines varied be-tween 0.45 and 0.60 annoyance scale points per 10 dBA. Thus each annoyance difference could be converted to an equivalent air conditioner noise level difference. The aver-age of these equivalent noise level differences was 7.3 dBA.
On average, owning an air conditioner made subjects 7.3 dBA more tolerant of their neighbor's air conditioner. This may have simply indicated, that with their own air conditioner operating, it was more difficult to hear their neighbors unit. One could conclude from this, that maxi-mum permissible air conditioner noise levels at sites where all homes have air conditioners could be 7 dBA higher than for sites of mixed air conditioner ownership. The mean level of annoyance at both types of sites would then be expected to be similar. While this might on average be acceptable, there will always be some residents who are more highly annoyed even though they do own an air con-ditioner.
D. Influence of ambient noise conditions
Regression analyses were performed for response scores versus property line air conditioner noise levels for both the high and low Leq24 groups. Several responses were
significantly related to property line noise levels.
Figure 4 plots the mean regression lines for the re-sponses concerning how often air conditioner noise was heard while the subjects were outside in the daytime. From this figure, it is seen that subjects at low ambient noise sites heard air conditioner noise more often, and this difference was essentially independent of the air conditioner noise level. The horizontal difference between the two almost parallel regression lines is approximately 5 dBA. Thus at low ambient noise sites subjects would hear 60-dBA air conditioner noise approximately as often as subjects at
1983 J . Acoust. Soc. Am., Vol. 93, No. 4, Pt. 1, April 1993
high-noise sites would report hearing 65-dBA air condi-tioner noise.
This difference seems to be directly related to the dif-ferent masking effect of the ambient noise at high- and low-noise sites. The average Lcq24 at the low-noise sites was
57.4 dBA and at the high-noise sites was 62.6 dBA, with an average difference of about 5 dBA. Thus, at high-noise sites where the ambient noise is on average 5 dBA louder, it requires approximately 5 dBA more air conditioner noise for the high ambient noise subjects to bear it as often as low ambient noise subjects. When the same subjective re-sponse scores were regressed against the property line signal/noise ratios, the resulting two regression lines were then very similar indicating no differences between low and high ambient noise sites. This test again suggests that the fundamental predictor variable is the signal/noise ratio, and not the measured level.
When regression lines for annoyance scores versus property line air conditioner noise levels were compared, there were differences between high and low ambient noise groups. These differences were not found when the same annoyance responses were regressed against the property line signal/noise ratios. Once again the effect of ambient noise level seemed to be more fundamentally a signal/noise ratio effect.
VII. INDIVIDUAL DATA AND NON-NOISE PREDICTORS
The combined effect of noise and non-noise predictors was examined by stepwise multiple regression analyses of responses to air conditioner noise onto combinations of predictor variables. In the first series of regression analyses,
all of the measured noise levels were included as possible predictor variables. In a second series of analyses only the property line signal/noise ratio was included as a possible noise predictor variable. The non-noise predictors included
all the socioeconomic variables describing each subject. From these analyses, the principal significantly related non-noise variables were whether windows were open, ownership of an air conditioner, and the subject's level of education. Although the addition of the non-noise vari-ables increased the multiple correlation coefficients, the largest was only 0.27.
The non-noise variables added significantly to the ーイ・セ@
dictions and the noise measures were not always the most important predictors of the responses to air conditioner noise. This again relates to the relatively low levels of air conditioner noise. In situations where the air conditioner noise is masked by the background noise, one would expect responses to be significantly influenced by non-noise fac-tors as was observed in these results.
VIII. GROUPED DATA
By aggregating scores for groups of respondents, the percentage of each group that reported hearing their neigh-bor's air conditioner or being annoyed by it was calculated. Various schemes were tried, but the most successful con-sisted of grouping subjects' responses for eight property line air conditioner noise level groups. Each group
boイL]]] ]]]]セ MMMMMM MMセ@ 70 60 セUP@ w J: セTP@ w (.) a: セSP@ 20 10 Day-indoors
--Night-indoors •o()o Day-outdoors ··•·· Night-outdoors...
セ Mᄋ@ ..···
..
.
__...
ᄋᄋ セ ᄋᄋᄋᄋ@
;/
...
)""'.·•···
,.,"'
:
....
···;/;""'
...
""/.
/ ..···
.,"
/..
..
。 セセMMセMMセMMセ MMセセ セ@ 45 50 55 60 65 70 75PROPERTY LINE LEVEL, dBA
FIG. 5. Percentage of subjects hearing air conditioner noise for daytime and nighttime while either indoors or outdoors versus property line air conditioner noise level.
eluded a 3-dBA wide range of property line air conditioner noise levels. The lowest and highest groups were open ended. From each of the eight groups, the percentage of subjects scoring greater than one on each of the air condi-tioner noise response scales was calculated. These
percent-age values were then plotted versus the group mean noise levels as dose response curves and subjected to regression analyses.
Responses concerning the percentage of subjects hear-ing their neighbor's air conditioner were most strongly cor-related with the linear noise measures. The percentage of subjects annoyed by the noise of their neighbor's air con-ditioner was more strongly correlated with the cube of the noise measures.
Figure 5 shows the percentage of subjects hearing their neighbor's air conditioner versus mean property line noise level. The actual data points as well as the best fit linear regression lines are shown. Significant numbers of people did report hearing their neighbor's air conditioner. As might be expected, these results show that subjects heard their neighbor's air conditioner more often when they were outside. For both indoor and outdoor situations subjects heard their neighbor's air conditioner more often during the day-time.
Similar results were obtained when the same percent-age responses were plotted versus the mean property line signal/noise ratios. The resulting regression equations are included in Table IV. The results were very similar because for this grouped data property line noise levels and signal/ noise ratios were very highly intercorrelated.
The percentages of subjects who were annoyed by the noise of their neighbor's air conditioner are plotted versus mean property line noise levels in Fig. 6. The equations of the best-fit regression lines, shown in Table IV, include the
TABLE IV. Best fit regression equations from grouped data for percentage of subjects hearing neighbor's air conditioner or annoyed by the neighbor's air conditioner noise versus property line noise level or signal/noise ratio.
Percent hearing neighbors air conditioner versus dBAP (A-weighted air conditioner noise level at the property line) . Indoors, daytime Indoors, nighttime Outdoors, daytime Outdoors, nighttime Percent= 1.396 · dBAP-54.35 Percent=0.881 · dBAP-26.92 Percent= 1.671 · dBAP-49.11 Percent= 1.394 · dBAP-41.00 Percent hearing neighbors air conditioner versus SNAP (A-weighted signal/noise ratio at the property line).
Indoors, daytime Indoors, nighttime Outdoors, daytime Outdoors, nighttime Percent= 1.804 · SNAP-17.17 Percent= 1.148 · SNAP-18.14 Percent=2.146 · SNAP-36.62 Percent= 1.820 · SNAP-30.30 Percent annoyed by neighbors air conditioner noise versus dBAP (A-weighted air conditioner noise level at the property line).
Indoor, daytime Indoors, nighttime Outdoors, daytime Outdoors, nighttime
Percent= -5.218 · dBAP+0.000615 · dBAP3+ 198.22
Percent= -0.993 · dBAP+0.000160 · dBAP3+44.34
Percent= -6.662 · dBAP+0.000775 · dBAP3+258.62
Percent= -6.653 · dBAP +0.00075 I · dBAP3 + 259.76
Percent annoyed by neighbor's air conditioner noise versus SNAP (A-weighted signal/noise ratio at the property line).
Indoors, daytime Indoors, nighttime Outdoors, daytime Outdoors, nighttime
Percent=0.429 · SNAP+0.00727 · SNAP3+ 13.59
Percent=0.607 · SNAP-0.00188 · SNAP3+ 14.77 Percent=0.375 · SNAP-0.00971 · SNAP3+21.28
Percent= -0.092 · SNAP-0.01023 · SNAP3+20.45
1984 J. Acoust. Soc. Am., Vol. 93, No. 4, Pt. 1, April 1993
Multiple correlation coefficient 0.953 0.866 0.988 0.901 0.957 0.876 0.985 0.914 0.979 0.931 0.933 0.927 0.975 0.957 0.960 0.958
WPセ]]]]セMMMMMMMMセセ@ Day-indoors 60 0 50 w セ@ セTP@ < l-i]3o (.) a: w c..20 10
-·
Night-indoors - - - · 0 Day-outdoors...•
Night-outdoors - - a ...,
• / I / 1 / I • :' I .:' I,... ,
....,
• .. : I • ...,
...
,
,
..
·
/ セ ᄋ ᄋ@... !····: / ..
... !--.:.'b ...
_...
0 45 50 55 60 65 70 7PROPERTY LINE LEVEL, dBA
FIG. 6. Percentage of subjects annoyed by air conditioner noise for day-time and nightday-time while both indoors and outdoors versus property line air conditioner noise level.
cube of the mean measured noise levels as well as a linear tenn. The curve of the regression lines at the lowest noise levels is of no practical significance and is simply due to the limitations of the curve fitting process with a small number of data points. The differences among the four sets of data are similar to, but smaller, than those in Fig. 5. Subjects were more annoyed when outside, and when outdoors they were most annoyed during the daytime.
The same percentages of subjects annoyed by their neighbor's air conditioner noise were plotted versus the property line signal/noise ratio and the resulting regression equations are included in Table IV. The pattern of results was very similar to the results of the previous figure. In both cases annoyance seems to level off at a more or less constant residual value at low noise levels. It is only when the property line noise level exceeds about 55 dBA or when
the signal/noise ratio exceeds approximately
+
5 dB thatthe percentage of annoyed subjects increases markedly with increasing noise level.
IX. CONCLUSIONS
The major conclusions of this paper are summarized as follows.
(a) Measured outdoor residential air conditioner noise levels are often close to the existing background noise level caused by other urban environmental noise sources. The average measured background level with no air conditioner noise from the present daytime measurements was 53 dBA. Thus it would often be impossible to measure lower air conditioner noise levels.
(b) There were essentially no spontaneously men-tioned adverse responses to air conditioner noise. However, subjects were, on average, prepared to pay 12% more for a very quiet central air conditioner.
(c) Subjective responses to air conditioner noise were significantly related to measured noise levels, but the amount of variance explained was quite small. At air
con-1985 J. Acoust. Soc. Am., Vol. 93, No. 4, Pt. 1, April 1993
ditioner noise levels of up to 50 dBA, virtually no one reported any annoyance to air conditioner noise. Even up to 55 dB A, mean annoyance scores were very small.
(d) Individual responses were in general more strongly related to signal/noise ratios than to the measured noise levels. There was virtually no indication of annoy-ance to air conditioner noise below a signal/noise ratio of
+5 dBA .
(e) The frequency of hearing the neighbor's air con-ditioner tended to be related linearly with the objective noise measures.
(f) Annoyance to the noise of the neighbor's air
con-ditioner tended to be related to the cube of the objective noise measures.
(g) Ambient noise levels (as measured by Leq24)
in-fluenced responses by changing the signal/noise ratio, and thus signal/noise ratio measures best predicted these ef-fects.
(h) The effect of owning an air conditioner seemed to make respondents approximately 7 dBA less sensitive to their neighbor's air conditioner.
(i) Non-noise variables were significant predictors of adverse responses to air conditioner noise. The importance of non-noise predictors is believed to be related to the air conditioner noise levels often being close to existing back-ground noise levels.
(j) The clearest dose response relationships between
subjective and objective responses were obtained from grouped data that averaged out individual differences. The percentage of subjects reporting hearing their neighbor's air conditioner were best related to the linear fonn of the noise measures. The percentage of subjects that were an-noyed by their neighbor's air conditioner noise were again best related to the cube of the noise measures.
ACKNOWLEDGMENTS
The experimental design and analysis of this project was carried out by the National Research Council of Can-ada and the field measurements were carried out by the Ontario Ministry of the Environment under the supervi-sion of Dr. Ramani Ramakrishnan. Financial support for the project came from, the Ontario Ministry of the Envi-ronment, the Heating Refrigerating and Air Conditioning · Institute of Canada, the National Research Council, as well as the City of North York, the City of Toronto, Tor-onto Hydro, the Ontario Home Builders Association, On-tario Hydro, and the OnOn-tario Ministry of Housing.
1 J. S. Bradley, "Predictors of Adverse Human Responses to Traffic
Noise," in Proceedings of the ASTM Symposium on Community Noise, Kansas City, May (ASTM, Philadelphia, PA, 1978), pp. 108-123.
2J. S. Bradley and B. A. Jonah, "The Effects of Site Selected Variables on
Human Responses to Traffic Noise Part I: Type of Housing by Traffic Noise Level," J. Sound Vib. 66 (4), 589-604 (1979).
J J. S. Bradley and B. A. Jonah, "The Effects of Site Selected Variables on
Human Responses to Traffic Noise Part II: Road Type by Socio-Economic Status by Traffic Noise Level," 1. Sound Vib. 67 (3), 395-407 (1979).
4 J. S. Bradley and B. A. Jonah, "The Effects of Site Selected Variables on
Human Responses to Traffic Noise Part III: Community Size by
Economic Status by Traffic Noise Level," J. Sounct Vib. 67 (3).
409-423 ( 1979).
5B. A. Jonah, I. S. Bradley, and N. E. Dawson, "Predicting Individual
Subjective Responses to Traffic Noise,'' J. Appl. Psych. 66 (4), TYセUPQ@
( 1981).
6S. E. Birnie, F. L. Hall, and S. M. Taylor, "Community Response to
Noise from a General Aviation Airport." Noise Contr. Eng. 15 (l),
37-45 ( 1980).
7F. L. Hall, S. E. Birnie, S.M. Taylor, and J. E. Palmer, "Direct
Com-parison of Community Response to Road Traffic Noise and to Aircraft Noise," J. Acoust. Soc. Am. 70, QVYセQVYX@ (1981 ).
1 R. B. Bullen, A. J. Hede, and E. Kyriacos, "Reactions to Aircraft Noise
1986 J. Acoust. SOc. Am., Vol. 93, No. 4, Pt. 1, April 1993
in Residential Areas Around Australian Airports," J. Sound Vib. 108, (2), 199-228 (1986).
セrN@ B. Bullen, and A. J. Hede, "Comparison of the Effectiveness of Measures of Aircraft Noise Exposure by Using Social Survey Data," J. Sound Vib. 108 (2), 227-245 ( 1986).
10J. M. Fields and J. G. Walker, "Comparison of the Relationships
be-tween Noise Level and Annoyance in Dift'erent Surveys: A Railway Noise Versus Aircraft and Road Traffic Noise Comparison," J. Sound Vib. 81 (1), 54-80 (1982).
11 P. M. Nelson, Transponation NoiSe Reference Book (Butterworths,
London, 1987).
J. S. Bradley: Air conditioner noise 1986