HAL Id: hal-01890787
https://hal.archives-ouvertes.fr/hal-01890787v2
Submitted on 3 Dec 2018
HAL is a multi-disciplinary open access
archive for the deposit and dissemination of
sci-entific research documents, whether they are
pub-lished or not. The documents may come from
teaching and research institutions in France or
abroad, or from public or private research centers.
L’archive ouverte pluridisciplinaire HAL, est
destinée au dépôt et à la diffusion de documents
scientifiques de niveau recherche, publiés ou non,
émanant des établissements d’enseignement et de
recherche français ou étrangers, des laboratoires
publics ou privés.
Awareness Techniques to Aid Transitions between
Personal and Shared Workspaces in Multi-Display
Environments
Arnaud Prouzeau, Anastasia Bezerianos, Olivier Chapuis
To cite this version:
Arnaud Prouzeau, Anastasia Bezerianos, Olivier Chapuis. Awareness Techniques to Aid Transitions
between Personal and Shared Workspaces in Multi-Display Environments. Proceedings of the 2018
International Conference on Interactive Surfaces and Spaces, Nov 2018, Tokyo, Japan. pp.291–304,
�10.1145/3279778.3279780�. �hal-01890787v2�
Awareness Techniques to Aid Transitions between Personal
and Shared Workspaces in Multi-Display Environments
Arnaud Prouzeau
1,2Anastasia Bezerianos
2Olivier Chapuis
2 1Faculty of Information Technology, Monash University, Melbourne, Australia2LRI, Univ. Paris-Sud, CNRS, Inria, Université Paris-Saclay, Orsay, France
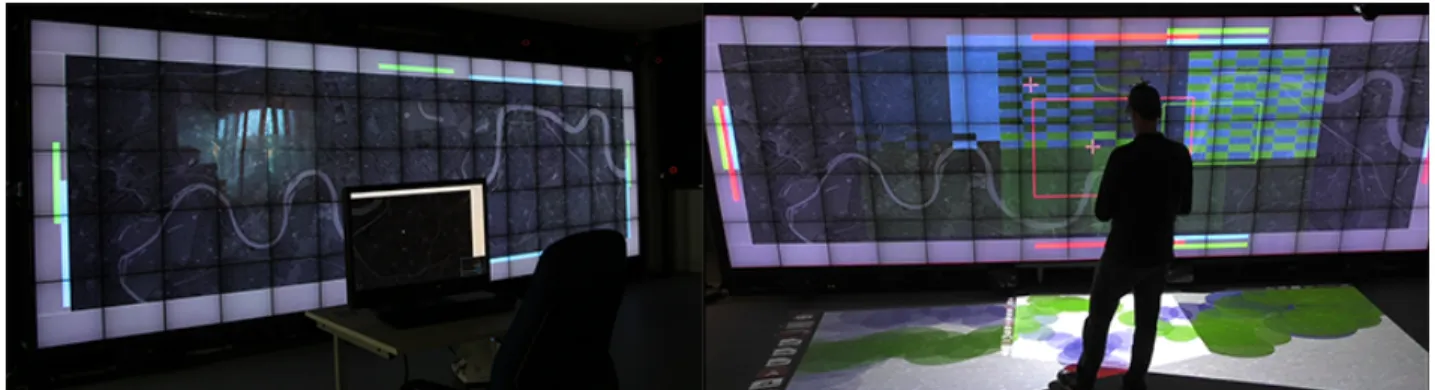
Figure 1. The prototype. (Left) Our Multi-Display Environment composed of a wall display and two workstations (one visible in the photo). (Right) Three workspace awareness techniques: Awareness Bars at the edges of the wall, Focus Map on the wall display, and Step Map projected on the ground.
ABSTRACT
In multi-display environments (MDEs) that include large shared displays and desktops, users can engage in both close collaboration and parallel or personal work. To transition be-tween the displays can be challenging in complex settings, such as crisis management rooms. To provide workspace awareness and to factilitate these transitions, we design and implement three interactions techniques that display users’ activities. We explore how and where to display this activity: briefly on the shared display, or more persistently on a periph-eral floor display. In a user study, motivated by the context of a crisis room where multiple operators with different roles need to cooperate, we tested the usability of the techniques and provided insights on such transitions in systems running on MDEs.
ACM Classification Keywords
H.5.2 Information Interfaces and Presentation: User Interfaces - Graphical user interfaces
Author Keywords
Multi-Display Groupware; crisis management; workspace awareness; wall displays
Arnaud Prouzeau, Anastasia Bezerianos & Olivier Chapuis. Awareness Techniques to Aid Transitions between Personal and Shared Workspaces in Multi-Display Environments, In ISS ’18: Proceedings of the 2018 International Conference on Interactive Surfaces and Spaces, 291–304, ACM, November 2018.
© ACM, 2018. This is the author’s version of the work. It is posted here by permission of ACM for your personal use. Not for redistribution. The definitive version is published in ISS ’18, November 25–28, 2018, Tokyo, Japan. doi:10.1145/3279778.3279780
INTRODUCTION
Multi-Display Groupware (MDG) systems are used to support collaboration around complex tasks, such as brainstorming, data sense-making or emergency planning. They can include several private and shared displays, and they allow for mixed-focus collaboration [28]: users can work in parallel on sub-tasks on their private display, or closely together on the same task on a shared display [47]. Such tasks requires users to perform several transitions between their personal and shared workspaces [57]. Nevertheless, to help users decide when to initiate such transitions, collaborators need to have a global awareness of current and past work of others in the workspace. (workspace awareness).
In this paper, we propose interaction techniques that provide such workspace awareness to aid these transitions. We demon-strated our techniques in a prototype of a crisis management system, which represent an extreme case of multi-display col-laboration. Our prototypes, meant to support multiple users with different roles is composed of: a very high resolution interactive wall display, several workstations and other periph-eral displays. We designed three techniques to aid workspace awareness and help identify opportunities to transition from personal to close collaborative workspaces, by displaying in-formation about the activities of others. Our designs vary with respect to where this additional information is placed in the environment (in the focus of the shared display or on the pe-riphery), and with how long they are displayed (transiently or permanently). A usability study showed that the techniques could be used efficiently to provide good workspace aware-ness in a simplified crisis management scenario, and provides insights regarding transition between displays in MDEs. Contributions of this paper are: (1) The adaptation of workspace techniques for MDEs, (2) An evaluation of the usability of these techniques in combination.
RELATED WORK
MDEs have been used in collaborative contexts like meetings [23, 24, 33, 53], scientific collaboration [64], collaborative creative work [55], and urban design [41]. Such environments are well suited for mixed-focus collaboration [28], where col-leagues transition often between loose and close collaboration. Compared to setups that include only individual displays, MDEs that include at least one large shared display have been shown to: provide better workspace awareness [61], allow for a more comfortable sharing of data [60], and to encourage people to collaborate closely more often [9]. Thus the impact of MDEs on mixed-focus collaboration has been studied often for setups that include a large shared display, that is either horizontal(tabletop) or vertical (wall, whiteboard), combined with private devices or workstations.
When the shared display is horizontal, studies showed that the bigger the shared display, the harder it is to maintain good workspace awareness [65], and that up-close interaction im-prove workspace awareness; however, distant interaction pro-vides better support for parallel work [31]. When the shared display is vertical, studies showed [59] that if it replicates the shared workspace it is better for grounding close collabora-tion; but that if it shows only status information, it is better for overall monitoring. Based on these studies, in our prototype we choose to use a replicated display, i.e., a display that repli-cates a virtual workspace that is shared by all devices (albeit at different levels of detail), since this was shown to favor collab-oration. We also provide users with both distant and up-close interaction techniques, to support both close collaboration and loose or parallel work. Finally, as the size of the shared display is likely to hinder workspace awareness, this further motivates our awareness designs.
Crisis management is a good example of situation in which operators often switch between parallel and collaborative work [39]. Previous work has already investigated the use of MDEs in such situations. To improve the overall operation of sit-uation rooms, HCI researchers explored the use of several innovative surfaces. Chan et al. [12] developed an emergency operation center that combines a tabletop, a wall display and several tablets and wearable devices. They used proxemics cues to initiate data transfer between private and shared dis-plays. Similar set-ups have been presented by Butscher et al. who focused on the use of social media [10]; Kunz et al. who focused on the use of a tangible user interface for the tabletop [38]; Chokshi et al. with their prototype ePlan [16]; and Diaz et al. who integrated citizen-generated information on their prototype [18].
However, these setups did not focus on providing awareness to aid transitions between the different displays. In this pa-per, we decided to use a vertical setup, similar to the one used in current situation rooms, and we propose techniques specifically aimed at improving workspace awareness. In a similar vein, Bortolaso et al. looked at transitions in a military command and control context [8]. They proposed a simulation-based training prototype on a MDE, composed of a tabletop and several tablets [8]. They introduced different types of lenses on the tabletop and on the tablets, to support workspace
awareness in different collaborative configurations.Their study evaluated the lenses exclusively on the tabletop, and showed that participants used lenses for parallel work and direct in-teraction on the tabletop map for close collaboration. In this paper, we similarly support different types of collaboration; however, we use a vertical setup, and we focus on techniques to facilitate transitions between multiple devices.
We provide related work relevant to our individual designs within our technique descriptions.
MOTIVATING SCENARIO OF USE
To understand the different requirements for a MDE sys-tem that supports transitions between personal and shared workspaces, we are motivated by situations in which workspace awareness is important: crisis management rooms, where collaboration is considered critical [42]. Using exam-ples of crisis such as the derailment of a freight train in a tunnel in Baltimore [56], a helicopter crash in the center of London [4], and a flood of the Loire river in France [25], we draw design goals for such collaborative environments. G1: The environment should accommodate colleagues with different roles, and access to different information.
The response team in a situation room is composed of highly specialized operators from different agencies, who are each in charge of one aspect of the crisis management. The flood of the Loire crisis involved more than 23 agencies including police, fire brigades, first responders, public transportation, managers of water/power/communication/road networks, and flood forecasting services [25]. Each agency had their own tasks to perform (monitoring the road traffic, coordinating firefighters or first-responders, managing public transport, etc.). Other types of collaborative contexts, such as sense-making and brainstorming, can also group together individuals with different expertise [28].
G2: Colleagues should be able to share with others only data useful for the situation.
To deal with the complex situation at hand, during crisis man-agement operators need access to various data [39]. Here sharing role-specific data between operators is important. For example, during the Baltimore accident, a main water pipe broke at the location of the crisis and started flooding the area. Firefighters had to work with public-work administration offi-cials to see how to access the train in these conditions. Both agencies had their own data, but needed to share only the ones relevant to the crisis: for the firefighters, it was the position of their units on-site, and for the public-work it was the plan and information regarding the water network of the specific area of the city [56]. Access to role-specific data that are not relevant to the situation can confuse operators and alter their understanding of the situation [17]. A need to share only con-tent relevant to the collaboration can be present in any other collaborative environments that bring together colleagues with their own data.
G3: To serendipitously or actively seek out opportunities for collaboration, colleagues need a good mutual awareness of where others are working on, and on what.
In situation rooms, close collaboration on shared displays can be forced by the situation itself (e.g., first-responders and road-traffic operators work together to ensure ambulances avoid traffic jams). Or it can be serendipitously initiated by opera-tors when they see colleagues working in an area that interests them. For instance, we can imagine that if a first-response op-erator that sees a road-traffic opop-erator working on a zone close to a hospital key for the crisis, they may decide ask for more information. Due to the uncertainty of the situation, operators also often explore different strategies to try and stay ahead of the evolving situation [39], actively seeking out colleagues working on their area of interest to discuss their plans. For example, imagine that weather reports indicate that areas next to the hospital may be flooded soon, the first-response opera-tor may actively seek the road-traffic operaopera-tor responsible for that area to discuss re-routing alternatives. To initiate such collaborations, each operator needs to be aware of what others are currently working on, and where. This can be particularly challenging, as agencies and operators may be introduced late into a situation room. All collaborative environments can benefit from workspace awareness to aid newcomers assess the situation, to help serendipitous identification of collabo-ration opportunities, and aid the transition from personal to collaborative work.
G4: Colleagues need to have a good awareness of past activities, both in specific areas, or by specific colleagues. When colleagues work concurrently in different sub-tasks they partially loose awareness of others [27]. So when they want to transition to a closer collaboration, they may need some contextual information about the recent work and focus of their colleagues. For example, during the Loire flood, an operator of the power company needed to guide her team to a damaged power unit [25]. We could imagine, that if she had seen that traffic operators worked recently in her area of interest, she could have approach them directly to coordinate the best route for her team to take. A trace of recent activity of a specific colleague (not just in a specific area) can also be important. For example, if the power-company operator knew that the first-responder operator had been focused on one specific area since the beginning of the crisis, she could plan a path to damaged units that does not interfere with this area. Understanding others’ past activities can be useful in any long duration collaborative situation.
TECHNIQUES FOR WORKSPACE AWARENESS
Inspired by our motivating scenario of use, we wanted to en-sure that the awareness techniques do not disturb colleagues and don’t hide important information seen on the shared col-laborative display. Disturbance is accepted and reserved for important alarms that require immediate attention from opera-tors. Our designs follow these constraints.
Awareness Bars: Persistent Real-Time Awareness
Operators need good awareness of the work of others (G3). More precisely, they need to know who is working on which part of the workspace at any time (workspace awareness [29]). As it is unclear when exactly they will need this awareness information, it has to be persistent in time (always visible).
Related Work
Workspace awareness was first studied for collaborative docu-ment editing in distributed environdocu-ments [19]. It introduced the concept of shared feedback of users’ activities in the shared workspace. For example, early work showed the cursor and and text selections of all users in the shared workspace [19], and later their pointer (telepointers) [28]. These techniques can be problematic in multi-scale environments, as users can be focused on different areas of the workspace and thus not be able to see each other’s cursor or pointer.
Follow-up work on multi-scale environments [28] proposed radar views, small simplified maps of the workspace, that displayed telepointers and rectangles representing users’ view-ports. Others [30] suggested multi-user scrollbars as aware-ness widgets: additionally to their own scrollbar, users could also see on their screen the position of others’ scrollbars. These techniques highlight areas of the workspace others are focused on, and help identify users working on the same area. In summary, to enhance workspace awareness in distributed en-vironments, past work provided feedback of the location where others are focusing and interacting. This shared feedback can be displayed: directly on the shared workspace (e.g., telepoint-ers), at the edge of the screen (e.g., multi-user scrollbars), or on other dedicated areas of the screen (e.g., minimaps).
Design Choices and Technique Details
Our setup differs from the distributed ones presented above. It is composed of several workstations (which can be considered as distributed) and a shared, high-resolution wall display. Design Choices. Workstations are dedicated to role-specific tasks of the users, which can be cognitively demanding (e.g., guiding units onsite in a hazardous environment). Displaying additional information about others’ activities (e.g., telepoint-ers, multi-user scrollbars) can clutter the screen and attract the operator’s attention needlessly. Because of their size and the fact that shared displays often provide a view of the entire shared workspace (e.g., map of Paris), the shared wall makes a good alternative to display awareness information (requir-ing operators to split their focus occasionally). Nevertheless, telepointers on the wall display are difficult to spot due to their small size [34], a situation that becomes even more chal-lenging if a high number of operators are present in the room. And telepointers highlight a single point, making it hard to determine the larger areas operators are focusing on.
Minimaps on workspaces can restrict awareness information to a specific area of the screen, and users can avoid distractions by choosing to only look at it when needed. However, minimaps may not scale well with a high number of collaborators and a large workspace size. As an alternate, we tried displaying the viewport of each workstation directly on the shared wall, using colored rectangles (as it is done in minimaps). We observed that when more than four operators are working on the same area, it becomes hard to understand exactly where each of them is working, and the screen quickly becomes cluttered. Large rectangles (zoomed-out viewports) are also difficult to see as their borders are at the edges of the screen.
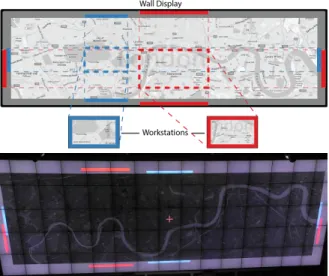
Figure 2. Awareness bars. (Top) The colored bars on the border of the wall represent the areas on which each operator is focused on on their workstation. The dashed lines are added for illustration purpose. (Bottom) Awareness bars of three operators, rectangles at the middle of the screen are Data-lenses.
Technique Details. Inspired by multi-user scrollbars [30], we displayed the same information (size and position of worksta-tions’ viewport) in the form of bars at the edges of the wall display (Figure 2). Thus, the awareness indicators are visible without cluttering the screen. The x-position of the bars at the top and bottom of the wall display represent the x-location of the viewport (similarly for the y-position on the left and right of the wall). The bar color matches the color attributed to the operator. When operators pan and zoom in their workstation, their bars move and scale accordingly.
For the bars on the top/bottom (and left/right) we initially also mapped their y position (and x position respectively) to the y location of the viewport. This way each edge could give information about both viewport dimensions. But when several operators were working at the same area, the bars overlapped often causing confusion. We thus gave a fixed y-position to bars at the top/bottom edges (and a fixed x-y-position for the right/left ones). Thus, the bars are stacked always in the same order and it is easy to distinguish between operators. Using bands, operators can see when others are working on the same area, as their bars will occupy the same x and y position. This information is visible both when operators are seated at their workstation (top edge), and when standing in front of the wall (bottom edge). Bands can support a large number of operators as long as the colors assigned are distinct. However, they only display information about operators working on the workstations, but not ones standing in front of the wall. As we can track the head position and orientation of a standing operator, we can determinate the area they were focusing on on the wall [46] and we attempted to display it using the same technique. But as we tend to move our head continuously, the continuous band movement became quickly disturbing. Given that the position of a standing user is already a good indication of their focus, we did not include this in our final prototype. Summary. Awareness bars are displayed permanently on the edges of the wall display, providing awareness of others’ focus
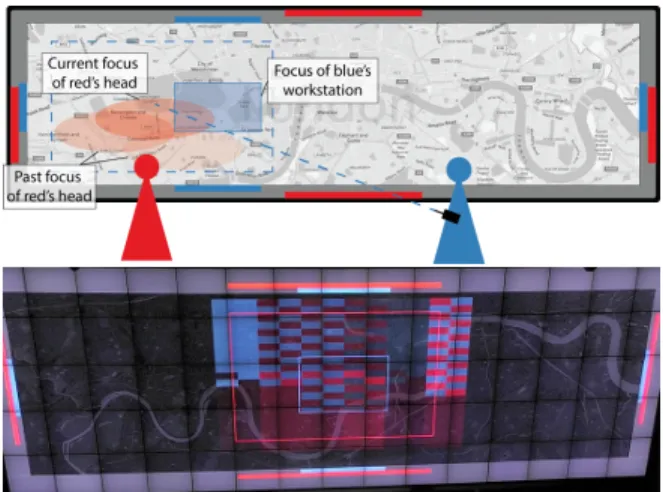
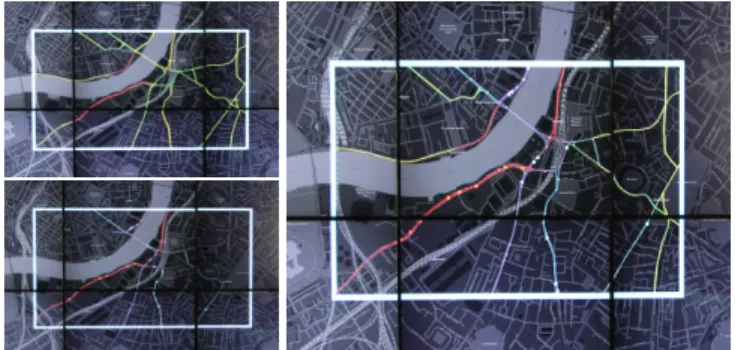
Figure 3. Global Focus Map on an operator. (Top) The red operator asks for a Focus Map for the blue operator by pointing at her with her tracked smartphone. The Focus Map for the blue operator is displayed for the entire workspace. (Bottom) A picture of a Focus Map for the blue operator on our wall display.
(G3). They consist of colored bars on the top/bottom edges of the wall (for the x-position and width of users’ viewport on their workstation), and on the left/right (for the viewport y-position and height).
Focus Map: Past & Current Focus Awareness On-demand
We also want operators to know the areas of past focus of others (G4). We first tried to address this by displaying a trace of the movement of each awareness bar, that would fade out over time. But because the space in which bars move is fairly constraint, the area soon became crowed and illegible.
Related Work
Awareness of past activities is supported in asynchronous or semi-synchronous collaborative systems, for example, the diff command in git shows differences between commits. Past work in collaborative editing has used colored marks in the margins to highlight text areas that had been changed [19], or animations to play them back [15]. These techniques au-tomatically highlight changes, but it is also possible to let users decide which changes are relevant to their activities, for instance by allowing them to add annotations [11].
In a complex MDE environment, where the virtual workspace can be large (e.g., a map), it can be difficult to keep track of each other’s activities, even in a synchronous system. One approach is to use a timeline that summarizes activities, a so-lution adopted for a complex collaborative game on a tabletop [13], and for scientific exploration of data on a shared dis-play [37]. Another, is Mnemonic Rendering [5], that stores changes and plays them back on demand, or summarizes and superimposes them on the interface in a semi-transparent layer.
Design Choices and Technique Details
Design Choices. We first considered visualizing all past ac-tions done by operators, nevertheless, their acac-tions are mostly role-specific, and so other operators are not always qualified to understand them. The area on which operators worked be-fore can be more important than the action itself, as operators spent considerable time monitoring the situation during which
Figure 4. Local Focus Map on a specific area. (Top) The blue operator asks for a focus map for a specific area (dashed rectangle) by selecting the area using a tracked smartphone. The history of focus of both oper-ators is displayed for this area. (Bottom) A picture of a focus map for a specific area on our wall display, with two operators’ colors interleaved. they don’t perform any actions [39]. Beyond seeing who has worked on their area of interest, in some situations it is impor-tant to also know where an operator hasn’t looked at yet (e.g., to see if they missed an important event). We thus decided to display the past areas of focus, and not individual actions. Whether to get a history of the situation in an area, or of the fo-cus of a specific colleague, the operators need this information at very specific points in time and they are generally actively looking for it. It is thus possible to display this information on demand and for a limited amount of time.
We show this information on the wall, as it displays the entire shared workspace. Moreover, even if a Focus Map is requested by one operator, it can be of interest to others. For example, operators may want to know that someone else is interested in their area and are requesting information.
Technique Details. We continuously record the focus of each operator, represented by the viewport of their workstation when seated, or the area they see when standing in front of the wall (calculated using their head position and orientation). The Focus Map shows a multi-colored heatmap of these areas on the wall. Color hue represents an operator and its saturation the amount of time spent at each area. When the focus of multiple operators overlaps, we display their colors interleaved. By default, the Focus Map is invoked for the entire wall and for all operators (Global Focus Map). But it is also possible to visualize the Focus Map of a specific operator for the entire workspace (Figure 3). Or visualize a Local Focus Map for only a specific area of the workspace (Figure 4). Selecting the specific area, or the specific operator respectively, can be done through the workstation or a tracked smartphone. After a fixed amount of time, the heatmap fades out of the wall display. The technique displays initially the entire logged history since the start of the system. Users can filter the time range they want to display, in order to focus on shorter time periods of interest. When they create a Focus Map, a range slider appears either on the smartphone or on the workstation (depending on the activation device) that the user can manipulate.
Figure 5. Step Map. (Top) The red and blue operators work in front of the wall. Their identity is confirmed by the colored circle around their feet. The fading red circles on the floor indicate that the red operator was previously closer to the blue one but moved recently to the left. (Bottom) Close-up of a Step Map trace.
Summary. Focus Maps provide workspace awareness of past actions (G4) on demand. A multi-colored heatmap overlays a history of the areas of focus of both seated and standing operators on the wall display. The time interval of the history can be adjusted using a range slider. The colors represent different operators, and their saturation the amount of time spent on each area. After a fixed amount of time the heatmap fades out. The technique can be activated for the entire wall, for a specific area, or for a specific operator. This activation can be done from a workstation or using a tracked smartphone.
Step Map: Transient Operator’s Identity Awareness
In a situation room, where multiple operators from different agencies are present, identifying their role is important (G1), especially for operators that are brought-in later in the crisis. Pre-assigning colors to different roles /agencies can help in this case. For seated operators, this can be done by labeling their workstations with their color, as workstation are often pre-assigned. Nevertheless, it can be challenging to identify the role of standing operators, and to associate the operator with a color (indicating a role) displayed on the wall.
Related Work
We are inspired by past work that tracks users in front of a wall display. The tracked position has been used to initiate proxemics interaction [26]; to follow the user using an array of cameras to stream their video remotely [1]; or to create low [36] or high fidelity [66] representations of the users on the wall. In our case, superimposing users information on the wall could clutter the shared screen. Instead, as it is done in recent work on public settings [43], we consider using the floor of the crisis room as a peripheral display to enhance awareness.
Design Choices and Technique Details
Information on the operator’s role (G1) in our case needs to be persistent to accommodate late-comers in the room. Thus it cannot be superimposed with the main scene that contains important information for the crisis, and can disturb other operators. The peripheral nature of the floor makes it a good candidate to avoid disturbing operators, while at the same time it links directly visual information to the standing users.
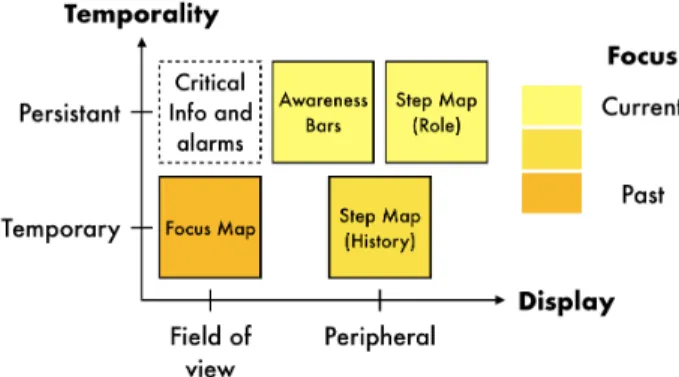
Figure 6. Summary of the workspace awareness techniques.
Our technique consists of drawing a colored circle around the operator’s feet, using the color associated to their role (Figure 5). It also leaves a trace of the past positions of the user, as a means to provide awareness of their past focus (G4). Nevertheless, to avoid cluttering the floor with colors, this trace fades away with time (fade-out time is customizable). Step Map is activated when an operator stands up in and goes in front of the wall.
Summary. Step Map provides awareness regarding operators’ roles and a short history of their position in front of the wall display (G1 and G4), by leaving a colored trace on the floor.
Summary
To sum up, we designed three techniques to visualize workspace awareness information:
• Awareness Bars, which show the current focus of worksta-tions on the edge of the wall display.
• Focus Maps, which show the history of the focus (of seated and walking operators) on the wall display, activated on demand and fading over time.
• Step Map, which permanently follows standing operators, but also shows a temporary short history of the position of operators standing in front of the wall.
Each of them answers to a specific goal, and thus, is either temporary or permanently displayed, on the main shared dis-play or on the periphery (Figure 6). The three techniques work in harmony together as they occupy different spatial locations, starting from the periphery (floor: Step Map), to the periphery of the shared surface (edges: Awareness Bar), to the center of the shared surface (Focus Map). Depending on their location, they can be permanent (periphery: Awareness Map), or acti-vated on demand and transient (center of shared surface: Focus Map). Permanent awareness information provides continuous indications of other colleagues’ focus on the shared workspace (Awareness Bars), whereas transient awareness information, triggered on demand, provides more details about past posi-tion or focus of colleagues that can be standing on working on their workstation respectively (Step Map and Focus Map). We make sure to not permanently display any information on the central part of the main display, as it is used for critical information and alarms.
PROTOTYPE
To illustrate our techniques we implemented them within a broader prototype of a crisis management system that we developed. The prototype runs on a multi-display environment (Figure 1), that includes: (i) a high-resolution wall-display made up of 75 LCD screens (in total 5.9m × 1.96m wide, with a resolution of 14 400 × 4800 pixels), driven by a computer cluster and overlaid with a PQ Labs layer for multi-touch detection; (ii) three workstations; (iii) two mounted projectors for displaying operators’ moving traces; (iv) several mobile devices; and (iv) a VICON motion tracking system for tracking operators and devices.
The prototype is developed in Java using the ZUIST Cluster library [44], which allows it to run seamlessly on the desktop workstations and the visualization wall. On the workstations, operators interact using mice and keyboards. On the wall, they can interact directly using touch; or indirectly using mobile devices connected to the prototype via the Smarties toolkit [14], whose position and orientation is tracked.
Modeling a crisis scenario, with role-specific data
The basis of the visualizations on both workstations and the wall is a tiled map. On their workstations, operators can focus on a part of the map through pan and zoom. The shared wall shows a zoomed-out view of the entire map that is of fixed scale, similarly to what is done in actual control rooms. Role-Specific Data. Our prototype reads a graphml file of the road network of the crisis area (London in the examples seen in the paper) extracted from OpenStreetMap [7]. Inspired by the helicopter crash in London [4], it manages three types of role specific data. If streamed traffic data are available, they can directly be used to feed the network. Else traffic forecasting can be simulated using a macroscopic Lighthill-Whitman-Richards model [40] (also used in [45]). The traffic density is then represented on the road network using a three-color scale (green, yellow, red). Our prototype can also extract public transportnetworks from CSV files provided by public transport companies. Circulation of buses is then simulated using the timetable and traffic density. The paths of individual bus lines have a predefined color and buses are represented as small colored squares moving on them. Finally, the prototype extracts the position of essential first response buildings from OpenStreetMap (hospitals, fire stations, etc.) and displays them with a red-cross glyph. First responders’ activities can then be simulated using these buildings, for example the in-tervention of first responce vehicles. Similarly to buses, their speed is impacted by traffic density.
By default, the role-specific data are only displayed on the workstation of the appropriate operator. Nevertheless, parts of them can be displayed on the wall on-demand, using data-lenses (Section 5.2).
Data Vis and Transfer between Workstations & Wall
In our prototype colleagues (operators) view their own, role-specific, data on their workstation. We decided to not display everyone’s role-specific data on the shared wall in a permanent way, colleagues are not always qualified to understand each other’s data. Moreover, it would lead to visual clutter that
Figure 7. Data-Lenses. (Left) Data-lens with traffic data on top, and with public transportation data (network + buses position) on bottom. (Right) both traffic data and public transportation data superimposed.
can then provoke information overload, change blindness, and even hinder visual search [63]. Nevertheless, after identifying opportunities for collaboration using the awareness techniques, colleagues may need to transfer their data from their worksta-tion to the shared wall, when they plan to work closely with other operators (G2). They should be able to choose when and on which part of the wall they want to transfer their data. Users can perform data transfers using either handheld devices, that can be considered as proxies that carry the data while the user is moving [51, 58]; or virtual cursors on their personal workstation [48]. Studies comparing transfer types showed that proxy-based techniques were more efficient and required less physical effort compared to virtual portals, but were more difficult to use, partly because they lacked feedback [2, 49, 50]. Our users can chose the transfer mode that meets their needs.
In our context, each transfer creates on the shared display a magic-lens containing role-specific data. These lenses can be created from any workstation, or directly in front of the shared display using a handheld device. The lens is active only on a specific area so as not to clutter the entire display. For example, a road traffic operator can overlay traffic density information over a set of roads on the wall display. We call this type of lens Data-lens in the rest of the paper. Previous work has controlled lenses that overlay data on a wall display by matching a moving user’s position (and shape) [36]; or using handheld devices [14]. We allow both types of control: using the operator’s position and a handheld device.
A Data-lens on the wall belongs to the operator who created it; only this operator can manipulate it, and when she moves away from it, it slowly fades out so as to not clutter the wall. The creator of the lens has access to a menu by clicking on the lens, that allows them to: (i) destroy the lens; (ii) turn on/off the "Follow me" mode, so the lens follows the operator when she moves in front of the wall; (iii) turn on/off the "Pin it" mode, so the lens does not fade away when the operator leaves the wall (this mode is automatically activated when a lens is created from a workstation); (iv) change permission, allowing another operator to manipulate the lens.
Finally, it is possible for multiple operators to stack several data-lenses [35] in the same area of the shared display, in order to combine their different role-specific data.
Figure 8. Interaction with the wall using a tracked smartphone. (Left) After validating the size of the dashed rectangle, the operator can choose between creating a Data-lens or asking for a Focus Map for this area. (Right) Interface of the tracked smartphone.
Interaction
Two kinds of interactions can activate the techniques described in the previous section: ones that act on the data and are role-specific; and ones for general system control, available to all users that want to interact with the shared display wall.
Role-Specific Interaction on Data
Role-specific interactions are accessible through menus that can be invoked by a long press if the operator is standing in front of the wall, or right mouse click on the workstation. Each operator can do specific actions that have an impact on the situation. The road traffic operator can adapt speed limits, close roads or lanes, and change traffic light durations. The public transportation operator can reroute buses, either to a specific location or direct them to a station. First responders can direct their vehicles in the city.
Activation of Data-lenses and Focus Maps on the Wall Display
Users first chose to display a cursor on the wall, that will be then used to determine the position of the Data-lens or Focus Map. This cursor can be controlled either: from their desktop (in a "wall mode") when operators are seated; using touch when operators are in-front of the wall; or using tracked smartphones that can act as laser pointers when operators are moving in the room.
A click brings-up a dashed colored rectangle on the wall, at the cursor position. This rectangle will determine the area of the Data-lens or Focus Map respectively. The original rectangle size depends on the area of focus of the workstation (if triggered from a workstation), or on the distance of the user from the wall (if she is standing, triggered either by touching the wall or a mobile device). The rectangle can be dragged, and its size can be changed using the mouse wheel on the desktop, a pinch gesture when touching the wall, or by a specific button on mobiles. When the user clicks a second time, she validates the size and position of the rectangle (a click outside of the rectangle will remove it). A pie-menu appears and the user can decide to create a Data-lens with their role-specific data, or request a Focus Map to see others’ activities for this area. Alternatively, users can point at another user using the tracked smartphone, or select another operator in the menu on their workstation. At this point a pie-menu will be displayed with the choice to display the Focus Map of just that operator.
USER STUDY
The three awareness techniques presented in this paper are inspired by previous work, but have not been combined before in a single setup nor evaluated as a group. Thus we decided to
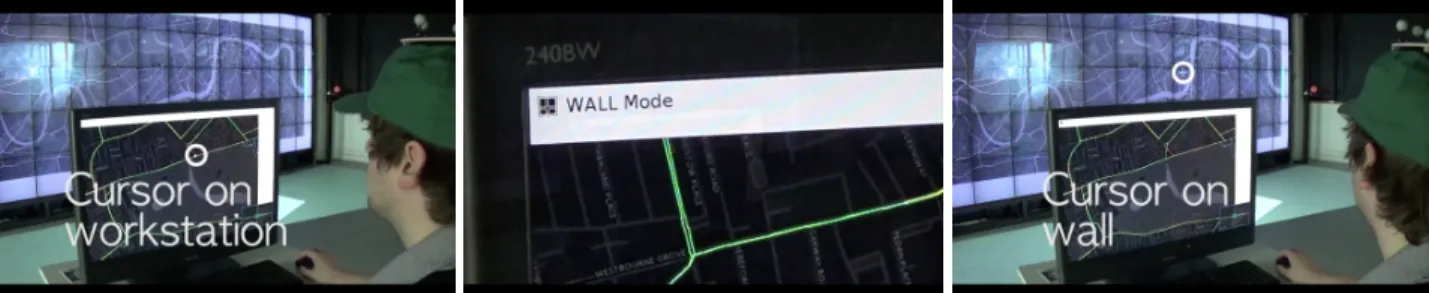
Figure 9. Interaction with the wall using the mouse of the workstation. (Left) The operator interacts with the workstation using the mouse. (Middle) By clicking on the checkbox "Wall Mode" at the top-left of the display, the operator activates the "Wall Mode". (Right) In the "Wall Mode" the operator interacts directly with the wall using the mouse of the workstation.
assess if they are usable in our context: mixed focus collabo-ration, using a simplified crisis management scenario, using a wall display and several workstations. We defined three tasks which, to be completed, require the use of at least one of the techniques. For each task, we observed if participants succeed in the task and how they used the techniques.
Study Design
Participants and Apparatus
We recruited 8 participants (3 females, 5 males), aged 23 to 41 (average 31), with normal or corrected-to-normal vision. Participants were HCI and visualization researchers or gradu-ate students, and most of them had already used a wall display (6/8). We used the apparatus described in the Prototype sec-tion. As our tasks do not require domain-specific knowledge, we did not test them with real highly-trained crisis manage-ment operators. A similar approach has also been taken by previous work motivated by real-world contexts [31, 32, 45].
Scenario and Tasks
We designed three scenario tasks based on the Vauxhall heli-copter crash in London [4]. In each scenario, a map of London was displayed on the wall display and workstations, and spe-cific datasets were overlaid: simulated road traffic, hospital locations, and buses routes.
Task 1was designed to assess if our techniques allowed par-ticipants to get current (G3) and past (G4) awareness of other operators’ focus. A small scenario introduced the task. The participant was told they would take the role of a road-traffic controller called in a crisis room to manage a massive accident in London. It was explained that two (fictitious) operators were already present in the control room, dealing with the situation, but not available to give a briefing. The participant was asked to first find out, using any technique, on which area she should focus now (i.e., the current area of the crisis). And to then identify possible secondary areas of interest, i.e., other locations that may have been affected by the crisis.
The first part of this task could be done only using Awareness Bars; using Step Map and Focus Map could help confirm the answer. To answer the second part, participants needed to get a broader view of the history of activities. Here Step Map could give first insight, but Focus Map was required to get the precise answer. Task 1 could be done either from the workstation, in front of the wall, or both.
Task 2was designed to assess if our techniques allowed partici-pants to access specific data related to their role (G1) and share
them with others (G2). The participant had again the role of a road traffic controller. They were asked to collaborate with the first responder dispatcher to find the best-suited hospital to evacuate casualties and decide together on a route. Three hospitals were available at different distances and on roads with different traffic. An experimenter impersonated the first responders’ dispatcher. Here participants needed to create a Data-lenseswith their data, either from the workstation or using a smartphone.
Task 3was designed to assess if our techniques helped partic-ipants be aware of the current focus of other operators (G3) while performing their own tasks. Participants were required to stay sit at their workstation, and could not alter the display’s zoom level. A blue line was displayed on the workstation screen, and the participants were required to follow it by pan-ning. In parallel, an experimenter was following a different path on another workstation. Four times during the task, the participants’s screen was frozen without warning, and they were asked whether they were focusing on the same area as the experimenter or not. For the first two times that the participants was interrupted with the awareness question the Awareness Barswere visible. However, for the last two, the awareness bars disappeared from the wall when the question was asked, and reappeared after the participants answered. The second set of questions allowed us to check if participants could follow Awareness Barswhile doing another task on the workstation.
Procedure
Participants started by filling a consent form and a demo-graphic questionnaire. They then followed a twenty minutes training session, practicing all the techniques. Next, they completed the three tasks in sequence. After each task, they filled-in a questionnaire on their strategy, what techniques they used, and how the techniques could be improved. At the very end, participants were asked to answer a System Usability Scale (SUS) questionnaire regarding the system. Overall, the study lasted approximately 50 minutes.
Measures
During the study, we collected observational notes, computer logs of participants’ interactions with the wall display and their workstation, and audio and video recordings. Each post-task questionnaire included open questions regarding strategy and the techniques used, and a 7-points Likert-scale regarding the difficulty of the task. The post-study questionnaire consisted of a SUS and an open question for other comments.
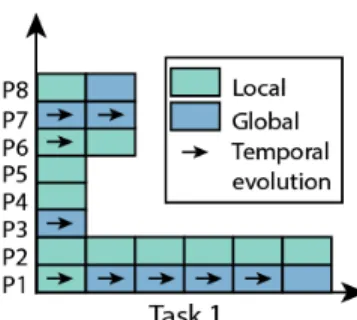
Figure 10. Usage of the Focus Map technique by each participant. Color is used to discriminate between Global (for the entire wall) and Local (for a selected area) Focus Map. Arrows indicate when the participant explored the temporal evolution of the focus.
Results
We present next the results for each task. We report first the strategies described by participants, followed by statistics on the use of Focus Map, and Data-lenses and finally video coded observations on the participants position in the space (in front of the wall or seated at their workstation).
Task 1
Participants performed Task 1 on average in 4 min and 57 sec (SD: 1 min 17 sec). All participants succeed in finding the first area of interest, and 7/8 the second one. The task was considered reasonably easy (Average easiness: 5.6/7, SD: 0.5). To find the first area, 2/8 reported using Step Map and Aware-ness Bars, 3/8 reported using Step Map but not AwareAware-ness Bars, 2/8 reported using Awareness Bars but not Step Map, and 1/8 reported using a Local Focus Map, to find the first area. A Local Focus Map was used by 3/8 to confirm their findings, and 1/8 used a Global Focus Map for the same purpose. To find the second area, 4/8 used Step Map. Of these 4, 1 confirmed their answer using Local Focus Map and 1 using Global Focus Map. Of the other 4/8, 3 used Global Focus Map to find the secondary area, and 1 used Local Focus Map. The participant who didn’t find the good secondary area candidate used only Step Map.
Interaction logs revealed that, contrary to participants’ ques-tionnaires, all participants used at least once Focus Map (Fig-ure 10). This may indicate that some didn’t find it useful for this task. On average, participants created 2.6 Focus Maps (a number skewed due to 2 participants who created 6 Focus Maps, the rest used only 1 or 2 Focus Maps).
Most participants (6/8) started by using a Local Focus Map, and two switched to a Global one later. On the contrary, the 2 participants who started with a Global Focus Map didn’t change. Temporal evolution was explored by 2 using a Lo-cal Focus Map, and 3 participants using Global (with one participant making extensive use of the feature).
Finally, the video coding showed that 7/8 participants started the task in front of the wall, and only 2 of them went to the workstation after that. The participant who started at the workstation went in front of the wall mid-way during the task.
Task 2
Participants performed this task on average in 3 min and 4 sec (SD: 50 sec). All succeeded in finding the best hospital (close enough and with routes with less traffic jam). The task was considered reasonably easy (Average easiness: 5.5/7, SD: 1). Strategies describe by participants were mostly straightfor-ward: create the Data-lens and discuss with the other operator. Interaction logs showed that 7/8 participants created the Data-lensesfrom their workstation and then went in front of the wall. 3/8 participants had to resize the Data-lenses and did so when in front of the wall. As a side note, only 2/8 took the smartphone before going in front of the wall.
Task 3
Participants performed this task on average in 3 min and 39 sec (SD: 1 min 09 sec). All participants succeeded in answering correctly to all 4 questions. The task was considered moder-ately easy (Average easiness: 4.4/7, SD: 1.3). This score is mostly due to the third and fourth questions which was consid-ered harder, since participants had to follow what happened on the wall while doing a task on the workstation.
For this task, we didn’t envision the use of techniques other than Awareness Bars. However, videos showed that 4/8 par-ticipants used Focus Map with temporal evolution to find or confirm their answer.
Other Subjective Comments
Participants gave an average SUS score of 78.4/100 (SD: 12.3) to the system. According to Bangor et al. [3], this score means that our system is ranked between good and excellent by users. Regarding the techniques, participants (4/8) said that Step Mapwas very good to get a quick first impression of the ac-tivity (5/8). Few participants (3/8) thought that time should be better encoded, as it seems the levels of transparency used were not always easy to tell apart. Participants (5/8) found that Awareness Bars also gave a good first impression of the activity, and that it was easy to use and useful to see when two viewports intersect. However, one participant worried about the cognitive load as you need to draw rectangles in your head to find the viewport’s location. About Focus Map, participants (4/8) though it provides a good overview of the situation, how-ever, a few (2/8) reported that it could be confusing because of the different colors. No problem was reported regarding Data-lenses.
Summary and Discussion
Overall, participants succeed in using the different techniques to perform the tasks and considered our system as usable. They made use of different (often unexpected) combinations of techniques for finding and verifying their answers, indicating that the exact technique to use may be a matter of preference. This study provided us with interesting observations regarding users’ behavior in a collaborative multi-displays environment: Participants need different levels of confirmation before vali-dating their answer.We observed two groups of participants. The first used only one technique to find the answer to the task. The second used several techniques, one to find the answer
and the others to confirm it. We mainly observed this behavior in Task 1, with participants who used three or four Focus Maps to confirm their answer. We observed it to a lesser degree in Task 3, where participants used Focus Map to confirm their answer. Such strategies are known in decision-making as satis-ficingand maximizing [52]. The first one consists in choosing a solution that is good enough, the second in making sure that the chosen solution is the one with the highest expected utility. The use of a satisfying strategy can be beneficial as it could save cognitive load. However, it may not be an acceptable strategy in situations like crisis management. Complex sys-tems like ours should make sure that an acceptable level of confidence can be reached without too much effort.
Participants tend to look for local information first. Partic-ipants preferred invoking Local Focus Maps first instead of Global ones. This result is surprising considering that using a global Focus Map required less interaction (just pressing one button) and it ensures that the user won’t miss any information. One reason could be that participants feared that displaying the multiple colors on the entire wall display would be visually heavy and potentially disturbing (information overload [22]). They often chose to display it globally after familiarizing them-selves with the data on a local scale. It is thus important to provide users with the possibility to have both local and global techniques to visualize information.
An interesting future research direction would be to examine how to progressively transition from local to global awareness visualizations, in order to help users adapt to the amount of displayed information.
Participants use the closest display first to interact.For Task 1 and 2, participants could start the task either at the workstation or in front of the wall. All the information could be accessed from both, and all actions could be done from both. However in Task 1, 7/8 participants started in front of the wall, and in Task 2, 7/8 started from the workstation. In both tasks, they started the task in the position they were already in. For exam-ple, for Task 1, to better immerse the participant in their role of an operator arriving in the crisis room, we asked them to leave the room after the training and to come in 2 minutes after. Thus, participants were standing up when they were explained the task scenario, and most of them stayed up during the task. Before Task 2, participants were sat at the workstation to fill the post-task questionnaire, and most of them stayed at the workstation during the task.
However, it is worth noting that when discussion was nec-essary to make a decision during Task 2, all the participants went in front of the wall. It would be interesting to investigate when and why people use one display over another, and how to encourage them to use a specific one depending on their benefits. Here, the distance between the participants’ origi-nal position and the display seemed to have an influence, but future research is needed.
There is a need for quantitative measures of workspace aware-ness. This comes not from observations of our participants, but rather from the design of the Task 3 itself. The aim of our techniques is to improve workspace awareness. However, there are no standardized tests to assess group awareness. Task
3 was our attempt to design such a task, in order to evaluate if a participant knew the current focus of another operator at any given time. Our task was inspired by the Situation Awareness Global Assessment Technique (SAGAT) [21] and the Situation Present Assessment Method (SPAM) [20] which are tests de-signed to evaluate Situation Awareness. The main difference between the two is that in the SAGAT test, the context of the task is hidden when the participant is answering a question, while it is not the case in the SPAM test. In the first part of Task 3, the Awareness Bars were still visible when the questions was asked (Similarly to SPAM), while they were not visible in the second part (Similarly to SAGAT). Participants reported a high workload in the second part because they needed to follow the bars while doing the path following task.
Our task is a step in that direction, however more work is needed to generalize tasks that can be used to measure group awareness in broader contexts. Future work needs to con-sider standardizing tasks and questionnaires to assess group awareness.
The use of interleaved colors in Focus Map was reported as confusing by a few participants. This interleaving cannot scale to high number of people, especially since it would require the use of a large number of different colors. Using colored overlays for Focus Map can aid visual scanning [62]. Nevertheless, it also raises questions for future work, regarding the best color choices to aid color identification and avoid color blindness in particular due to potential color distortions related to the different possible viewing distances and angles [54, 6] that users can adopt in front of the wall.
CONCLUSION
We propose interaction techniques to enhance workspace awareness in a Multi-Display Environment composed of a wall display and several workstations. The three interaction techniques (Awareness Bars, Focus Map, and Step Map) help identify and perform opportunities to transitions between per-sonal and shared workspaces. They provide information about operators’ activities (current and past focus), and can display this information on-demand and for a limited time on the wall (Focus Map), or permanently at the periphery of the wall (Awareness Bars and Step Map).
We evaluated the techniques in a usability study which showed that participants used different combinations of techniques to perform their tasks, and found the techniques useful and easy to use. The study also opens interesting direction for future work in MDEs, such as studying how to increasingly reveal information to avoid information overload, and whether users’ starting position affects their choice of display to use. It also opens the discussion about the need for standardized instruments and tasks to measure workspace awareness. We started by evaluating the usability of our techniques in a lab setting. We next plan to run longer term evaluations in a challenging real-world context, crisis management, that motivated our technique designs. We plan to first introduce our techniques in training or simulation settings, as introducing novel techniques in such environments remains extremely challenging due to their critical nature.
REFERENCES
1. Ignacio Avellino, Cédric Fleury, Wendy E. Mackay, and Michel Beaudouin-Lafon. 2017. Camray: Camera arrays support remote collaboration on wall-sized displays. In Proceedings of the 2017 CHI Conference on Human Factors in Computing Systems (CHI ’17). ACM, 6718–6729.10.1145/3025453.3025604
2. Stefan Bachl, Martin Tomitsch, Karin Kappel, and Thomas Grechenig. 2011. The Effects of Personal Displays and Transfer Techniques on Collaboration Strategies in Multi-touch Based Multi-Display Environments. Springer Berlin Heidelberg, Berlin, Heidelberg, 373–390.10.1007/978-3-642-23765-2_26
3. Aaron Bangor, Philip Kortum, and James Miller. 2009. Determining what individual sus scores mean: Adding an adjective rating scale. J. Usability Studies 4, 3, 114–123.
http:
//dl.acm.org/citation.cfm?id=2835587.2835589
4. BBC. The route masters: Running london’s roads: Gridlock. https://vimeo.com/137839650. Accessed: 2017-01-17.
5. Anastasia Bezerianos, Pierre Dragicevic, and Ravin Balakrishnan. 2006. Mnemonic rendering: An image-based approach for exposing hidden changes in dynamic displays. In Proceedings of the 19th Annual ACM Symposium on User Interface Software and Technology (UIST ’06). ACM, 159–168.
10.1145/1166253.1166279
6. Anastasia Bezerianos, Petra Isenberg, Olivier Chapuis, and Wesley Willett. 2013. Perceptual Affordances of Wall-Sized Displays for Visualization Applications: Color. In Proceedings of the CHI Workshop on
Interactive, Ultra-High-Resolution Displays (PowerWall).
https://hal.inria.fr/hal-00799486
7. Geoff Boeing. OSMnx: Python for street networks. Retrieved April 2017 fromhttp://geoffboeing.com/ 2016/11/osmnx-python-street-networks/
8. Christophe Bortolaso, Matthew Oskamp, Greg Phillips, Carl Gutwin, and T.C. Nicholas Graham. 2014. The effect of view techniques on collaboration and awareness in tabletop map-based tasks. In Proceedings of the Ninth ACM International Conference on Interactive Tabletops and Surfaces (ITS ’14). ACM, 79–88.10.1145/2669485.2669504
9. Frederik Brudy, Joshua Kevin Budiman, Steven Houben, and Nicolai Marquardt. 2018. Investigating the role of an overview device in multi-device collaboration. In Proceedings of the 2018 CHI Conference on Human Factors in Computing Systems (CHI ’18). ACM, Article 300, 13 pages.10.1145/3173574.3173874
10. Simon Butscher, Jens Müller, Andreas Weiler, Roman Rädle, Harald Reiterer, and Marc H. Scholl. 2013. Multi-user twitter analysis for crisis room environments. In Collaborative Human-Computer Interaction with Big Wall Displays (BigWallHCI ’13). Publications Office of the European Union, 28–34.10.2788/50183
11. J. J. Cadiz, Anop Gupta, and Jonathan Grudin. 2000. Using web annotations for asynchronous collaboration around documents. In Proceedings of the 2000 ACM Conference on Computer Supported Cooperative Work (CSCW ’00). ACM, 309–318.10.1145/358916.359002
12. Edwin Chan, Craig Anslow, Teddy Seyed, and Frank Maurer. 2016. Envisioning the Emergency Operations Centre of the Future. Springer, Cham, 349–372.
10.1007/978-3-319-45853-3_15
13. Y.-L. Betty Chang, Stacey D. Scott, and Mark Hancock. 2016. Usage of interactive event timelines in collaborative digital tabletops involving automation. In Collaboration Meets Interactive Spaces, Craig Anslow, Pedro Campos, and Joaquim Jorge (Eds.). Springer International Publishing, Cham, 203–232.10.1007/978-3-319-45853-3_10
14. Olivier Chapuis, Anastasia Bezerianos, and Stelios Frantzeskakis. 2014. Smarties: An input system for wall display development. In Proceedings of the 32nd international conference on Human factors in computing systems (CHI ’14). ACM, 2763–2772.
10.1145/2556288.2556956
15. Fanny Chevalier, Pierre Dragicevic, Anastasia Bezerianos, and Jean-Daniel Fekete. 2010. Using text animated transitions to support navigation in document histories. In Proceedings of the SIGCHI Conference on Human Factors in Computing Systems (CHI ’10). ACM, 683–692.10.1145/1753326.1753427
16. Apoorve Chokshi, Teddy Seyed, Francisco
Marinho Rodrigues, and Frank Maurer. 2014. ePlan multi-surface: A multi-surface environment for
emergency response planning exercises. In Proceedings of the Ninth ACM International Conference on
Interactive Tabletops and Surfaces (ITS ’14). ACM, 219–228.10.1145/2669485.2669520
17. Sharolyn Converse. 1993. Shared mental models in expert team decision making. In Individual and group decision making: Current issues, Jr. N. J. Castellan (Ed.). Hillsdale, 221–246.https:
//www.taylorfrancis.com/books/9781134767908
18. Paloma Diaz, Teresa Onorati, and Sergio del Olmo Pueblas. 2016. Analyzing and visualizing
emergency information in a multi device environment. In Proceedings of Information Systems for Crisis Response and Management in Mediterranean Countries
(ISCRAM-med ’16). Springer, 181–194.
10.1007/978-3-319-47093-1_16
19. Paul Dourish and Victoria Bellotti. 1992. Awareness and coordination in shared workspaces. In Proceedings of the 1992 ACM Conference on Computer-supported
Cooperative Work (CSCW ’92). ACM, 107–114.
10.1145/143457.143468
20. Frank T. Durso, Andrew R. Dattel, S. Banbury, and S. Tremblay. 2004. SPAM: The real-time assessment of SA. A cognitive approach to situation awareness: Theory and application1, 137–154.
21. Mica R Endsley. 2000. Direct measurement of situation awareness: Validity and use of SAGAT. In Situation awareness analysis and measurement, D. J. Garland M. R. Endsley (Ed.). Mahwah, NJ: Lawrence Erlbaum Associates, Chapter 7, 147–173.
22. Martin J. Eppler and Jeanne Mengis. 2004. The concept of information overload: A review of literature from organization science, accounting, marketing, mis, and related disciplines. The Information Society 20, 5, 325–344.10.1080/01972240490507974
23. K. Everitt, Chia Shen, K. Ryall, and C. Forlines. 2006. Multispace: enabling electronic document micro-mobility in table-centric, multi-device environments. In First IEEE International Workshop on Horizontal Interactive Human-Computer Systems (TABLETOP ’06). IEEE, 8 pages.10.1109/TABLETOP.2006.23
24. Andreas Rene Fender, Hrvoje Benko, and Andy Wilson. 2017. Meetalive: Room-scale omni-directional display system for multi-user content and control sharing. In Proceedings of the 2017 ACM International Conference on Interactive Surfaces and Spaces (ISS ’17). ACM, 106–115.10.1145/3132272.3134117
25. Audrey Fertier, Anne-Marie Barthe-Delanoë, Johan Manceau, Sébastien Truptil, and Frédérick Bénaben. 2015. Towards a support to stakeholders’ collaboration during a loire river major flooding. In Proceedings of Information Systems for Crisis Response and
Management in Mediterranean Countries (ISCRAM-med ’15). Springer, 183–193.10.1007/978-3-319-24399-3_16
26. Saul Greenberg, Nicolai Marquardt, Till Ballendat, Rob Diaz-Marino, and Miaosen Wang. 2011. Proxemic interactions: The new ubicomp? Interactions 18, 1, 42–50.10.1145/1897239.1897250
27. Carl Gutwin and Saul Greenberg. 1995. Support for group awareness in real-time desktop conferences. In Proceedings of The Second New Zealand Computer Science Research Students’ Conference. University of Calgary, 18–21.10.5072/PRISM/30764
28. Carl Gutwin and Saul Greenberg. 1998. Design for individuals, design for groups: Tradeoffs between power and workspace awareness. In Proceedings of the 1998 ACM Conference on Computer Supported Cooperative Work (CSCW ’98). ACM, 207–216.10.1145/289444.289495
29. Carl Gutwin and Saul Greenberg. 2002. A descriptive framework of workspace awareness for real-time groupware. Computer Supported Cooperative Work 11, 3, 411–446.10.1023/A:1021271517844
30. Carl Gutwin, Mark Roseman, and Saul Greenberg. 1996. A usability study of awareness widgets in a shared workspace groupware system. In Proceedings of the 1996 ACM Conference on Computer Supported Cooperative Work (CSCW ’96). ACM, 258–267.10.1145/240080.240298
31. Leila Homaeian, Nippun Goyal, James R. Wallace, and Stacey D. Scott. 2018. Group vs individual: Impact of
touch and tilt cross-device interactions on mixed-focus collaboration. In Proceedings of the 2018 CHI Conference on Human Factors in Computing Systems (CHI ’18). ACM, Article 73, 13 pages.
10.1145/3173574.3173647
32. Alexandra Ion, Y.-L. Betty Chang, Michael Haller, Mark Hancock, and Stacey D. Scott. 2013. Canyon: Providing location awareness of multiple moving objects in a detail view on large displays. In Proceedings of the SIGCHI Conference on Human Factors in Computing Systems (CHI ’13). ACM, 3149–3158.10.1145/2470654.2466431
33. Shahram Izadi, Harry Brignull, Tom Rodden, Yvonne Rogers, and Mia Underwood. 2003. Dynamo: A public interactive surface supporting the cooperative sharing and exchange of media. In Proceedings of the 16th Annual ACM Symposium on User Interface Software and Technology (UIST ’03). ACM, 159–168.
10.1145/964696.964714
34. Azam Khan, Justin Matejka, George Fitzmaurice, and Gordon Kurtenbach. 2005. Spotlight: Directing users’ attention on large displays. In Proc. CHI (CHI ’05). ACM, 791–798.10.1145/1054972.1055082
35. Ulrike Kister, Patrick Reipschläger, and Raimund Dachselt. 2016. Multilens: Fluent interaction with multi-functional multi-touch lenses for information visualization. In Proceedings of the 2016 ACM International Conference on Interactive Surfaces and Spaces (ISS ’16). ACM, 139–148.10.1145/2992154.2992168
36. Ulrike Kister, Patrick Reipschläger, Fabrice Matulic, and Raimund Dachselt. 2015. BodyLenses: Embodied magic lenses and personal territories for wall displays. In Proceedings of the 2015 International Conference on Interactive Tabletops & Surfaces (ITS ’15). ACM, 117–126.10.1145/2817721.2817726
37. Olga Kulyk, Gerrit van der Veer, and Betsy van Dijk. 2008. Situational awareness support to enhance teamwork in collaborative environments. In Proceedings of the 15th European Conference on Cognitive Ergonomics: The Ergonomics of Cool Interaction (ECCE ’08). ACM, Article 5, 5 pages.10.1145/1473018.1473025
38. Andreas Kunz, Ali Alavi, Jonas Landgren, Asim Evren Yantaç, PawełWo´zniak, Zoltán Sárosi, and Morten Fjeld. 2013. Tangible tabletops for emergency response: An exploratory study. In Proceedings of the International Conference on Multimedia, Interaction, Design and Innovation (MIDI ’13). ACM, Article 10, 8 pages.
10.1145/2500342.2500352
39. Jonas Landgren and Fredrik Bergstrand. 2016. Work practice in situation rooms – an ethnographic study of emergency response work in governmental organizations. In Proceedings of Information Systems for Crisis Response and Management in Mediterranean Countries (ISCRAM-med ’16). Springer, 157–171.
40. M. H. Lighthill and G. B. Whitham. 1955. On kinematic waves II: A theory of traffic flow on long crowded roads. Proceedings of the Royal Society of London Series A229, 317–345.10.1098/rspa.1955.0089
41. Narges Mahyar, Kelly J. Burke, Jialiang (Ernest) Xiang, Siyi (Cathy) Meng, Kellogg S. Booth, Cynthia L. Girling, and Ronald W. Kellett. 2016. Ud co-spaces: A
table-centred multi-display environment for public engagement in urban design charrettes. In Proceedings of the 2016 ACM on Interactive Surfaces and Spaces (ISS ’16). ACM, 109–118.10.1145/2992154.2992163
42. Laura G. Militello, Emily S. Patterson, Lynn Bowman, and Robert Wears. 2007. Information flow during crisis management: challenges to coordination in the
emergency operations center. Cognition, Technology & Work9, 1, 25–31.10.1007/s10111-006-0059-3
43. Beatrice Monastero and David K. McGookin. 2018. Traces: Studying a public reactive floor-projection of walking trajectories to support social awareness. In Proceedings of the 2018 CHI Conference on Human Factors in Computing Systems (CHI ’18). ACM, Article 487, 13 pages.10.1145/3173574.3174061
44. Emmanuel Pietriga, Stéphane Huot, Mathieu Nancel, and Romain Primet. 2011. Rapid development of user interfaces on cluster-driven wall displays with jBricks. In Proceedings of the 3rd ACM SIGCHI symposium on Engineering interactive computing systems (EICS ’11). ACM, 185–190.10.1145/1996461.1996518
45. Arnaud Prouzeau, Anastasia Bezerianos, and Olivier Chapuis. 2016a. Towards road traffic management with forecasting on wall displays. In Proceedings of the 2016 ACM on Interactive Surfaces and Spaces (ISS ’16). ACM, 119–128.10.1145/2992154.2992158
46. Arnaud Prouzeau, Anastasia Bezerianos, and Olivier Chapuis. 2016b. Visual immersion in the context of wall displays. In Proceedings of the 2016 ACM Companion on Interactive Surfaces and Spaces (ISS Companion ’16). ACM, 33–39.10.1145/3009939.3009945
47. Arnaud Prouzeau, Anastasia Bezerianos, and Olivier Chapuis. 2017. Trade-offs between a vertical shared display and two desktops in a collaborative path-finding task. In Proceedings of Graphics Interface 2017 (GI ’17). CHCCS, 214–219.10.20380/GI2017.27
48. Jun Rekimoto and Masanori Saitoh. 1999. Augmented surfaces: A spatially continuous work space for hybrid computing environments. In Proceedings of the SIGCHI Conference on Human Factors in Computing Systems (CHI ’99). ACM, 378–385.10.1145/302979.303113
49. Dominik Schmidt, Corina Sas, and Hans Gellersen. 2013. Personal clipboards for individual copy-and-paste on shared multi-user surfaces. In Proceedings of the SIGCHI Conference on Human Factors in Computing Systems (CHI ’13). ACM, 3335–3344.10.1145/2470654.2466457
50. Stacey D. Scott, Guillaume Besacier, and Phillip J. McClelland. 2014. Cross-device transfer in a collaborative multi-surface environment without user identification. In International Conference on Collaboration Technologies and Systems (CTS ’14). IEEE, 219–226.10.1109/CTS.2014.6867568
51. Teddy Seyed, Mario Costa Sousa, Frank Maurer, and Anthony Tang. 2013. Skyhunter: A multi-surface environment for supporting oil and gas exploration. In Proceedings of the 2013 ACM International Conference on Interactive Tabletops and Surfaces (ITS ’13). ACM, 15–22.10.1145/2512349.2512798
52. Herbert A Simon. 1978. Rationality as process and as product of thought. The American economic review 68, 2, 1–16.
53. Mark Stefik, Gregg Foster, Daniel G. Bobrow, Kenneth Kahn, Stan Lanning, and Lucy Suchman. 1987. Beyond the chalkboard: Computer support for collaboration and problem solving in meetings. Commun. ACM 30, 1, 32–47.10.1145/7885.7887
54. Maureen Stone. 2012. In color perception, size matters. IEEE Comput. Graph. Appl.32, 2, 8–13.
10.1109/MCG.2012.37
55. Norbert A. Streitz, Jörg Geissler, Torsten Holmer, Shin’ichi Konomi, Christian Müller-Tomfelde, Wolfgang Reischl, Petra Rexroth, Peter Seitz, and Ralf Steinmetz. 1999. i-land: An interactive landscape for creativity and innovation. In Proceedings of the SIGCHI Conference on Human Factors in Computing Systems (CHI ’99). ACM, 120–127.10.1145/302979.303010
56. Hilary C. Styron. 2001. CSX Tunnel Fire. Technical Report. United States Fire Administration.
57. Anthony Tang, Melanie Tory, Barry Po, Petra Neumann, and Sheelagh Carpendale. 2006. Collaborative coupling over tabletop displays. In Proceedings of the SIGCHI Conference on Human Factors in Computing Systems (CHI ’06). ACM, 1181–1190.10.1145/1124772.1124950
58. Ulrich von Zadow, Wolfgang Büschel, Ricardo Langner, and Raimund Dachselt. 2014. Sleed: Using a sleeve display to interact with touch-sensitive display walls. In Proceedings of the Ninth ACM International Conference on Interactive Tabletops and Surfaces (ITS ’14). ACM, 129–138.10.1145/2669485.2669507
59. James R. Wallace, Stacey D. Scott, Eugene Lai, and Deon Jajalla. 2011. Investigating the role of a large, shared display in multi-display environments. Computer Supported Cooperative Work (CSCW)20, 6, 529.
10.1007/s10606-011-9149-8
60. James R. Wallace, Stacey D. Scott, and Carolyn G. MacGregor. 2013. Collaborative sensemaking on a digital tabletop and personal tablets: Prioritization, comparisons, and tableaux. In Proceedings of the SIGCHI Conference on Human Factors in Computing Systems (CHI ’13). ACM, 3345–3354.10.1145/2470654.2466458
61. James R. Wallace, Stacey D. Scott, Taryn Stutz, Tricia Enns, and Kori Inkpen. 2009. Investigating teamwork and taskwork in single- and multi-display groupware systems. Personal Ubiquitous Comput.13, 8, 569–581.
10.1007/s00779-009-0241-8
62. Colin Ware. 2004. Information Visualization: Perception for Design(second ed.). Morgan Kaufmann Publishers. 63. Christopher D Wickens, Justin G Hollands, Simon
Banbury, and Raja Parasuraman. 2015. Engineering psychology & human performance. Psychology Press. 64. Daniel Wigdor, Hao Jiang, Clifton Forlines, Michelle
Borkin, and Chia Shen. 2009. Wespace: The design development and deployment of a walk-up and share multi-surface visual collaboration system. In Proceedings of the SIGCHI Conference on Human Factors in
Computing Systems (CHI ’09). ACM, 1237–1246.
10.1145/1518701.1518886
65. Johannes Zagermann, Ulrike Pfeil, Roman Rädle, Hans-Christian Jetter, Clemens Klokmose, and Harald Reiterer. 2016. When tablets meet tabletops: The effect of tabletop size on around-the-table collaboration with personal tablets. In Proceedings of the 2016 CHI Conference on Human Factors in Computing Systems (CHI ’16). ACM, 5470–5481.10.1145/2858036.2858224
66. Jakob Zillner, Christoph Rhemann, Shahram Izadi, and Michael Haller. 2014. 3d-board: A whole-body remote collaborative whiteboard. In Proceedings of the 27th Annual ACM Symposium on User Interface Software and Technology (UIST ’14). ACM, 471–479.