Cambridge Grand Junction Transit Implementation:
Alternatives, Scheduling, Cost, and Performance
By
Jesus Iglesias Cuervo
Aeronautical Engineering
Universidad Politecnica de Madrid, 2004 And Svetoslav Neov MASSACHUSETTS INSTITUTE OF TECHN _LOY
JUN 2
_____RI__ SARCHIVES
Bachelor of Science, Civil and Environmental Engineering University of Virginia, 2011
Submitted to the Department of Civil and Environmental Engineering in Partial Fulfillment of the Requirements for the Degree of
Master of Engineering in Civil and Environmental Engineering At the
Massachusetts Institute of Technology June 2012
C2012 Jesus Iglesias Cuervo and Svetoslav Neov. All rights reserved. The authors hereby grant to MIT permission to reproduce and to distribute publicly paper and electronic copies of this thesis
document in whole or in part in any medium now known or hereafter created.
Signature of Auth
Department oflivil and Environmental Engineering May 16, 2012 Certified by:
Jo Attanucci
Research Associate of 1vei %1Environn/?tal Enginefing Accepted by:
Hei iM. epf Chair, Departmental Committee for Graduate Stu ents
Cambridge Grand Junction Transit Implementation:
Alternatives, Scheduling, Cost, and Performance
By
Jesus Iglesias Cuervo and
Svetoslav Neov
Submitted to the Department of Civil and Environmental Engineering On May 16, 2012 in Partial Fulfillment of the
Requirements for the Degree of Master of Engineering in Civil and Environmental Engineering
ABSTRACT
The Grand Junction railroad lies at the heart of East Cambridge adjacent to the Kendall Square business district and the Massachusetts Institute of Technology campus. Over the last one hundred years the railroad has gone through substantial changes - from an important freight corridor to having just a few train movements per day. The recent purchase of the railroad by the Commonwealth of Massachusetts, planned relocations of existing freight yards, and future corridor improvements have made it possible to consider the addition of passenger services on the Grand Junction. Rising employment, population, and the congestion of the existing commuter rail facilities necessitate exploration of existing means to alleviate capacity.
This study is part of larger study that explores the addition of passenger transit services on the Grand Junction with the goal of increasing frequency and capacity to the west along the
Worcester/Framingham main line. The topics of this paper are service alternatives, scheduling, cost and performance. The study outlines all possible alternatives that are then screened for final analysis. Commuter rail and diesel multiple unit (DMU) services are the alternatives
quantitatively analyzed. A schedule model estimates the maximum frequency, based on existing constraints, to be five trains per hour. Marginal cost modeling shows that based on estimated demand levels, DMU trains may be a more financially viable option for Grand Junction service. This conclusion is backed up by performance comparison of DMUs and commuter trains, showing that DMUs in the configurations proposed are quieter, more fuel efficient, and would likely have a smaller traffic impact along the densely populated Grand Junction corridor. A substantial and detailed study of DMU service along the Grand Junction is recommended. Thesis Supervisor: John Attanucci
Table of Contents
1 Introduction ... 8
2 Background ... 10
2.1 Existing Conditions... 10
2.2 N orth and South Station Capacity ... 12
3 Previous Corridor Plans... 14
3.1 The Urban Ring... 14
3.2 M ass D O T Grand Junction Comm uter Rail Proposal... 14
3.3 Cam bridge Com m unity and Bike Path ... 14
3.4 N o-Build Scenario... 15
4 A lternative Creation... 16
4.1.1p ... 16
4.1.2p ... 16
4.1.3 N on-com pliant Diesel M ultiple Units... 18
4.1.4 Electrified Light Rail Service ... 19
4.1.5p ... 19
4.1.6 Tunnel...20
4.2 Screening of Initial A lternatives ... 21
4.3 Final A lternatives Selection ... 22
5 Schedule M odel ... 23
5.1 Schedule M odel Form ulation... 23
5.2 Excel Implementation...29
5.3 M odelInputs.... ... 29
5.4 Data Collection ... 29
5.4.1 M axim um Speed ... 32
5.4.2 A cceleration and D eceleration... 33
5.4.3 D w ell Tim es... 35
5.5 V alidation of M odel ... 35
5.6 M odel Exam ple... 37
5.7 M odeling of Grand Junction Single Track Operation... 40
6.1 A ubum dale-N orth Station A lternative ... 44
6.2 W orcester-N orth Station A lternative ... 47
6.2.1 Com m uter rail results... 48
6.2.2 DM U results... 48
6.3 Schedule Sum m ary ... 50
7 Station Locations ... 52
7.1 K endall/M IT Station ... 52
7.2 Beacon Y ard/Boston University Station ... 54
8 Cost /Revenue Analysis ... 55
8.1 Capital Costs ... 55
8.2 M arginal Operating Costs ... 57
8.3 M arginal Revenues... 58
8.4 M arginal Cost/M arginal Revenue Tool Example ... 59
8.4.1 M arginal Cost Calculation... 59
8.4.2 M arginal Revenue Calculation ... 60
8.5 D M U : W orcester to N orth Station ... 62
8.6 Com m uter Rail: W orcester to N orth Station... 64
8.7 D M U : Auburndale to N orth Station... 65
9 Other Im pacts - D M U vs Conventional Locom otives ... 68
9.1 Speed and A cceleration... 68
9.2 Fuel Consum ption ... 68
9.3 Em issions ... 69
9.4 N oise and V ibrations... 71
9.5 M aintenance and Configuration... 72
9.6 Traffic Im pact... 72
10 Conclusions and Recom m endations ... 75
10.1 Conclusions ... 75
10.2 Recom m endations ... 76
11 Bibliography ... 77
List of Figures
Figure 1: Boston Commuter Rail Network... 9
Figure 2: The Grand Junction in Cambridge ... 11
Figure 3: North Station Sample Platform Occupancy (yellow -scheduled time, orange -buffer tim e) ... 13
Figure 4: Long Route DMU Service... 17
Figure 5: Short Route DMU Service ... 18
Figure 6: Non-FRA Compliant DMU on NJ RiverLine ... 19
Figure 7: Example BRT Right-of-Way in Grand Junction corridor... 20
Figure 8: Schedule Model Formulation... 23
Figure 9: Schedule Model Formulation... 26
Figure 10: Map of GPS Data ... 30
Figure 11: Close-up map of GPS Data Points ... 31
Figure 12: Time vs Speed Plot of GPS Data... 31
Figure 13: Sample Acceleration/Deceleration Graph ... 34
Figure 14: Model Example ... 37
Figure 15: Schedule Model... 39
Figure 16: Example of Schedule Model ... 40
Figure 17: Single Track Schedule Model Illustration... 41
Figure 18: Illustration of Waiting Time in Model... 42
Figure 19: Single Track Delay Illustration ... 43
Figure 20: Example Time vs. Space Plot; 2 powered cars + 1 trailer car... 45
Figure 21: Example Time vs. Space Plot: 1 powered car + 2 trailer car ... 45
Figure 22: Example Time vs. Space Plot; 1 powered car + 1 trailer car ... 46
Figure 23: Final Alternatives ... 51
Figure 24: Kendall/MIT Commuter Rail Station Location... 52
Figure 25: Kendall/MIT DMU Station Locations ... 53
Figure 26: BU Station Location... 54
Figure 27: Marginal Revenue Example ... 61
Figure 28: Marginal Cost/Revenue Summary ... 62
Figure 29: DMU vs Locomotive Fuel Consumption (Jacobs, Edwards and Kelcey, 2007)... 69
Figure 30: DMU vs Locomotive Hydrocarbon Emissions (Jacobs, Edwards and Kelcey, 2007) 70 Figure 31: DMU vs Locomotive Carbon Monoxide Emissions (Jacobs, Edwards and Kelcey, 2 0 0 7) ... 7 0 Figure 32: DMU vs Locomotive Nitrogen Oxide Emissions (Jacobs, Edwards and Kelcey, 2007) ... 7 1 Figure 33: DMU vs Locomotive Particulate Matter Emissions (Jacobs, Edwards and Kelcey, 2 0 0 7) ... 7 1 Figure 34: Grand Junction Intersection Crossings... 73
List of Tables
Table 1: Grand Junction Intersection Safety Features (City of Cambridge, 2006) ... 11
Table 2: Initial Screening of Alternatives... 21
Table 3: D M U A cceleration Table ... 28
Table 4: Maximum Speeds (mph) by Segment... 32
Table 5: Commuter Train Acceleration/Deceleration by station... 34
Table 6: V alidation Travel Tim es... 36
Table 7: A cceleration Exam ple... 38
Table 8: D eceleration Exam ple... 38
Table 9: Example Inbound DMU Schedule; 2 powered cars + 1 trailer car... 44
Table 10: Example Inbound DMU Schedule; 1 powered car + 2 trailer cars... 45
Table 11: Example Inbound DMU Schedule; 1 powered car + 1 trailer car ... 45
Table 12: Example Inbound Commuter Rail Schedule -Worcester to North Station... 48
Table 13: Example DMU Schedule -Worcester to North Station... 49
Table 14: Final Alternatives for Analysis... 50
Table 15: D M U Fleet C osts ... 56
Table 16: Commuter Train Fleet Costs... 56
Table 17: Total Estimated Capital Costs ... 57
Table 18: Current MBTA Advertising Fees ... 58
Table 19: Proposed Commuter Rail Pass Prices (CTPS, 2012)... 59
Table 20: DMU - Worcester to North Station Marginal Cost and Revenue Summary ... 63
Table 21: DMU - Worcester to North Station Marginal Cost and Revenue Summary for High O ccu p an cy ... 6 3 Table 22: Commuter Rail - Worcester to North Station Marginal Cost and Revenue Summary 65 Table 23: DMU -Auburndale to North Station Marginal Cost and Revenue Summary... 66
Acknowledgements: Kelly Brown (MIT) Matt Cibirowoski (MassDOT)
Jared Melnick (Titan360) David Nelson (Jacobs Engineering)
Fran O'Connor (MBCR)
Susanne Rasmussen (City of Cambridge) Mark Roberts (TfL, London)
Ted Schaefer (US Railcar)
Diggory Waite (Chiltern Railway, London) Jonathan White (MBCR)
1 Introduction
The Boston metropolitan area has one of the oldest and largest public transportation systems in the United States, operated by the Massachusetts Bay Transportation Authority (MBTA). Part of this system is the regional commuter rail network, operated under contract to the MBTA by the privately-held Massachusetts Bay Commuter Railroad Company (MBCR). The commuter rail network is made up of almost 400 miles of rail track on 11 separate lines, bringing close to 55,000 passengers daily into downtown Boston (Central Transportation Planning Staff, 2010). Four of the commuter rail lines terminate at North Station and seven terminate at South Station, as seen in the system map below. With an increase in population, development, job growth, and urbanization expected in the future, ridership on all transit will inevitably increase. Increasing commuter rail transit capacity to meet these future needs can be done by expanding the capacity of existing stations or making efficient use of existing
infrastructure.
Expansion of the large downtown stations, namely South Station, is likely to be a capital intensive and lengthy project. Moreover constraints at Back Bay often cause additional delays for trains to and from the west, so that even improvements at South Station beyond those required for Amtrak, the Fairmount Line, Old Colony Line, and other southern lines may not provide additional capacity for trains to Worcester and points west. This study examines the possibility of improving commuter rail service to the west by using the available infrastructure as a short term alternative to terminal station expansion and a long term complement to such expansions.
One shortfall of the commuter rail network that can be seen by looking at the map in Figure 1 is the lack of a north-south connector - the network is essentially two separate systems, one for the north and one for the south.. Passengers that begin their trips in the south and
terminate in the north, or visa-versa, must transfer downtown to the MBTA rapid transit network, bus, auto, or another mode to complete their journey. The lack of connection also means that forecasted increases in demand must be dealt with separately. The only connecting infrastructure east of Worcester between the north and south is the Grand Junction railroad. The goal of this study is to examine the possible alternatives for using the Grand Junction railroad to improve passenger service from the west (areas from Brighton and Newton out to Framingham and Worcester) to Cambridge and downtown Boston. The primary motivations for this study are rising employment, congestion at the South Station and Back Bay rail facilities, and improving transit services to Cambridge by using this existing facility.
This thesis is part of a larger study, titled Grand Junction Transit Service Implementation that also includes ridership estimation and data on rising employment and population in Kendall Square. The elements that this thesis focuses on are alternatives analysis, schedule modeling, and cost modeling. An in-depth analysis on the demand modeling and ridership analysis for the proposed project can be found in a thesis by Adam Bockelie and James Dohm (Bockelie &
I-0 =
ae
0 a.) .. xxxxxxx::x::xx:...-... ... ... ...2 Background
The Grand Junction is an 8.5 mile long corridor that stretches from the Beacon Yard in Allston through east Cambridge to Chelsea in the north of Boston. It was opened in 1855 by the Grand Junction & Depot Company to serve a variety of factories and warehouses in the newly industrialized east end of Cambridge, (City of Cambridge, 2006). Some of the customers that relied on the freight services along the corridor included rubber goods manufacturers, stone cutters, soap manufacturers, and meats companies. Post World War II, however, saw the rise of
service and technologies industries in the area, drastically decreasing the demand for freight along the Grand Junction until its present state where there is no significant freight service along the route in east Cambridge.
The railroad has gone through a multitude of owners, finally ending up in the hands of the Commonwealth of Massachusetts and under the control of the MBTA (City of Cambridge, 2006). MIT acquired property rights over and under a portion of the right of way, but the MBTA
acquired the operation rights from CSX, subject to requirements to continue allowing freight service to operate. This means that the MBTA also controls dispatching, making it easier to schedule passenger train movements along the Grand Junction.
Decreasing demand for freight traffic and increasing demand for transit, coupled with the Commonwealth purchase, have opened the door for possible passenger service expansions along the Grand Junction corridor. Such a service could provide many short term benefits and be a complement to future improvements to the commuter rail network. To better understand the feasibility of such an expansion, the current state of Grand Junction railroad, restrictions, and existing traffic along it should be reviewed.
2.1 Existing Conditions
A two mile portion of the Grand Junction tracks runs through the heart of Cambridge adjacent to the MIT campus, Kendall Square, and residential areas in North Cambridge. To the west the Grand Junction connects to the Worcester/Framingham commuter rail tracks and crosses the Charles River under the BU Bridge into Cambridge. The tracks make six at-grade crossings along the two mile stretch, crossing Massachusetts Avenue, Main Street, Broadway Street, Binney Street, Cambridge Street and Medford Street. Along with these roadway
crossings, the tracks have several pedestrian only crossings - both marked ones and ones that are illegally used purely for convenience by students. In the east the tracks cross the Fitchburg mainline at a diamond interchange and go into the Boston Engine Terminal (BET) before joining the other tracks and leading into North Station.
The physical condition of the tracks is a reflection of corridor's diminishing importance over the last half century. The corridor used to feature sections with multiple track segments, but is now largely a single track corridor. A single track splits from Beacon Yard in the west
crossing over the Charles River. The bridge was built to hold two tracks but the current
configuration of the Massachusetts Turnpike and Soldiers Field Road constrain the connection to a single track in the turn. The radius of the turn limits trains to 10 mph in this segment. The double tracks starts at the western end of Cambridge after the bridge crossing and continue until Massachusetts Avenue where the rails merge into a single track. This single track continues until the Grand Junction connects into the BET in the east. The single track turn here runs very close
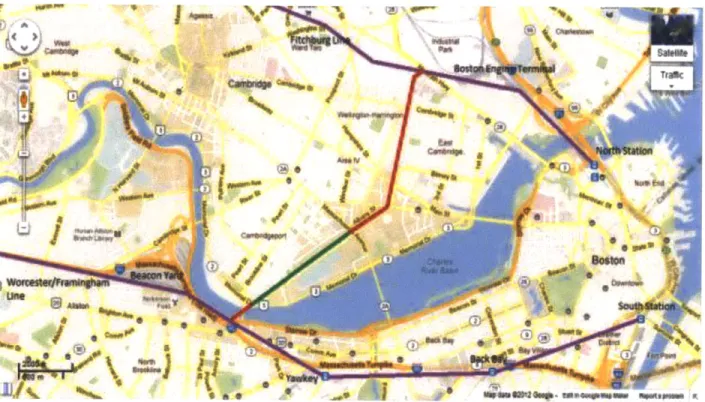
to a bridge abutment of the McGrath Highway and the turn radius also limits trains to 10 mph. Figure 2 shows a schematic of the double track portion in green, the single track portion in red, and existing commuter lines in purple.
Figure 2: The Grand Junction in Cambridge
LMS
saw
d1 0 0
!!4
MWi%
WT-Further physical constraints exist on the corridor because of the zoning and adjacent land ownership. Where the entire corridor used to be zoned for industrial use, many portions are now residential areas, commercial buildings, and institutional buildings such as those of MIT. The proximity of houses and businesses constricts the right of way. For example, the single track portion of the Grand Junction runs under two MIT buildings: the cogeneration power plant and building 46, where the rail right-of-way is constrained to 60 feet. In addition, further east the railroad hugs the sides of several commercial buildings with little room to expand.
The physical state of the already constrained corridor is also an issue impacting future services. The Grand Junction lacks the necessary train signals and safety devices that would allow proper everyday use. Table 1 summarizes the safety barriers and flashers that exist at each crossing.
Table 1: Grand Junction Intersection Safety Features (City of Cambridge, 2006)
Location Width of Road Crossing Safety Features
Massachusetts Avenue 4 lanes Flashing signals
Main St. 2 lanes Flashing signals
Broadway St. 4 lanes Flashing signals
Binney St. 2 lanes Flashing signals
Cambridge St. 2 lanes Flashing signals and gates
The rails along the tracks are not continuous and welded and vary in condition. The current conditions limit most operations to around 10 miles per hour and trains must stop and blow their whistles before the at-grade crossings where there are no gates. The starting, stopping, and federally mandated whistle blowing at unprotected intersections creates noise that many residents complain about. Furthermore, buses that cross these unprotected intersections are required to stop at the crossing before proceeding, causing some traffic delay.
Many of these conditions do not pose a major problem for rail operations as current traffic along the Grand Junction is very low. The tracks see between four and six train
movements a day, mostly non-revenue moves of MBTA equipment between the northern and southern service yards, including transfers of coaches, freight cars, and locomotives. There is a daily freight service that serves the Chelsea produce market and the occasional circus train that stops near the MIT campus. The double track section between Massachusetts Avenue and the BU Bridge is also used to store overflow cars from Beacon Yard when necessary.
In order to propose feasible introduction of passenger rail service along the corridor it is necessary to establish some simplifying assumptions for the future. For the purposes of this study the following was assumed:
e Single and double track segments remain in Cambridge remain as they are.
" Planned signal, rail, track bed, and safety improvements will be carried out by the MBTA regardless of service introduction and will not be analyzed. These will allow slightly higher speeds and more efficient service along the Grand Junction.
* The interlocking connections to the Worcester/Framingham and Fitchburg lines will be optimally designed to provide seamless travel from those lines onto the Grand Junction. Their design and configuration is beyond the scope of this analysis.
2.2 North and South Station Capacity
A significant constraint on any commuter rail service expansions is the capacity of North and South Station to handle additional trains. Ridership is expected to increase on the
Worcester/Framingham line, as well as all southern lines, but according to a White Paper from Technical Report Number 5 - Operations Study assessing the capacity of the two downtown terminals, additional trains would overburden South Station (Boston's Passenger Rail
Operational Capacity White Paper).
South Station currently has 13 tracks of varying station platform lengths. Three of those tracks are used for Amtrak service (White & O'Conner, 2001). The MBTA projects that by 2020 ridership in the south will be over 74,000 (Boston's Passenger Rail Operational Capacity White Paper). To deal with the forecasted increase in demand a proposal for South Station expansion is being investigated but this project will be difficult, expensive and time consuming. It is
prioritized by the State and will offer a long term solution when complete for most of the network, but as described in Section 1, western lines may experience fewer of the benefits of expansion.
North Station currently has 10 tracks. Two additional tracks can be put into service by taking over an MBTA easement from the Spaulding Rehabilitation Hospital (White & O'Conner, 2001). The MBTA projects that northern ridership in 2020 will a bit over 51,000 (Boston's Passenger Rail Operational Capacity White Paper). This lower ridership compared to the South means that
fewer trains are required to service North Station, something that was confirmed using a typical weekday train schedule. A platform occupancy chart was created based on the following:
e All trains have access to every platform, although some platform management is done e At least 5 min must pass between a train departing a platform and another arriving
* Any house moves (trains going out of service) remain at platform for 15 min
e Arrivals were optimized to reduce the number of occupied platforms at any given time
Using these assumptions, it is feasible that under the current operations, one platform remains unused in the AM peak period. The schedule is a simplification of real operations but illustrates that there is some available capacity at North Station to handle additional train movements. The availability of capacity at North Station is also confirmed in the White Paper (Boston's Passenger Rail Operational Capacity White Paper).
Figure 3: North Station Sample Platform Occupancy (yellow -scheduled time, orange -buffer time)
1~~~ - tQ~ w m 2 timi IM 127 in 128 19 Ls 132 136 135 I" 157 157 145 341 342 14B 144 145 156 1st 236 lm 157 156 100 94 8:17 8:18 6:19 -2I a24 323 826 2:27 S29 6:30 831 3.32 3.35 834 835 836 #57 BAB RA2 eas 844 3:50 6 52
hetl She2 het32
1
-A41I
'I~
Keeping in mind these capacity constraints, all efforts should be geared toward easing the congestion at South Station and Back Bay while meeting transit demands to downtown Boston and Cambridge. Even with the substantial investments, efforts, and time slated to improve South Station and Back Bay terminal capacities, any Grand Junction service moving passengers from the west through Cambridge into North Station stands as a desirable complement for the near and
long term future of the entire commuter rail system.
3 Previous Corridor Plans
The addition of passenger services in the Grand Junction corridor has been previously considered by MassDOT and the MBTA. The purpose of this section is to briefly review those studies.
3.1 The Urban Ring
The MBTA Urban Ring project proposes circumferential transit services (primarily bus) that link destinations outside of downtown Boston. The areas it would cover are East Cambridge,
Somerville, Chelsea, East Boston, South Boston, Roxbury, LMA, and Brookline. The Urban Ring project has three phases. Phase 1, which has been partially implemented, includes
expansion of crosstown buses between some of the destinations. Phase 2 proposes the addition of bus rapid transit services to create the circumferential routes and Phase 3 implements rail to the most heavily traveled corridors in order to provide improved service to the maximum number of passengers. The Urban Ring had some planned service along the Grand Junction corridor serving Kendall Square but many of its sections traveled on existing roads. Phases 2 and 3 of the project have not been implemented and the project is on indefinite hold due to funding problems. The Urban Ring had a high projected ridership and remains the benchmark for ridership that the City of Cambridge uses when weighing possible Grand Junction alternatives.
3.2 Mass DOT Grand Junction Commuter Rail Proposal
Mass DOT conducted a study proposing the addition of commuter rail service from the Worcester/Framingham line to North Station along the Grand Junction corridor. That study laid the foundation for much of this proposal. Mass DOT proposed the addition of a maximum of three peak period train sets consisting of six car trains and a station at Kendall Square, assuming the existing infrastructure remained largely as is. That study concluded that the addition of Grand Junction service would increase Worcester line demand by up to 300 passengers compared to the
same service increase on the line to South Station, which would be impossible to implement without the aforementioned expansion of South Station capacity. The study met heavy
opposition from Cambridge residents who were against the idea of large trains passing through the dense urban area. As part of the study Mass DOT modeled traffic delays, passenger delays, auto diversions, and air quality improvements to demonstrate the possible merits and issues with a Grand Junction service. Ultimately, based on the results of the study and community
opposition, the state suspended pursuing Grand Junction service in the near future, choosing instead to focus on expansion of South Station.
3.3 Cambridge Community and Bike Path
In 2006 the city of Cambridge completed a feasibility study for a Rail-with-Trail (RWT) corridor in the Grand Junction (City of Cambridge, 2006). The city proposed a community path sharing the rail right-of-way with the existing traffic and configuration. The path configuration
was also explored under the scenario of having a one way bus service as part of the Urban Ring. Community support is very high for a pedestrian and bike path along this corridor as the city has chosen to move toward sustainable forms of transportation. The proposed community path would complement the Vassar Street cycle path and allow access to more parts of eastern Cambridge. The proposed community bike path would be 10-12 ft wide and must be separated from the centerline of the railroad by 10-25 ft. There are certain areas, such as under MIT building 46, where the existing right of way may not allow enough room for a bike path and an expansion of existing rail infrastructure such as a double track station. The addition of a community path is currently on hold but any proposals for Grand Junction service will need to include it because of community support for such infrastructure.
3.4 No-Build Scenario
Most commuter demand is for downtown Boston and the financial district area around South Station so a no-build scenario is possible as a future alternative. This scenario would maintain existing freight traffic along the tracks and complete only the scheduled MBTA safety improvements along the Grand Junction. No capital expenditures beyond this would be required. In a no-build scenario the following factors will likely influence future plans for the area:
population and employment growth in Kendall and Boston, transit system congestion, limited parking in Kendall and Boston and limited transit access to Kendall.
4 Alternative Creation
The first step in the project analysis was to create a full list of possible alternatives along the corridor. The only restriction made in this initial list was that each alternative had to use the Grand Junction right-of-way and connect passengers coming from the west to North Station and downtown via the Kendall Square and MIT area of Cambridge. Passenger service could be routed straight into North Station but considering the number of jobs in the Kendall Square area, all of the alternatives include a station in the Kendall area. Additionally, a station in the area of Beacon Yard, near the Boston University campus, is also included in the alternatives. This
second station offers transfer services, further described for each alternative and provides another center of demand for future transit. Station locations are described in more detail in Section 7.
The initial alternatives were qualitatively assessed based on cost, passenger capacity, noise, vibration, and the ease with which they could be introduced. The list below enumerates the initial options with a short description of each, including basic improvements or changes that would be necessary along the existing Grand Junction corridor in order to facilitate their introduction, followed by an assessment of the initial alternatives.
4.1.1 Commuter rail expansion
The first service alternative that was examined for this study was the addition of
commuter rail trains along the Grand Junction from Worcester/Framingham into North Station. This alternative was the focus of the study completed by Mass DOT. Locomotive hauled trains would be added to the Worcester/Framingham line and routed along the Grand Junction corridor to North Station. Diesel push-pull configurations are comparatively inexpensive and dominate US regional rail systems because most tracks lack the overhead catenary supply required for electrified service. The ubiquity of these types of vehicles means that the cheapest and easiest way to add passenger service to a commuter rail system is simply the introduction of additional conventional train sets.
The train consists considered in this study would be around six coaches long (a mix of bi-level and single bi-level cars) pulled by a locomotive. This is the basic setup for most train consists in the MBTA commuter rail network and commuter rail networks around the United States. Accepting the assumptions, made about the future of the corridor, the only addition necessary to introduce commuter rail service along the Grand Junction would be the construction of new stations at Beacon Yard and Kendall/MIT.
4.1.2 Diesel Multiple Unit
Diesel multiple units (DMUs) are the second heavy rail service alternative that was considered. DMUs are self-propelled coach cars that do not require separate locomotives. DMUs are popular outside of the United States: they are often quieter, smaller, more economical, and offer better performance in certain configurations when compared to push-pull locomotive configurations. As with the commuter rail alternative, station construction would be the only corridor improvement necessary beyond the assumed improvements. The biggest obstacle to introduction of DMUs is Federal Railway Administration (FRA) regulations on crash worthiness.
The connection to the Worcester line and the Fitchburg line means that any equipment moving along the Grand Junction must comply with crash worthiness requirements for freight trains and large passenger trains. There are only a few FRA compliant DMU vehicles, one sold by US Railcar. For the DMU service alternative a long route service and a short route service will be considered. The long service will be from Worcester to North Station and the short service will be from Auburndale, in Newton, to North Station. The long service will be interspersed with the current commuter rail operations, while the short service will offer transfers by being scheduled to minimize transfer times for passengers wishing to go to Cambridge or North Station. Both alternatives will include stops at BU and Kendall/MIT to capture the existing demand in
Cambridge and possible future demand in Allston. A BU station would also offer transfers to the Green Line and in the case of a short line service it will provide an additional transfer point for passengers on the existing mainline services. Figures 4 and 5 illustrate the two options with the new stations shown by yellow circles.
Figure 4: Long Route DMU Service
Figure 5: Short Route DMU Service
Field Sailfite yb
*19iIL f
4.1.3 Non-compliant Diesel Multiple Units
All DMUs that do not comply with FRA collision regulations are referred to as "non-compliant DMUs". These vehicles are lighter, smaller, and quieter than FRA "non-compliant DMUs. They have smaller passenger capacity but better performance characteristics. Several non-FRA compliant services are legal and exist in the United States, a notable example being the New Jersey River Line in Figure 6. Non-FRA compliant service requires strict time separation from heavy equipment or alternative service arrangements to ensure safety. Existing deadhead moves and the produce freight service must remain on the Grand Junction so the introduction of non-compliant service would be possible only with dedicated tracks or time-of-day separations. Dedicated tracks would require a large capital investment and time share agreements would be very difficult to implement because of the existing connection with the busy Worcester and Fitchburg lines. Considering these limitations, only a short route service from Auburndale to North Station or a shuttle service from Beacon Yard to North Station was considered. Stations would be built at Beacon Yard and Kendall as in the previous alternatives.
Figure 6: Non-FRA Compliant DMU on NJ RiverLine
4.1.4 Electrified Light Rail Service
An alternative to heavy commuter rail and DMU operation on the Grand Junction would be electrified light rail. This could be a spur of the Green Line from Lechmere or a separate line using tram cars. Electrification of the Grand Junction would provide a quiet, locally pollution free passenger service and would be possible through a third electric rail or overhead catenary. Light rail vehicles also offer superior performance in terms of acceleration and ride quality to almost any other mode of public transportation. The improved start-stop performance a light rail system means it could have more than one stop and have a smaller impact on road traffic at crossings. On the downside, a third rail power system would create many safety issues at grade crossings and overhead catenary will be expensive to build. With the existing freight use having to continue throughout the foreseeable future and FRA rules governing mixed rail traffic, electrification at this time would require dedicated tracks paralleling the freight line. Having a two way light rail track with station platforms and a single heavy rail line may be expensive or impossible in some areas given the physical constraints that exist on the Grand Junction, and would preclude any consideration of a community path sharing the right-of-way.
4.1.5 Bus Rapid Transit
Bus rapid transit, or BRT, has been gaining popularity around the world as an inexpensive alternative to rail transit. Typical characteristics of BRT include exclusive bus ways, signal priority, and off-bus fare
collection. This alternative would be similar to the Silver Line, primarily using a combination of adjacent Vassar and Albany St. dedicated lanes with some use of Grand Junction right of
way. The goal with BRT would be providing a service that is not impacted by road congestion, is much quieter than most train services, and provides faster access than regular bus service to commuters. There are many flexible options with BRT but a short service from Auburndale to North Station in order to keep it comparable to the rail alternatives was considered. The BRT route would travel on existing roads and highways and cross the Charles River along the BU Bridge then use a combination of Vassar St, Albany St. and portions of the Grand Junction in dedicated lanes until Lechmere. It could either terminate here or make its way all the way into North Station or Sullivan Square. The BRT alternative would have multiple stations in the Grand Junction corridor. To accommodate buses, portions of the corridor would have to be paved
adjacent to the rail tracks where the right-of-way would be shared by the bus and existing freight traffic. The width of the Grand Junction corridor would also preclude the possibility of two-way bus traffic and the existing operations. If the right-of-way was shared between one-way BRT, a
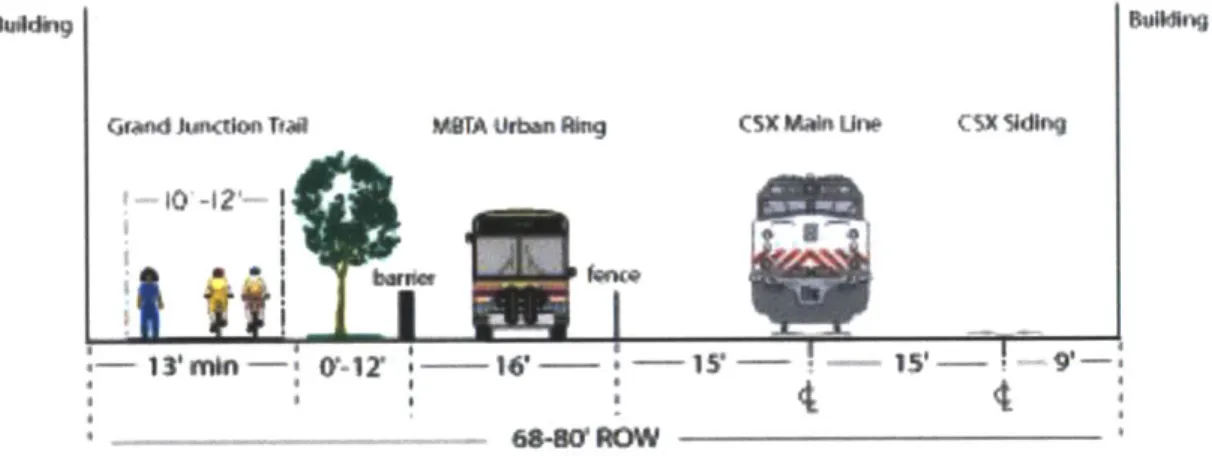
community path, and existing freight traffic an alignment such as the one pictured in Figure 7 would be possible.
Figure 7: Example BRT Right-of-Way in Grand Junction corridor
geddvig Beang
Grand JunaWn Ta MBTA Urban Ang CsX Main Une CSX VdIng
* 0 _1 1 I
68-so' oW
4.1.6 Tunnel
An ultimate solution to increase passenger transit services to Cambridge and Boston
would be to depress the Grand Junction railroad into a tunnel. This alternative would solve many
of the issues with pollution, vibration, noise, traffic impact, and capacity that the other alternatives only placate. A tunnel would most likely be electrified but could be used by
commuter trains or DMUs with proper ventilation. Placing the tracks underground would allow double track service on the entire corridor - the tracks would go underground after crossing under the BU Bridge and come up at the eastern end to join the Fitchburg line or Green Line, depending on whether commuter rail type service or rapid transit is used in the tunnel. This
alternative would have an underground station at Kendall/MIT. Depressing the tracks into a tunnel would resolve almost all the difficult implementation issues that have been raised in this
corridor but would be a massively expensive undertaking accompanied by significant
disruptions. A project of this size would run in the hundreds of millions of dollars and take a significant amount of time to complete.
4.2 Screening of Initial Alternatives
The next step in the alternative selection process was to screen the list to a few alternatives that could be analyzed in our demand model and quantitatively assessed. In Table 2, each alternative is qualitatively compared to the others in several categories and assigned a color depending on how it compares. Green represents very good estimated performance, yellow marginal, and red poor. The factors analyzed were:
e Cost - how much any necessary capital improvements would cost (beyond the
assumptions stated) and if a new fleet is required, would it require expensive vehicles. " Passenger capacity - this category is based on potential vehicle size, with commuter
trains and FRA compliant DMU cars having the most seated capacity per vehicle. * Noise/vibration - the Grand Junction is located in a dense residential area so noise and
vibration reduction are paramount to gaining community acceptance. Locomotive whistles, vehicle size, engine noise, and horsepower are the strongest indicators in this category. Large vehicles, such as locomotives, are considered much worse than smaller ones, such as buses.
* Ease of introduction - the goal of this performance measure is to see which of the alternatives could be introduced in the shortest time frame. Good performance is estimated as having few capital improvements, vehicle acquisitions, and shorter implementation times.
Table 2: Initial Screening of Alternatives
Passenger ase o
Alternative CotNoise/Vibration .
capacity introduction
Commuter rail
Electrification and tunneling would require substantial capital improvements in the corridor so they are the worst performers in the cost category. BRT would require some corridor improvements to allow bus service so it receives marginal scores. Non-compliant DMU service would require purchase of an expensive new fleet, but because of non-compliance it would also require possible investments in corridor improvements and new rail track if new traffic is to be physically separated from the current traffic. The FRA compliant DMUs and commuter rail would only require the purchase of new vehicles and fewer capital improvements..
In the passenger capacity category, FRA compliant DMUs and commuter trains score very well because they have very similar capacities. The other rail options have smaller vehicles
Electric Tunnel
with fewer seats so they score marginally. BRT is bus service, which may be frequent but has a much smaller seating capacity than most trains.
With high residential density along the Grand Junction, it is important that the selected service alternative minimizes negative impacts along the corridor. Noise and vibration are detrimental to the community and can create community backlash. Electrification for light rail, tunneling, and BRT would all have minimal noise and vibration impacts (not considering construction) because the vehicles will be buses with small engines or electrically driven trains. BRT service could be introduced on Vassar and Albany without conflicting with the Grand Junction. All DMUs score better than commuter trains because they tend to use smaller diesel
engines and consist of shorter trains. In the final category, commuter rail and compliant DMUs score higher than all the other alternatives because they would cause fewer scheduling conflicts and require the least new construction. The FRA compliant DMU service is yellow because the purchase of vehicles would take time and maintenance staff would have to be trained to work on
the new fleet. Non-compliant DMUs would cause scheduling conflicts because of the necessary temporal or physical separation and cannot be seamlessly introduced with existing commuter rail and freight operations. The other alternatives would require significant corridor improvements that would be time consuming and would delay the introduction of passenger services.
In addition to the constraints established in the table it is important to consider the types of riders that would be serviced by each alternative and how each alternative meets the
established goals of this study. BRT service, as proposed here or as part of the Urban Ring, could be introduced on adjacent streets without conflicting with Grand Junction traffic, even if
commuter trains or DMUs are added. BRT service would not relieve any capacity constraints on the commuter rail network which serves passenger that usually travel longer distances. Similarly, electrified light rail service would not serve long distance commuters or relieve congestion and could be introduced to the corridor parallel to heavy rail. Therefore the BRT and light rail alternatives could be separate and additive to Grand Junction service in the future. The tunnel alternative can be eliminated based on the costs and effort required and the non-compliant DMU services would fall in a similar situation with the light rail alternative - it is viable even with long distance commuter rail service added on the corridor.
4.3 Final Alternatives Selection
Based on the screening criteria established and analyzed the list of alternatives was narrowed to commuter rail service and FRA compliant DMU service. A long and short service option for DMUs is maintained producing the three alternatives for quantitative analysis listed below:
1. Expansion of commuter rail services by adding Worcester to North Station service 2. Long route FRA compliant DMU service from Worcester to North Station
3. Short route FRA compliant DMU service from Auburndale to North Station
Several service configurations were analyzed for each alternative including varied frequency and travel times. These are crucial inputs to the demand model necessary to develop a ridership estimate for the service.
5 Schedule Model
5.1 Schedule Model Formulation
In order to provide a realistic plan for the addition of passenger services along the Grand Junction, a model to provide possible schedules for the three final alternatives was developed. This model was used to generate the maximum possible frequencies, which are essential to estimating the ridership for the service, and to estimate the marginal operating costs of providing each service based on those frequencies.
To create a realistic model, the physical constraints outlined in the earlier sections, such as the extensive single track portions, and as well as the performance characteristics of commuter train and DMUs were considered. The train model is spreadsheet-based and uses basic kinematic equations to model the speed, acceleration, and position of the trains (see Figure 8). The inputs for the model were the length of railroad segment between stations, L; the initial position of a stopped train along the segment, A; train speed, V; final position along the segment, B; and acceleration. For acceleration values the model uses two approaches: for commuter trains
acceleration and decelerations based on kinematic equations and field data (described later) were assumed, and for DMU operations a table of accelerations (seen in Table 3) provided by US Railcar was used (Schaefer, 2012)
Figure 8: Schedule Model Formulation
X
AB
L
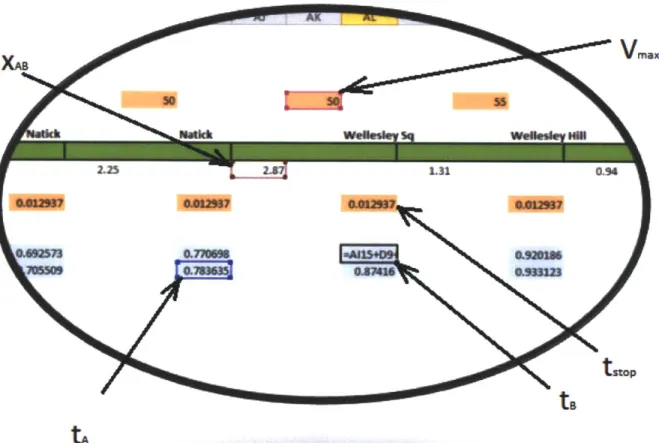
Figure 8 above illustrates the model of a single track, where x(t) is the position of the train at certain time t and A and B are consecutive stations along the rail line. Deriving this position is crucial to creating frequencies and schedules that minimize trains waiting to enter the single track portions of the Grand Junction. To derive the position of the train with acceleration (i) and velocity (x) were considered as defined here:
dx
= (1)
d? x X = $(2)2
If acceleration is a constant, a, then
x = a (3)
And if the equation is integrated, the result is the velocity with respect to time, where vo is the initial speed at point A:
x = at + v0
With one more integration, position equation is obtained:
x = 1 at2 + vot + x0 (5)
Applying zero as the initial velocity and position, vo and xO, the equation that determines the position of the train when it is accelerating in segment L can be derived:
x = -at 2
2 (6)
And the speed at a time t is:
v = at (7)
Regulations and track conditions limit the maximum speed along parts of the track. From a field data collection study described later on values for vmax were calculated along the
Worcester/Framingham mainline. For areas on the Grand Junction vmax is determined by track conditions. The value for speed allows derivation of the time and distance required to reach this speed as: tacel = Vmax a _ace 1 1 Vrax Xacl-2 a (8) (9)
When the train reaches the maximum allowable speed along the track section it will continue to travel at that constant speed, advancing a distance of xc:
Xc = Vmaxtc (10)
As the train approaches B, it will two new initial conditions:
x =-flt2 2 + vot + x0
Vo = Vmax
x= 0
V= -#t
start to decelerate at constant acceleration -P. Using (5), and
(11) (12) (13) (14) The length needed for deceleration until the train stops:
x e e 1 V 2 x
Xdecel - 2 fl (15)
And the time needed for it to stop at B:
tdecel - max (16)
Therefore, the total time and distance from A to B should be:
tAB - taccel + tc + tdecel _ Vmax + tc + Vmax (17)
a fl
L =iVa + vmaxtc +1 (18)
2 a 2 fl18
From (17) the time spent at constant velocity, tc, is: 12 2
_1vmax
1vmax
t= 2 a 2 1 (19)
Vmax
And then, tA can be calculated:
2 12
Llvmax1 Vmax
tAB = taccel + tc + tdecel = Vmax + 2 a 2 ft + Vmax (20)
a Vmax #
As mentioned earlier, Vmax will be determined by the type of the train or the characteristics of the railroad. Usually, but not in all cases along the track, A and B will be separated by a distance that allows the train to reach the speed vmax. In cases where the distance between stations, L, is not long enough it was assumed that the train will accelerate up to a maximum speed vmax* that will be lower than vmax, and then decelerate immediately. This case happens when:
L < 1 VMax + i max (21)
2 a 2 f#
In this case, Vmax* can be calculated using: 1EL+1 V*ma L = -ax max (22) 2 a 2/# Where, V,*nax = (23) af
And therefore, the time needed for the train to go from A to B in the case where L is too short for maximum speed will be:
tAB = taccel + tdecel = Vax + y (24)
tAB= 2L(+ T) (25)
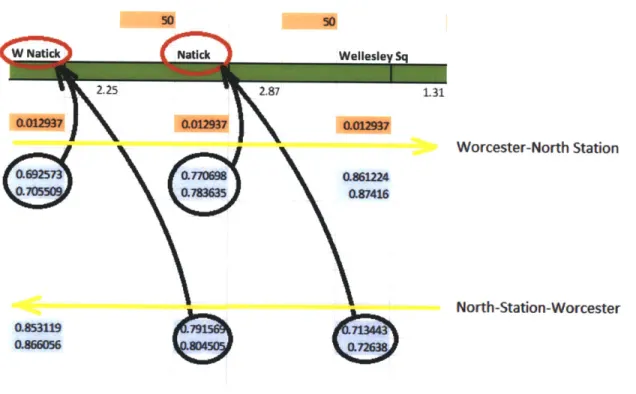
To create a full model of the entire route for each alternative the previous equations are
considered over consecutive stages, creating a formulation of the total time needed for a train to complete a trip. An illustration of this can be seen in Figure 9. Over the entire trip length the following simplifying assumptions were initially made:
- Acceleration and deceleration values are the same on all stages of the journey.
- The length of every stage, Li will be enough to reach the maximum speed assigned to that stage, vimax.
- Train will start running at Ai at a time ti.
- Train will stop at point A(i+) for a time tstop(i+l), the dwell time. Figure 9: Schedule Model Formulation
Vimax V(i+1)max
x
AiA(i+l) A(i+2)
Li Lii+1)
The time to reach the first station will be:
2 2
L.-1lLmax lVi max 2
t(i+1) = vimax + ' 2 a 2 + 1vimax (26)
a + 17?iMax
And therefore, the time to complete the entire two stage journey illustrated above will be: L 1Vi+1)max 1"(i+1)max 2
t(i+2) = t(i+l) + tstop(i+l) + V (i+1)max a +(i+1) 2 a 2 + V(i+1)max (27)
V(i+)max f
Equation 27 is the basis for the spreadsheet model and it easily allows prediction of the behavior of trains along any route. In the case of DMUs when accelerations are not calculated using the equations above, but rather pulled from the US Railcar (See Table 3), the formulation is slightly different. The acceleration table displays the time and distance needed to reach different speeds in various single level powered car-coach car configurations. Therefore, for a given speed vi, the table will return a value of time ti and distance xi. The model assumes constant decelerations for DMUs.
The equations for time in each stage that result from using the acceleration table are: LE-ximax-1 LmQ 2
t(i+1) =imax max2 + +max (28)
t(i+2) = t(i+1) + tstop(i+1) + t(i+1)max +
V2
X(i+)max i+)max 2
21>max-2 / + V(i+1)max
V(i+1)max f
Where Ximax and timax are distance and position taken from the acceleration table corresponding to the value Of Vimax in segment one. The same is true for second segment where x(i+1)max and t(i+1)max
correspond to V(i+1)max.
Table 3: DMU Acceleration Table
Projected Acceleration Performance of Various Single-Level DMU Consists
Assurnes Modied Dais equation for train resistance
Dry, level, tangent track
Two 600 hp Detroit Diesels, Two Voit T212bre transnisions, Two Voith KE553 final drives
36-inch wheels
Fully loaded skinfe level pwer car, 190,000 pounds Fully loaded singe level trailer car, 158,250 pounds
Power Car Power Car ar wo Power Cam wo Power Cam
One Trailer Car o Trader Car Trader Car re Traer Cars
Speed Tion Distance Trne Distance Tirne Dislance Time Distance Tute Distance
secons rises sconds miesiles) rmiles) scns gie
46 35.5 0.2711 67.7 0.531 104.0 0. 502 0. 83.5 0. 47. 36.9 0.2901 70.7 0. 108.8 0. 52.3 0.41 ..2 0.70 48. 38.5 0.31 73.8 0.61 113.9 0. 54.4 0.441 91.0 0. 49- 40.0 0.331 77.0 0. 119.3 1.0321 56.6 0.471 94.9 0. 50- 41.7 0.354 80.4 0.701 124.9 1.1 58.9 0. 99.0 0.862 51- 43.4 0.378 84.0 0. 130.9 1.1 61.3 0. 103.3 0.922 52. 45.2 0. 87.8 0. 137.4 1 63.8 0. 107.9 0. 53. 47.1 0.4 91.8 0. 144.3 1 66.5 0.611 112.7 1. 54. 49.1 0.461 95.9 0. 13 1.91 2 0.651 117.6 1.131 55-1 51.1 0.491 100.2 0. 158.6 1.601 71.9 0.6 122.5 1. 56. 53.1 0.522 104.5 1. 1661 1.7171 74.6 0. 127.6 1.284 55.1 0. 106.9 1.1 178 1 .4 0. 132.7 1. 58. 57.2 0. 113. 1.1 181.7 1 80.3 0. 138.0 1. 59. 59.4 0. 118.0 1271 189.9 83.2 0.871 143.3 1. 61.6 591 122. 1. 1 -3 86.1 0.91 148.8 1.6261 61. 63.8 0. 127.6 1.431 207.0 89.1 0. 154.3 1.71 62-. 66.1 0. 132.6 1.51 216.0 92.1 1.021 160.0 1.81 63 68.4 0.7761 137.7 1. 225.4 952 1 165.5 1.91 64. 70.8 0.81 143.0 1.7001 235.1 2.871 98.3 1.1 171.7 2.021 65D 73.3 0. 148.5 1. 245.3 3. 101.5 1.1 177.8 2.1 66 75.8 0. 154.2 1.901 256.0 3 104.8 1 184.1 2. 671 7MA 0. 160.1 .01 3. 108.1 1. I . 68. 81.1 1. 166.2 2.1 279.0 111.5 1. 197.1 2 69. 83.9 1. 172.6 2 291.5 3.91 115.0 1. 203.9 2.61 70- W7 1.11 1 3 2. -7 4.1 118 1.. 210.9 2_ _ 71. 89.7 1.172 186.2 2511 318.9 4. 122.3 1. 218.1 2.891 72. 92.8 1. 193.5 2.657 334.0 4. 126.1 1- 225.5 3. 1. 1 1 11 I -I 13 1. 233-2 3.1 74 99.3 1. 209.3 2 368.1 5 133.9 1.81 241.2 3. 75. 102.7 1- 218.0 3.1 387.6 5.841 138.0 1. 249.6 3. 76 106.4 1.51 227.2 3 1422 1. 2582 3.71 77. 110.9 1.61 240.1 3. 1472 269.2 3. 78. 115.9 1.71 255.1 3. 152.6 2 281.2 4.2031 79. 121.2 1. 271.4 4.303 158.1 2. 293.7 4. 80. 126.8 1. 289.4 4. 163.7 2A541 306.7 4. 81. 132.7 2. 309.4 5.1 169.6 2. 320A 5.0691 82. 138.9 2. 331.8 5. 175.6 2. 334.7 5.3931 8. _ _14._ 571 .6 6 181 2- 1 . 5 84. 152.7 2. 548 1882 3-011 365.6 6.1 85. 160.4 2 194.8 3.1 86 168.8 J 1.___ 3.. 87 177.9 3.147 208.8 3. 88 188.0 3.3921 1 2162 3. 1 3.1 _ _ _ _ - , 3-7_ 90 211.8 . -8-5-231-9 4.0
5.2 Excel Implementation
The formulas described were entered into Microsoft Excel to create the full model. Excel was chosen mainly because it easily accessible and operable. The application does not require programming expertise which makes it easy to explain to anyone reviewing the proposed alternatives. The Excel model is easy to program and expand using the stage by stage
formulation described and also allows the creation of simple visuals that organize the results. The schedule, frequency, and travel time results from Excel are readily compatible with most other packages and allowed for seamless integration into the demand model.
5.3 Model Inputs
To apply the model to the Worcester/Framingham mainline and the Grand Junction the following variables were input:
e Distance between stations, corresponding to L
* Departure time from station A, tA
* The maximum speed on each segment, vmax
* The acceleration of the trains, a * The deceleration of the trains,
p
* Dwell times at each stationThe distance between stations was taken from Googlemaps. The departure time can vary and is an easy input to change depending on the chosen frequencies. To determine the last four variables for each segment and station, field data were collected. Vmax will be the same for all
alternatives and is based on track characteristics observed; accelerations were measured to correctly model commuter train performance; and dwell time estimates were applied to all alternatives with slight adjustments for each.
5.4 Data Collection
Data collection on the Worcester line was performed using a Marathon Windows Phone 7 Application using the Samsung Focus Flash internal GPS unit. An Android based application was used to verify the speeds from the GPS application after processing the data. The GPS application recorded data points every four seconds and provided the following information:
* Coordinates: Longitude, Latitude. * Altitude (feet).
" Altitude Valid (true or false), depending on GPS data reliability. * Distance (cumulative, in meters).
* Heading (0-360*) * Speed (m/s)
* Time interval (time elapsed between two measures, in seconds) * Speed (mph)
* Distance (cumulative, in miles)
* Total time (cumulative elapsed time, hh:mm:ss)
The data collection was performed by riding a Tuesday morning train from South Station to Worcester. The train stopped at Back Bay, Wellesley Farms, Wellesley Hills, Wellesley Square, Natick, West Natick, Framingham, Ashland, Southborough, Westborough, Grafton, and
Worcester. The data recorded for the South Station-Back Bay-Wellesley Farms section of the trip is useless for the purposes of this study because large portions of it were underground limiting GPS availability and because no stops occurred that are relevant to the proposed alternatives. The rest of the journey, however, provides enough accelerations, decelerations, and speeds to generate the necessary inputs for the spreadsheet model.
To verify that all the position data was accurate from the GPS, the application has an online system that maps the coordinates collected. Figure 10 shows the positions recorded during the trip.
Figure 10: Map of GPS Data
* +w21I
-z> .~1 1 _
AX~to& Cwt I
aplcain P ihesmeateWocser line mappe inGol.vnadtinupeddt "a
Ulm all **sowt9
3-24 40
A more detailed view in Figure 11I verifies that the path registered by the mobile
application GPS is the same as the Worcester line mapped in Google. In addition, speed data was checked throughout the trip using a second mobile application for real time speed - the values from both phone applications were a close match. This confirms that all the other data collected by the application can be safely used to derive the model inputs.
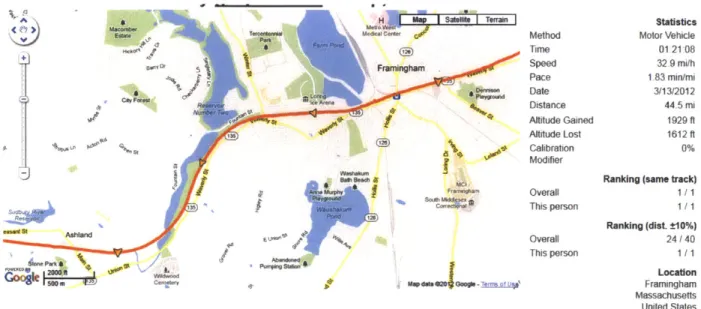
Figure 11: Close-up map of GPS Data Points
Framingham
Uns d~ias e~oi- Terms of u
Method Time Speed Pace Date Distance Altitude Gained Altitude Lost Calibration Modifier Overall This person Overall This person
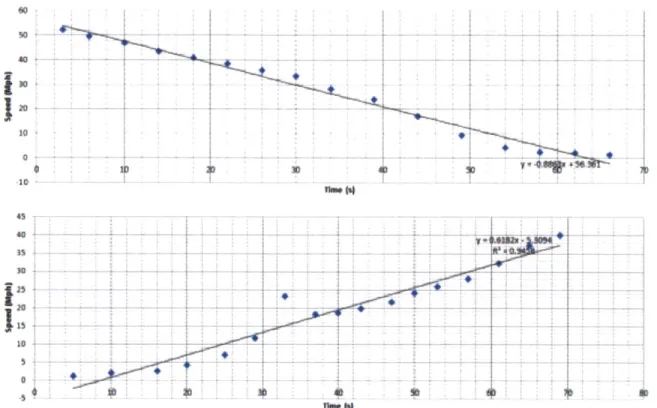
The data collection recorded 1,239 sample points which are graphed in a time vs Excel, depicting the entire journey ending in Worcester, as shown in Figure 12.
Figure 12: Time vs Speed Plot of GPS Data
IMIXI Statistics Motor Vehicle 01 21 08 32.9 mi/h 1.83 min/mi 3/13/2012 44.5 mi 1929 ft 1612 ft 0%
Ranking (same track)
Ranking (dist. t10%) 24/40 1 / 1 Location Framingham Massachusetts United States Prde d by in speed plot in f4313i ---- --- - - -02 i~i~44 DIM
---Station locations are very obvious in the graph. The maximum speed inputs for the model, the acceleration and deceleration values for commuter trains, and the estimated dwell times were derived from this graph.
5.4.1 Maximum Speed
To create an accurate model, the maximum speed along every track segment on the Worcester/Framingham mainline was estimated based on the GPS results. While the DMU alternatives' different acceleration characteristics from conventional push-pull operations were considered, the model will assume that maximum speeds along the track are the same for both. MBTA commuter trains have a speed limit of 60 mph along any track, but they often don't reach this speed for several reasons. First, the distance between consecutive stations may not be
sufficient for a train to accelerate to 60 mph then safely decelerate to enter the following station. Second, geometric characteristics of particular segments of track such as curves may limit the actual possible speed despite the higher speed limit.
From the dataset of time and speed collected by GPS the maximum speed reached in an interval between two stations was selected and this was assigned as vmax for that segment. The corresponding travel times based on these speeds are later verified by comparing the model travel time estimates to the travel time registered by the GPS application. Table 4 shows the maximum speeds for each segment on the Worcester/Framingham mainline that was input into the spreadsheet model.
Table 4: Maximum Speeds (mph) by Segment
As seen in Figure 12 of the entire journey, trains that approach Worcester from Grafton reduce their speed for several miles, so for the model the Worcester-Grafton segment was broken
Worcester-Grafton 23-57 Grafton-Westborough 55 Westborough-Southborough 57 Southborough-Ashland 55 Ashland-Framingham 50 Framingham-West Natick 30 West Natick-Natick 50 Natick-Wellesley Sq 55
Wellesley Sq-Wellesley Hills 55
Wellesley Hills-Wellesley 50 Farms Wellesley Farms-Aubumdale 57 Auburndale-West Newton 50 West Newton-Newtonville 50 Newtonville-Boston 57 University Boston University-MIT 25-10 MIT-North station 25-10