HAL Id: tel-01169636
https://tel.archives-ouvertes.fr/tel-01169636
Submitted on 29 Jun 2015HAL is a multi-disciplinary open access archive for the deposit and dissemination of sci-entific research documents, whether they are pub-lished or not. The documents may come from teaching and research institutions in France or abroad, or from public or private research centers.
L’archive ouverte pluridisciplinaire HAL, est destinée au dépôt et à la diffusion de documents scientifiques de niveau recherche, publiés ou non, émanant des établissements d’enseignement et de recherche français ou étrangers, des laboratoires publics ou privés.
Interaction mechanisms of europium and nickel with
calcite
Andrea Sabau
To cite this version:
Andrea Sabau. Interaction mechanisms of europium and nickel with calcite. Other. Université Nice Sophia Antipolis, 2015. English. �NNT : 2015NICE4003�. �tel-01169636�
UNIVERSITE NICE SOPHIA ANTIPOLIS – UFR Sciences
Ecole Doctorale de Sciences Fondamentales et Appliquées
THESE
pour obtenir le titre de
Docteur en Sciences
de l’UNIVERSITE Nice Sophia Antipolis
Discipline : Chimie présentée par
Andrea SABǍU
Mécanismes d’interaction du nickel et
de l´europium avec la calcite
Interaction mechanisms of europium and nickel with calcite
Thèse dirigée par Prof. Nicolas MARMIER
Soutenue publiquement le 27 Mars 2015 devant le jury composé de
Président du Jury :
Dr. Vinzenz Brendler, Chercheur, Helmholtz-Zentrum Dresden Rossendorf, Institute of Resource Ecology Rapporteurs :
Dr. habil. Grégory Lefèvre, Chargé de recherche, Chimie ParisTech-CNRS Dr. habil. Isabelle Le Hécho, Maître de conférences, Université de Pau Examinateurs :
Dr. Nelly Toulhoat, Ingénieur-chercheur, CEA/IPNL, Université de Lyon Dr. Eric Giffaut, Ingénieur de recherche, ANDRA
Dr. Nicolas Marmier, Professeur, Université Nice Sophia Antipolis
Dr. Norbert Jordan, Chercheur, Helmholtz-Zentrum Dresden Rossendorf, Institute of Resource Ecology Dr. Claire Lomenech, Maître de conférences, Université Nice Sophia Antipolis
3
Acknowledgements
First, I would like to be thankful to Vinzenz Brendler for accepting to be the president of the jury for my Ph.D. defense. Beside this, I am thankfull for all discussions about science, for all advices and all the feedbacks for reports/presentations and other documents and all late meetings to prepare new stays in Dresden. I would like to be grateful to Grégory Lefèvre and Isabelle Le Hécho for having accepted to referee my thesis and to Nelly Toulhoat for taking part in the defense jury. First I would like to express my recognition to ANDRA for founding this thesis, and without which this project would not be possible. I would like to express my distinguish thanks Eric Giffaut from Transfert Division of ANDRA, who is responsible of project managing, for believing in my capacities and understanding me. I will not forget Scott Altman, for the scientific encouragements and discussions.
I would like to express my gratitude to all people who supported me during my thesis: my four Ph.D. advisors, for what I’ve learned from them, scientifically (but not only!) and for the autonomy to doing things in my way.
Nicolas Marmier – many thanks for all scientific advices, for his diplomatic touch and optimism.
Norbert Jordan – my sincere thanks for accepting me as your first Ph.D. student (hope this experience didn’t discourage you for future ...never knows!) for all long scientific discussions and advices, dedication, careful observation of my work and experiments performed over these years. Also, thank you for giving me a new vision about science and for all the precious time spend to correct all the documents/reports/presentations.
Claire Lomenech – my sincere thanks for your implication in this project and for your unconditioned scientific support over these years and for all the time you give to correct all my presentations, reports and my manuscript.
Also I am grateful to:
Nelly Toulhoat, Yves Pipon and Nathalie Moncoffre for their hospitality during my trips to Lyon and RBS measurements at INPL, for introducing me in RBS world and for all the corrections that they integrated to my manuscript.
4
Caroline Raepset for RBS preliminary measurements at IRAMIS.
Suzy Surblé for accepting the project and for a great introduction into IBA techniques; but also for all the explanations you give me during the long days and nights spent to the RBS facility to IRAMIS (CEA, Saclay).
Astrid Barkleit for introducing me in TRLFS and for fruitful discussions about this technique, and of course for all tips and corrections of my manuscript.
HZDR-IRE staff: Weiß Stephan (I’ll never forget your unconditioned scientific support!!!), Heim Karsten, Eckardt Carola, Müller Christa, Neubert Heidrun, Ritter Aline, Müller Katharina and Moll Henry.
All the people from other institutes of HZDR who helped me in various ways: Hübner René, Christalle Elfi and Scholtz Andrea.
I am happy to meet and to “grow up” in the wonderful team of ECOMERS Laboratory where Salomé, Brice, Inès, Yassine and Mehwish (...and others) supported me and helped me a lot to improve my French level. Thank you for still being my friends after various experiences and having the patience to tolerate me...I have a difficult character
Also, I would like to thank to Charlotte Hurel who integrated me very well in the team and who supported me in my difficult steps.
Sunt recunoscătoare părinţilor mei care m-au vegheat de la început. De la amandoi am învăţat cea mai importantă lecţie de viaţă: SǍ FII OM!
(I am grateful to my parents which have been behind of me from the very beginning. From both of them I learned the most important lesson of my life: to be human).
Per Roberto - Questo breve ringraziamento non basta a ripagare l’incondizionato sostengo e tuo amore datomi durante la stesura del mio lavoro di tesi in quest’ultimo anno.
5
Résumé en français
Mécanismes d’interaction de l´europium et du nickel avec la calcite
Le parlement français a adopté la loi du 30 décembre 1991 (dite loi Bataille) relative à la gestion des déchets radioactifs. L’Agence Nationale pour la gestion des Déchets RAdioactifs (l’ANDRA) s’est vue confiée l’axe 2 de cette loi, à savoir l’étude de la faisabilité de l’exploitation de laboratoires souterrains en formation géologique profonde, dans le but d’y stocker les déchets de Haute Activité à Vie Longue (HAVL) et de Moyenne Activité à Vie Longue (MA-VL). A cette fin, un laboratoire de recherche souterrain a été construit sur la commune de Bure (Meuse, France) au sein d’une formation argileuse du Callovo-Oxfordien (COx), à environ 490 m de profondeur.
Suite au bilan des travaux effectués durant quinze années, une nouvelle loi a été votée le 28 juin 2006. Cette dernière a confirmé la faisabilité du stockage réversible en formation géologique profonde. L´ANDRA est responsable de la conception et de l´implantation du centre de stockage dans le cadre du projet CIGEO (Centre Industriel de stockage GEOlogique).
Afin d´établir la sûreté d´un centre de stockages sur le long terme, il est nécessaire d´étudier et d´élucider les mécanismes régulant le transfert des radionucléides. Généralement, la sorption par des phases minérales gouverne la migration de ces éléments, de même que la dissolution des phases solides potentiellement formées. La sorption peut être considérée comme une première étape à cinétique rapide de la fixation des ions, mais les différentes étapes entre la chimie de surface et l’incorporation des ions sont encore peu comprises. Les mécanismes d’interaction entre cations et minéraux peuvent inclure des processus d’adsorption, de (co-) précipitation de surface, et aller jusqu’à l’incorporation au sein du matériau, ce qui peut entraîner l'irréversibilité de certaines réactions de sorption. Les argilites du COx sont constituées principalement de trois phases minérales: une phase argileuse (illite, smectite et micas), une phase carbonatée (principalement la calcite et l’ankérite) et le quartz. Les eaux interstitielles du COx ont un pH proche de la neutralité ou légèrement alcalin, imposé par les phases en présence.
Le minéral choisi pour cette étude est la calcite, présente dans les argilites du Callovo-Oxfordien et également produit d’altération des ciments, ce qui justifie son intérêt pour l’évaluation de la sûreté d’un site de stockage de déchets radioactifs en formation géologique profonde.
6
Le but de cette thèse est d´étudier et de quantifier les processus conduisant à l’incorporation de cations au sein d’une matrice carbonatée. L’accent a été mis sur la mise en évidence de l’existence
ou non de processus d’incorporation dans les systèmes Eu−NaCl−CO2–calcite et Ni−NaCl−CO2–
calcite, dans des conditions atmosphériques où le milieu tamponné par la calcite a un pH voisin de 8,3, et pour une partie de l’étude à pression partielle plus élevée de CO2 (10−2 atm), correspondant à la valeur d’équilibre au sein de la formation du COx. L’europium est choisi en tant qu’analogue pour certains actinides trivalents, ainsi que pour ses propriétés de fluorescence qui permettent l´utilisation de la Spectrométrie Laser à Résolution Temporelle (SLRT). Le nickel, notamment les isotopes 59Ni et 63Ni, est quant à lui un produit d’activation neutronique des composants métalliques du combustible irradié. Notre étude combine des expériences macroscopiques de type batch et des études spectroscopiques (SLRT et spectrométrie de rétrodiffusion de Rutherford - RBS) pour caractériser les systèmes choisis. Des observations complémentaires en microscopie électronique à balayage (MEB) des surfaces minérales couplées à des analyses EDXS ont également été menées, afin d´évaluer l´homo/hétérogénéité des échantillons.
Dans un premier temps, une caractérisation poussée de calcites sous forme de poudres (en provenance de différentes sources) nous a permis de sélectionner un matériau de départ approprié pour les expériences de sorption et de spectroscopie. Une calcite SOLVAY (SOCAL U1-R), avec une taille de particule fine et une surface spécifique élevée (18,4 m2/g), a été retenue pour les expériences de SLRT. Pour les expériences RBS, notre choix s´est porté sur la calcite OMYA (BL 200), avec une taille de particule plus élevée et une surface spécifique de 0,66 m2/g. Afin d’éviter la présence d’artefacts sur des échantillons de calcite compactés au cours des mesures RBS, nous avons également choisi de travailler avec des cristaux millimétriques de calcite (Alfa Aesar).
L’absence de contamination majeure et d’autres polymorphes de CaCO3 (vatérite, aragonite) a été
confirmée par DRX, ATR-FT-IR et ICP-MS après digestion.
Les études de sorption de l’europium et du nickel ont ensuite été menées, avec préalablement une étude de la chimie en solution carbonatée de ces deux éléments dans les conditions des expériences. Le comportement de l’europium en solution a été étudié en milieu carbonaté obtenu à l´aide de solutions pré-équilibrées avec la calcite. L’étude a porté notamment sur l’influence de la concentration initiale et du temps de contact. Ceci a servi de référence et de support afin de mieux appréhender l’interaction de l’europium avec la calcite. Les calculs de spéciation faits sous conditions atmosphériques à pH=8,3 en utilisant une gamme de concentrations variant de 10−6 à
7
10−3 mol.L−1 ont prédit une précipitation de l’europium sous la forme de Eu2(CO3)3:3H2O(s) et Eu(CO3)OH(s), à 10−3 mol.L−1 et à ≤ 10−4 mol.L−1 Eu(III) initiale, respectivement. Ces calculs ont été confirmés par des expériences à l’échelle macroscopique qui ont révélé une précipitation de l’Eu(III) pour des concentrations supérieures à 10−5 mol.L−1. A 10−6 mol.L−1, aucune précipitation n’a été observée. La formation de Eu2(CO3)3:3H2O(s) et Eu(CO3)OH(s), a été confirmée par TRLFS et DRX.
Les expériences de sorption de l’europium ont été menées sous conditions atmosphériques (pCO2
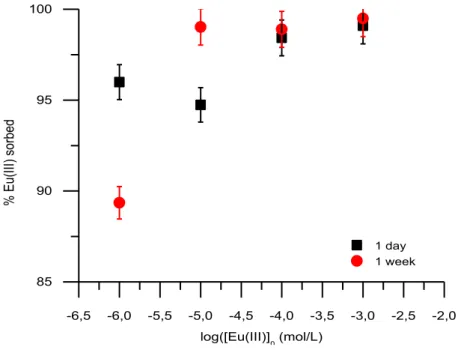
= 10−3.5 atm) en milieu NaCl 10−1 mol.L−1, pour des concentrations d’europium variant de 10−3 (en sursaturation) à 10−6 mol.L−1 et des temps de contact variant de quelques heures à 6 mois. Les analyses ICP-MS/ICP-AES des surnageants ont montré un taux de rétention de l’Eu(III) par la calcite supérieur à 95 % quelles que soient les conditions expérimentales utilisées dans cette étude.
Les résultats de SLRT montrent un comportement différent de l’europium en fonction de la concentration initiale et du temps de contact. Pour les concentrations les plus élevées (supérieures à 10−4 mol.L−1), les espèces identifiées semblent correspondre à un (co-)précipité de surface et un complexe de surface. Pour les concentrations plus faibles (inférieures à 10−5 mol.L−1), les temps de vie observés sur l’une des espèces, beaucoup plus longs, semblent indiquer une incorporation de l´europium au sein du matériau.
Des expériences par RBS ont également été effectuées sur millisonde nucléaire à l’Institut de Physique Nucléaire de Lyon, ainsi que sur microsonde au CEA-Saclay en utilisant des concentrations initiales en Eu(III) de 10−4 et 10−5 mol.L−1 sur monocristaux. Cette technique est bien adaptée pour discriminer les processus de sorption tels que: (i) adsorption ou (co)-précipitation sur les surfaces minérales ou (ii) incorporation dans la structure minérale (grâce à la diffusion par exemple).
Les résultats RBS ont démontré une accumulation de l’Eu(III) à la surface, probablement sous la forme d’un co-précipité de surface. La distribution hétérogène de l’Eu(III) à la surface de la calcite a été établie par des mesures SEM-EDXS complémentaires. Cette accumulation de surface est accompagnée d’une incorporation de l'Eu(III) dans la calcite sur une profondeur allant jusqu’à 250 nm après 2 mois de contact pour les échantillons à 10−5 mol.L−1 et 5 mois de contact pour les échantillons à 10−4 mol.L−1. Les profils de concentration ont été modélisés en utilisant des coefficients de diffusion apparents, de l’ordre de 10−22 – 10−21 m².s−1 et incompatibles avec un mécanisme de diffusion.
8
La rétention de l’europium dans la calcite semble procéder par trois mécanismes différents, au vu des mesures SLRT, RBS et SEM-EDXS : (i) l'accumulation hétérogène de surface ((co-)précipité de surface), (ii) la formation d’un complexe de sphère interne et (iii) l'incorporation dans le solide, vraisemblablement par un processus de dissolution/re-précipitation pour former une solution solide.
Le comportement du nickel en solution carbonatée a été étudié dans des solutions pré-équilibrées avec la calcite, en fonction de la concentration initiale et du temps de contact. La précipitation du nickel a été observée pour des concentrations initiales comprises entre 10−5 et 10−3 mol.L−1,
contrairement à 10−6 mol.L−1 pour laquelle le nickel ne précipite pas. La formation de Ni(OH)2(s)
pour une concentration initiale de 10−3 mol.L−1 a été confirmée par DRX, conformément aux calculs de spéciation. La précipitation du nickel s’est avérée être un processus à cinétique lente pouvant durer jusqu’à plusieurs mois.
Les expériences de sorption en batch pour des concentrations du nickel variant de 10−6 à 5×10⁻⁵
mol.L−1 ont abouti à des taux de sorption élevés (>65%) et des taux moins élevés (40 %) pour 10−4
mol.L−1 et 5×10⁻⁴ mol.L−1 pour un rapport masse de calcite/volume de suspension égal à 1 g.L−1. Pour toutes les concentrations étudiées, une désorption du nickel a été observée. Les indices de désorption ont révélé une réversibilité quasi-totale pour les faibles concentrations (<10−5 mol.L−1). Le degré d’irréversibilité augmente avec la concentration initiale en nickel. Les expériences de sorption et de désorption en fonction du temps, couplées au calcul d’un indice de désorption, ont permis de mettre en évidence un mécanisme de sorption composé de deux processus: (i) un processus d’adsorption, rapide et réversible (ii) un mécanisme plus lent et partiellement réversible, probablement une précipitation de surface.
Une accumulation du nickel à la surface de monocristaux de calcite a été observée par milli et µ-RBS, avec une distribution hétérogène du nickel, confirmée par des mesures MEB-EDXS. Cette observation serait en accord avec les mécanismes proposés sur la base des expériences de sorption/désorption en batch, c’est-à-dire de l’adsorption et /ou de la précipitation de surface. La distribution non uniforme d’un précipité de surface Ni(OH)2(s) expliquerait les différences observées par la RBS et le SEM-EDXS en fonction du temps de contact.
9
Table of contents
List of Figures ... 11
List of Tables ... 17
Context of the study ... 21
Radioactive waste - where does it come from? ... 21
Radioactive waste management in France ... 21
Purpose of the work ... 22
1.
State of the art ... 29
1.1. Calcite: environmental occurrence and significance, structure and surface reactivity ... 29
1.1.1. Environmental occurrence and significance ... 29
1.1.2. Structure of calcite ... 30
1.1.3. Surface reactivity of calcite ... 32
1.2. Lanthanide: europium ... 35
1.2.1. Aqueous chemistry of europium ... 35
1.2.2. Eu(III) sorption onto calcite ... 41
1.3. Transition metal: nickel ... 47
1.3.1. Aqueous chemistry of nickel ... 47
1.3.2. Ni(II) sorption onto calcite ... 49
2.
Experimental details ... 57
2.1. Reagents and solutions ... 57
2.2. Choice of the adsorbent - calcite ... 58
2.3. Characterization of the selected calcite materials ... 59
2.3.1. XRD characterization of SOLVAY (SOCAL U1-R), OMYA (BL 200) and Alfa Aesar calcites ... 59
2.3.2. Infra-red characterization of SOLVAY (SOCAL U1-R) and OMYA (BL 200) calcites .... 62
2.3.3. SEM characterization of SOLVAY (SOCAL U1-R) and OMYA (BL 200) calcites ... 63
2.3.4. Total digestion of SOLVAY (SOCAL U1-R), OMYA (BL 200) and Alfa Aesar calcites . 65 2.4. Preparation of samples ... 66
2.4.1. Preparation of calcite-equilibrated suspensions (CES) ... 66
2.4.2. Preparation of calcite pre-equilibrated solutions (CPES) ... 66
2.4.3. Preparation of calcite single-crystals pre-equilibrated solutions (CSC-PES) ... 67
2.5. Experimental setup and procedure for blanks experiments ... 68
2.6. Experimental setup and procedure for batch sorption experiments ... 68
2.7. Spectroscopic elucidation of Eu(III) and Ni(II) interaction with calcite ... 71
2.7.1. TRLFS study ... 71
2.7.2. RBS study ... 72
3.
Interaction of europium with calcite ... 77
3.1. Solution chemistry of europium... 77
3.1.1. Speciation calculations ... 77
3.1.2. Eu(III) speciation in CPES solution: macroscopic results ... 82
3.1.3. Eu(III) speciation in CPES solution: TRLFS and XRD results ... 83
3.2. Interaction of Eu(III) with calcite: macroscopic studies ... 94
10
3.3.1. Experiments under pCO2=10−3.5 atm... 96
3.3.2. Experiments under pCO2=10−2 atm... 103
3.3.3. Experiments with calcite single crystals in CPES solutions under pCO2=10−3.5 atm ... 107
3.4. RBS and SEM-EDXS study of Eu(III) interaction with calcite ... 111
3.4.1. RBS milli-beam study of Eu(III) interaction with calcite powders ... 111
3.4.2. RBS milli-beam and SEM-EDXS study of Eu(III) interaction with calcite single crystals Eu(III) ... 114
3.4.3. RBS μ-beam and SEM-EDXS study of Eu(III) interaction with calcite single crystals .... 120
3.5. Summary and conclusions ... 135
4.
Interaction of nickel with calcite ... 141
4.1. Solution chemistry of nickel ... 141
4.1.1. Speciation calculations ... 141
4.1.2. Nickel speciation in CPES: macroscopic results and XRD ... 145
4.2. Interaction of Ni(II) with calcite: macroscopic studies... 148
4.2.1. Sorption isotherms... 148
4.2.2. Desorption studies ... 152
4.3. Interaction of Ni(II) with calcite: spectroscopic studies ... 158
4.3.1. Milli-beam RBS study on calcite powders ... 158
4.3.2. Milli-beam RBS study on single crystals ... 159
4.3.3. µ-beam RBS and SEM-EDXS studies on single crystals ... 161
4.4. Summary and conclusions ... 167
Conclusions ... 173
Bibliographic references ... 181
Appendix A: Analytical and standard spectroscopic methods ... 193
A.1. Specific surface area (SSA) and total organic carbon (TOC) determination ... 193
A.2. X-ray diffraction (XRD) ... 193
A.3. Infra-red (IR) spectroscopy ... 195
A.4. Inductively Coupled Plasma Mass Spectrometry (ICP-MS) and Inductively Coupled Plasma – Optical Emission Spectrometry (ICP-OES)... 196
A.5. Scanning Electron Microscopy (SEM) ... 196
A.6. Scanning Electron Microscopy coupled with Energy Dispersive X-ray Spectroscopy (SEM-EDXS) ... 198
Appendix B: Principle of Time Resolved Laser-induced Fluorescence
Spectroscopy (TRLFS) ... 199
B.1 The fluorescence ... 199
B.2 Correlation between luminescence lifetime and water molecules calculations ... 201
B.3 TRLFS measurements with Eu(III) ... 202
Appendix C: Principle of Rutherford Backscattering Spectrometry ... 205
C.1 Presentation of the technique ... 205
C.2 Description of the experimental conditions ... 207
C.2.1 Experiments performed at IPN Lyon... 207
C.2.2 Experiments performed at CEA Saclay / LEEL ... 208
11
List of Figures
Figure 1.1: Structure of calcite [34]. ... 31
Figure 2.1: XRD pattern for SOLVAY (SOCAL U1-R) (black) and OMYA (BL 200) (red) calcites, with reference pattern of calcite (blue), ICDD card 01-083-0577. ... 60
Figure 2.2: Experimental X-ray powder pattern (black) of a crystal, with reference pattern of calcite (red), ICDD card 01-083-0577. ... 61
Figure 2.3: Optical photograph of one of the investigated native calcite crystals with face indexes. ... 62
Figure 2.4: IR spectra of SOLVAY (SOCAL U1-R) and OMYA (BL200) calcites. ... 63
Figure 2.5: SEM image of SOLVAY (SOCAL U1-R) calcite at different scales. ... 64
Figure 2.6: SEM image of OMYA (BL 200) calcite at different scales. ... 65
Figure 2.7: Experimental setup for calcite pre-equilibration. ... 67
Figure 2.8: Experimental set-up for sorption experiments onto calcite single-crystals: clip containing the trapped crystal (left) and several clips in a vial (right). ... 69
Figure 3.1: Chemical distribution of Eu(III) species as a function of the initial concentration(left ordinate) and saturation indexes for possible precipitated species (right ordinate) (I=10−1 mol.L−1 (NaCl), pCO2 = 10−3.5 atm, pH=8.3±0.1). ... 80
Figure 3.2: Chemical distribution of Eu(III) as a function of pH (left ordinate) and saturation indexes (right ordinate)for different initial concentrations (( Eu 0 = 10 3 (A), 10 4 (B), 10 5 (C) and 10 6 (D) mol.L−1 ) (I=10−1 mol.L−1 (NaCl), pCO2 = 10−3.5 atm). ... 81
Figure 3.3: Percentage of Eu(III) precipitating as a function of time for different initial concentrations (left ordinate) and pH of the suspensions (right ordinate). ... 82
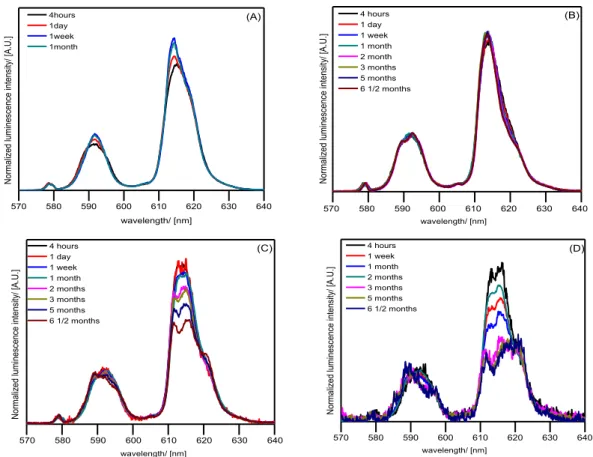
Figure 3.4: Luminescence emission spectra of Eu(III) suspensions as a function of initial Eu(III) concentration, 10−3 mol.L−1 (A), 10−4 mol.L−1 (B), 10−5 mol.L−1 (C) and 10−6 mol.L−1 (D). ... 84
Figure 3.5: Left: Luminescence emission spectra of 10−3 mol.L−1 Eu(III) suspensions at pH ranging from 6.7 to 6.4 for different contact times (1 day, 1 week and 2 weeks). Right: Luminescence emission spectra of solids characterized by Runde et al. [56]. ... 85
Figure 3.6: Luminescence emission spectra of 10−3 mol.L−1 Eu(III) supernatants as a function of stirring time, having the pH range between 6.6 and 6.1 pCO2=10−3.5 atm. ... 88
Figure 3.7: XRD diffraction patterns of the precipitates obtained from 10−3 mol L−1 Eu(III) after 1 week (A), 10−3 mol L−1 Eu(III) after 1 month (B) and 10−4 mol L−1 Eu(III) after 1 month (C). ... 91
12
Figure 3.8: Percentage of Eu(III) precipitating as a function of time for different initial concentrations (left ordinate) and pH of the suspensions (right ordinate), with the identification of precipitating phases and their evolution with time. ... 93 Figure 3.9: Sorption of Eu(III) onto calcite ( Eu 0 = 10 6, 10 5, 10 4 and 10 3 mol.L−1, I=10−1 mol.L−1 (NaCl), pCO2 = 10−2 atm, pH=7.5±0.1, s/L=1 g.L−1). ... 95 Figure 3.10: Luminescence emission spectra of Eu(III) suspension (black) and supernatant (blue) ( Eu 0 = 10 3 (A), 10 4 (B), 10 5 (C) and 10 6 (D) mol.L−1, I=10−1 mol.L−1 (NaCl), s/L =5 g.L 1, pCO2 = 10−3.5 atm, pH=8.3±0.1, t = 4 hours... 97 Figure 3.11: Luminescence emission spectra of Eu(III) sorbed onto calcite( Eu 0 = 10 3 mol.L−1 (A),10 4 mol.L−1 (B), 10 5 mol.L−1 (C) and 10 6 mol.L−1 (D), I=10−1 mol.L−1 (NaCl),
s/L = 5 g.L 1for samples 4 hours – 1 month and 1 g.L 1 for samples after 1 month. pCO2 =
10−3.5 atm, pH=8.3±0.1). ... 98
Figure 3.12: Time−resolved luminescence spectra (left) and decay curve (right) of [Eu(III)]0=
10−4 mol.L−1, I=10−1 mol.L−1, s/L=5.g.L−1 CaCO3 , pCO2 = 10−3.5 atm, pH=8.3±0.1, t=1 month. ... 99 Figure 3.13: Luminescence emission spectra (A) 10−3 mol.L−1 Eu(III), (B) 10−4 mol.L−1 Eu(III), (C) 10−5 mol.L−1 Eu(III) and (D) 10−6 mol.L−1 Eu(III) sorbed on calcite (1 g.L−1), stirred for 1 day and 7 days under pCO2=10−2 atm. ... 103 Figure 3.14: Normalized spectra of 10−4 mol.L−1 Eu(III), sorbed on calcite (1 g.L−1 CaCO3)
stirred for 1 day under pCO2=10−2 atm. The black lines represent the suspension and the red
line the supernatant. ... 105
Figure 3.15: Luminescence emission spectra of Eu sorbed on calcite single crystals (A) 10−4
mol.L−1, (B) 10−5 mol.L−1 and (C) 10−6 mol.L−1 Eu(III) under atmospheric condition (pCO2=10−3.5 atm), pH=8.3±0.1. ... 107 Figure 3.16: Time−resolved luminescence spectra (left) and time decay curve (right) of [Eu(III)]0= 10−4 mol.L−1, CaCO3 single crystal, I=10−1 mol.L−1 NaCl, pCO2 = 10−3.5 atm, pH=8.3±0.1 and t=1 month. ... 108
Figure 3.17: RBS spectra of 10−3 mol.L−1 Eu(III) reacted one month with calcite OMYA (A)
and SOLVAY (B) at pH=8.3±0.1. ... 112 Figure 3.18: Schematic representation of the artifacts on powder samples ... 113 Figure 3.19: Images obtained by optical microscope of grain distribution of powder OMYA (BL 200) calcite general view (left) and a zoom of one selected zone (right). ... 114 Figure 3.20: RBS spectra of virgin calcite (left) and Eu(III) (initial sorption with 10−4 mol.L−1 solution during 1 month) in calcite single crystals (right). ... 115
13
Figure 3.21: Depth concentration profiles of Eu(III) (initial sorption with 10−4 mol.L−1 solution during 1 week and 1 month) reacted with calcite single crystals. Lines are only plotted to guide the eyes. ... 116 Figure 3.22: SEM photographs of calcite single crystal at 100 µm (A) and 10 µm (B) scales.117 Figure 3.23: SEM images of a crystal reacted with Eu(III) 10−4 mol.L−1 during 1 month: general view (A) and zoom on three different regions of the sample surface (B, C, D). ... 118
Figure 3.24: EDXS spectrum of 10−4 mol.L−1 Eu(III) on a single crystal, pH=8.3±0.1 (fixed by
adding NaOH) and 1 month stirring time. ... 119 Figure 3.25: RBS spectra of calcite single crystals after reacting with 10−5 mol.L−1 Eu(III) for 24 hours, 1 week, 2 weeks and 2 months... 121 Figure 3.26: Depth concentration profiles of Eu(III) (initial sorption with 10−5 mol.L−1 solution during 24 hours, 1 week, 2 weeks and 2 months) on calcite single crystals. Lines are only plotted to guide the eyes... 122 Figure 3.27: SEM image of a calcite crystal reacted with 10−5 mol.L−1 Eu(III), pH=8.3±0.1 and 2 months stirring time with a magnification of 50 µm (A), 10 µm (B) and 2 µm (C). ... 123 Figure 3.28: EDXS spectrum of a calcite crystal reacted with 10−5 mol·L−1 Eu(III), pH=8.3±0.1 and 2 months stirring time measured in one position. ... 124
Figure 3.29: Eu(III) RBS elemental maps of 10−5 mol.L−1 Eu(III) on calcite, in surface and
depth: (A) 24 hours and (B) 2 months. The concentration is presented as a function of the color, from less concentrated on bottom to more concentrate on the top. ... 125 Figure 3.30: RBS spectra of calcite single crystals after reacting with 10−4 mol.L−1 Eu(III) for 24 hours, 2 weeks, 1 month, 2 months and 5 months. ... 127 Figure 3.31: Depth concentration profiles of Eu(III) (initial sorption with 10−4 mol.L−1 solution during 24 hours, 2 weeks 1 month, 2 months and 5 months) in calcite single crystals. Lines are only plotted to guide the eyes. ... 128
Figure 3.32: SEM images of a calcite crystal reacted with 10−4 mol.L−1 Eu(III), pH=8.3±0.1
and 5 months stirring time with a scale of 50 µm (A), 10 µm (B) and 2 µm (C). ... 129
Figure 3.33: Eu(III) RBS elemental maps of 10−4 mol·L−1 Eu(III) on calcite, in surface and
depth : (A) 24 hours, and (B) 5 months. ... 131 Figure 4.1: Concentration of aqueous species and saturation indices of solid phases as a function of the Ni(II) initial concentration (10−1 mol.L−1 NaCl, pCO2 10−3.5 atm and pH 8.3).143 Figure 4.2: Concentration of aqueous species and solid phase as a function of the Ni(II) initial concentration (10−1 mol.L−1 NaCl, pCO2=10−3.5 atm and pH=8.3). ... 144
Figure 4.3: Concentration of aqueous species and saturation indexes of solid phases at 10−4
14
Figure 4.4: Concentration of Ni(II) left in supernatant for CPES solutions as a function of stirring time, for initial Ni concentrations of 10−3 mol.L−1 (pH = 8.1-8.3) (A), 10−4 mol.L−1 (pH = 8.3-8.4) (B), 10−5 mol.L−1 (pH = 8.3-8.4) (C) and 10−6 mol.L−1 (pH = 8.3-8.4) (D) (pCO2 = 10−3.5 atm, I = 0.1 mol.L−1 (NaCl)). ... 146 Figure 4.5: XRD of the solid phase precipitating after 104 days from a CPES solution spiked with 10−3 mol.L−1 Ni(II), with reference pattern of Ni(OH)2(s) (red) (ICDD card 01-075-6921) and NiCO3(s) (blue) (ICDD card 98-002-1690). ... 147 Figure 4.6 :Nickel isotherms for various contact times: (A) 1 day, (B) 4 days, (C) 1 week, (D) 2 weeks, (E) 3 weeks, (F) 4 weeks, (G) 6 weeks, (H) 8 weeks, (I) 10 weeks, (J) 12 weeks, and (K) 15 weeks ... 150 Figure 4.7: Nickel sorption onto calcite ([Ni]0 = 10−6, 5×10⁻⁶, 10−5, 5×10⁻⁵, 10−4, 2.5×10⁻⁴, 5×10⁻⁴ mol.L−1, s/L = 1 g.L−1 CaCO3 (SOLVAY), I = 10−1 mol.L−1 (NaCl), pH = 8.3-8.4 and stirring time 1 day – 15 weeks)... 151 Figure 4.8: Desorbed fractions for Ni(II) as a function of stirring time and Ni(II) initial adsorbed concentration (10−6 mol.L−1 – red, 5×10⁻⁶ mol.L−1 – blue, 10−5 mol.L−1 – pink, 5× 10⁻⁵ mol.L−1 – green, 10−4 mol.L−1 – orange and 5×10⁻⁴ mol.L−1 – black). ... 153 Figure 4.9: Desorption indexes as a function of desorption time, for Ni initial concentrations ranging from 10−6 mol.L−1 to 5.10−4 mol.L−1, for 4 durations of the sorption step (■: 1 day, ●: 1 week, ▲: 1 month and ▼: 2 months). The horizontal lines on the graphs stands for the mean value of the desorption indices for each concentration. ... 155 Figure 4.10: Mean desorption indexes as a function of Ni(II) initial concentration. ... 156 Figure 4.11: RBS spectra of calcite powder OMYA (BL 200) after 1 month contact time with 10−3 mol.L−1 Ni(II). ... 158
Figure 4.12: RBS spectrum of one calcite single crystal after 3 weeks contact time with 10−3
mol.L−1 Ni(II) and pH = 8.3±0.1 (adjusted by NaOH) (experimental spectra – black and simulated – red). ... 159 Figure 4.13: Depth concentration profiles of Ni(II) (sorption with 10−3 mol.L−1 solution during 1 week (▼) and 3 weeks (♦) in calcite single crystals. Lines are only plotted to guide the eyes. ... 160 Figure 4.14: Ni(II) elemental maps in surface and depth obtained for 10−4 mol.L−1 Ni(II), 1 week contact time, extracted from RBS spectra. ... 162 Figure 4.15: Ni(II) elemental maps in surface and depth obtained for 10−4 mol.L−1 Ni(II), 1 month contact time, extracted from RBS spectra. ... 162 Figure 4.16: RBS spectrum of a calcite single crystal after 1 week contact time with 10−4 mol.L−1 Ni(II) (experimental spectra – black and simulated – red). ... 163 Figure 4.17: SEM images at different scales: 50 µm (A), 10 µm (B) and 2 µm (C) of 10−4 mol.L−1 Ni(II) sorbed onto calcite single crystal during 1 month. ... 164
15
Figure 4.18: Ni(II) elemental maps in surface and depth obtained for 10−4 mol.L−1 Ni(II), 1 month contact time, extracted from RBS spectra. ... 165 Figure 4.19: Ni(II) elemental maps in surface and depth obtained for 10−3 mol.L−1 Ni(II), 2 months contact time, extracted from RBS spectra. ... 165
Figure 4.20: SEM images of 10−3 mol.L−1 Ni(II) sorbed onto calcite single crystals during 1
17
List of Tables
Table 0.1: Classification of radioactive waste [1]. ... 21
Table 1.1: Solubility products of calcium carbonates at 25 °C... 30
Table 1.2: Eu(III) literature lifetimes for aqueous Eu(III) hydroxo species. ... 38
Table 1.3: Eu(III) literature lifetimes for aqueous Eu(III) carbonate species. ... 39
Table 1.4: Eu(III) literature lifetimes for Eu(III) hydroxide, hydroxo-carbonate and carbonate solid phases. ... 40
Table 1.5: Literature lifetimes of Eu(III) species in interaction with CaCO3 solids. ... 45
Table 1.6: Literature lifetimes of Eu(III) species in interaction with different solids. ... 46
Table 2.1: Specific surface area and TOC of commercial and natural calcites. ... 58
Table 2.2: Specific surface area of commercial and natural calcites. ... 59
Table 2.3: Summary of experimental conditions for batch experiments. ... 70
Table 3.1: Eu(III) aqueous species and their equilibrium constants (I = 0) used for speciation calculations. ... 79
Table 3.2: Eu(III) solid phases and their equilibrium constants (I = 0) used for speciation calculations. ... 79
Table 3.3: Summarized lifetimes (µs) and number of water molecules of Eu(III) complexed with carbonates as a function of [Eu(III)]0 and stirring time (measurements performed on suspensions). ... 86
Table 3.4: Summarized lifetimes (µs) and number of water molecules of Eu(III) complexed with carbonates as a function of [Eu(III)]0 and stirring time (measurements performed on supernatants). ... 89
Table 3.5: Luminescence lifetimes and corresponding number of water molecules of Eu(III) sorbed onto calcite as a function of time (s/L=1 and 5 g.L−1, pCO2 = 10−3.5 atm, pH=8.3±0.1).100 Table 3.6: Luminescence lifetimes of Eu(III) sorbed onto calcite under pCO2=10−2 atm and [Eu(III)]0 = 10−3, 10−4, 10−5 and 10−6 mol.L−1. ... 104
Table 3.7: Luminescence lifetimes and corresponding water molecules of Eu(III) sorbed onto calcite single crystals. ... 109
Table 3.8: Summary of Eu(III) surface concentrations measured by EDXS for 10−4 mol.L−1 Eu(III). ... 129
18
Table 4.1: Ni(II) aqueous species and their equilibrium constants (I = 0) used for speciation calculations. ... 141 Table 4.2: Ni(II) solid phases and their equilibrium constants (I = 0) used for speciation calculations. ... 142 Table 4.3: Ni(II) concentrations (at. %) in surface and in depth for calcite single crystals immersed in 10−3 mol.L−1 Ni(II) for 1 week and 3 weeks. ... 161 Table 4.4: Ni(II) concentrations (at. %) in surface and in depth for calcite single crystals immersed in 10−4 mol.L−1 Ni(II) for 1 week and 1 month. ... 163 Table 4.5: Ni(II) concentrations (at. %) in surface and in depth for calcite single crystals immersed in 10−3 mol.L−1 Ni(II) for 1 month and 2 months... 166
19
21
Context of the study
All anthropogenic activities produce waste. Nuclear waste is all the radioactive material that should be stored in special conditions. France has been one of the first countries to vote a law in December 1991 (loi Bataille), regarding the repository of the nuclear waste, especially high-level ones.
Radioactive waste - where does it come from?
Most of the waste is coming from nuclear activities, such as nuclear energy production (fission of 235U) or scientific research activities. From these activities, some isotopes like 239Pu, 237Np, 241Am, 243Am, 244Cm, 245Cm, 129I are formed in reactor fuel assemblies. The various type of the radioactive waste produced in France vary by their activity and half-life (Table 0.1). The treatment and the final disposal solution must be therefore adapted to each type of waste.
Table 0.1: Classification of radioactive waste [1].
Radioactive waste management in France
The law voted in 1991 (research in radioactive waste management) organized the research focusing on nuclear waste management in three axes:
separation and transmutation of long-lived elements
22
reversible disposal of intermediate level long lived (IL–LL) and high level (HL) waste in deep geological formation
The first point refers to reduce the volume and the harmfulness of radioactive waste, by transforming it in isotopes with a lower activity and/or much shorter half-life. The second point refers to design new storage installation or to improve the existent surface storage sites to meet the requirements imposed by the law. These two axes were assigned to the CEA (Commissariat à l'énergie atomique et aux énergies alternatives).
The last axis is aiming at proving the capacities of geological formations to store the IL-LL and HL radionuclides. The French National Radioactive Waste Management Agency (ANDRA-Agence Nationale pour la Gestion des Déchets RAdioactifs), the public institution in charge of the radioactive waste management, was responsible of this topic.
ANDRA has performed feasibility studies in two clay rock (Bure and Marcoule, in Meuse/Haute-Marne and Gard districts, respectively) and one granitic (La Chapelle-Bâton, in Vienne district) geological formations. Studies have established weak robustness of a disposal project in granite in Vienne district. Among the two clay rock formations, it was concluded that the Callovo-Oxfordian (COx) geological formation (Bure) is the best solution in France.
Based on the strategy act of law voted in 2006 (program on sustainable management of radioactive materials and waste), ANDRA has the mission to design and implement a repository in the COx formation to store IL–LL and HL waste. This project is called CIGEO (Centre Industriel de stockage GEOlogique) and is based on the studies regrouped in Dossier 2005 Argile [2, 3].
Purpose of the work
Proving the safety of a nuclear waste repository requires a better understanding of migration of pollutants into environment and the processes occurring there. Generally, the sorption of radioelements onto mineral phases controls their migration together with solubility of the solid bearing phases formed.
The pore waters in the COx (Callovian Oxfordian) clay rocks impose equilibrium of the investigated system. The presences of the carbonates in the system impose a pH close to neutral or
23
alkaline. The COx clay rocks are made of three main mineralogical phases: argillaceous phase (illite, smectite et micas), carbonate phase (mainly calcite) and quartz.
Interactions between cations and natural or synthetic CaCO3 – calcite (including aragonite) may include processes like adsorption, surface (co)-precipitation up to incorporation within the material, which may cause irreversibility of some uptake reactions.
The interest of this Ph.D. is based on the capacity of calcite to sorb heavy metal contaminants such as transition metals (in particularly nickel as activation product) and lanthanides (especially europium as analogue for trivalent actinides) over a long time scale and to characterize the mechanisms occurring at the solid/liquid interface.
Calcite has already been shown to be an appropriate material to strongly retain europium [4-7]. There are studies determining the partition coefficient [8] of sorbed Eu(III) onto calcite powders [7], but these empirical values do not give information about the structure of the element on the surface of the investigated solid or the on-going mechanisms. Studies characterizing the Eu(III) interaction with calcite at spectroscopic level are scarce [4, 6, 7, 9, 10]. Due to the fact that Eu(III) ionic radii (95 pm) is close to Ca ionic radii (100 pm), Eu(III) can be incorporated into calcite by isomorphic substitution. This was observed by Marques-Fernandes et al. [4], who synthesized calcite in presence of Eu(III) traces (using the mixed-flow reactor procedure), by means of Time-Resolved Laser Fluorescence Spectroscopy (TRLFS).
Ni(II) interaction with calcite and its sorption on calcite has been presented as an ionic exchange
process with Ca2+ ions or metal complexation with CO32− groups on a hydrated surface layer [11].
Hoffmann and Stipp [12] came to a similar conclusion from their study of the mechanisms of Ni(II) incorporation, using surface sensitive techniques. Carlsson and Aalto [13] studied Ni(II) co-precipitation with calcite by liquid scintillation counting and observed Ni incorporation during re-crystallization. The sorption and reversibility of the nickel-calcite system was investigated for various pH scales and different ionic strengths by Lamana [14] and Zachara [11] who noted that Ni(II) sorption increases with pH and is not desorbing readily.
Although some information is available, a series of open questions are still existent about Eu(III) and Ni(II) interaction with calcite:
24
How does contact time and concentration influence Eu(III)/Ni(II) interaction with calcite? Is there an irreversible process over time?
Which conditions promote surface complexation and surface precipitation?
Which mechanisms could lead to incorporation of Eu(III)/Ni(II) into calcite? Is it possible that a solid state diffusion of these elements occur in calcite, as shown by S. Stipp and collaborators for other elements (i.e. Cd2+, Zn2+) [15, 16]?
Our approach to answer these main questions is to investigate the mechanisms governing the interaction of Eu(III)/Ni(II) at the calcite interface both from a macroscopic and a microscopic approach. The methodology developed consists into designing appropriate time-dependency batch sorption experiments on calcite powders and single crystals with Eu(III) and Ni(II) solutions at different concentrations. Indeed, if the mechanisms depend on the concentration, they might be different in the near field where the concentrations of radionuclides can be rather high, and in the far field where the concentrations are always very low. Then, spectroscopic techniques such as TRLFS and RBS (Rutherford Backscattering Spectrometry) were applied to characterize the systems at the molecular level. While TRLFS has been extensively used to study Eu(III) speciation, RBS is a spectroscopic tool well adapted to obtain information on the depth distribution of elements from the upmost surface layers to the bulk of solids – it has for example been used to study diffusion of Eu in clay minerals [17]. Therefore, it should be a powerful tool to characterize and quantify the incorporation of Eu/Ni in calcite. Additional techniques such as SEM, SEM-EDXS were used in the study to help us to have a better understanding of the interaction mechanisms. This work is regrouped in four chapters. The first chapter sums up the existent bibliographic data of calcite, europium and nickel. The structure, aqueous behavior and reactivity of calcite are highlighted. For each element, the aqueous chemistry, complexation with carbonates and interaction with calcite are presented in order to have an overview of the investigated system. The second chapter regroups as a first step a careful characterization of each type of calcite that was used in this study. Then, the second step is a detailed description about the experimental procedure for sorption and spectroscopic experiments.
25
Chapter three presents all the results obtained on Eu(III). The first part presents the speciation diagrams and the macroscopic data of complexation of Eu(III) with carbonates together with TRLFS studies supported by XRD (X-Ray Diffraction). The second part is dedicated to Eu(III) interaction with calcite under several conditions, which are carefully presented from macroscopic and spectroscopic point of view. TRLFS and RBS results are detailed together with SEM-EDXS and compared with macroscopic ones in order to identify the mechanisms occurring in this system. The last chapter is dedicated to Ni(II). The first part is presenting the complexation of Ni(II) with carbonates, then a detailed sorption/desorption study gives the macroscopic results. A detailed RBS study is presented as well, completed with SEM-EDXS investigations.
27
Chapter 1:
State of the art
29
1. State of the art
The mobility of elements in natural systems strongly depends on the geological environment and both on their solution chemistry and sorption properties. Different group of elements exhibit a particular reactivity toward calcite, giving interest to this work. Due to its high reactivity, calcite plays a key role in the aqueous geochemistry by regulating the pH and alkalinity by means of dissolution and precipitation in closed systems. Surface techniques such as XPS (X-ray Photoelectron Spectroscopy), LEED (Low Energy Electron Diffraction) and AFM (Atomic Force Microscopy), showed that in humid air calcite has an ordered and crystalline surface, while in vacuum a surface reconstruction occurs [18, 19]. Kept in water for a long time, surface of calcite is rearranging [19-21]. In aqueous environment, calcite is therefore influencing the chemical behavior of soils and sediments [22]. Via sorption reactions, calcite may affect the mobility and geochemical cycling of trace metal that can be found in the aquatic environment [23, 24]. The reactivity of calcite, surface makes it an important sorbent for heavy metals, metalloids and contaminants in the environment.
This chapter gathers the bibliographic review of calcite interaction with metals. The first part focuses on calcite, on its environmental occurrence and significance, as well as its bulk structure and its surface reactivity in aqueous solutions. The second part is a review of past studies dealing with the interaction of Eu(III) with aqueous carbonates, with an emphasis on TRLFS studies. This was followed by a review on the literature data on Eu(III) interaction with calcite. Finally, the third part is devoted to the aqueous chemistry of Ni(II) and especially its interaction with aqueous carbonate species, which have to be taken into account when studying their sorption on calcite. Likewise, a bibliographic review of Ni(II) behavior in presence of calcite is presented in the same section.
1.1. Calcite: environmental occurrence and significance, structure and surface reactivity 1.1.1. Environmental occurrence and significance
Calcium carbonate (CaCO3) can be found in three polymorphic forms: calcite, aragonite and vaterite [25]. Taking into account the solubility products Ksp at 25°C of each polymorphic form (Table 1.1), we can see that calcite is the most stable in the CaCO3 series. Vaterite behaves as a precursor in calcite/aragonite formation, resulting in a polymorph phase mixture.
30
Table 1.1: Solubility products of calcium carbonates at 25 °C.
Calcite is widely found in sedimentary rocks and cementitious materials and is expected to precipitate as a result of the interaction of concrete with carbonated water or organic waste [30]. From highly supersaturated calcium carbonate solutions, metastable vaterite may precipitate as a precursor phase and later transform to calcite [31]. In addition to calcium carbonate polymorphs for high alkaline pH, it is important to consider Ca(OH)2 - portlandite too.
Precipitated calcite as well as primary phases are expected to trap dissolved radionuclides, especially lanthanides and actinides [32]. Calcite is also known to retain divalent trace metals onto its surface and to incorporate them into the lattice by cationic substitution [16].
1.1.2. Structure of calcite
Calcite crystallization form is rhombohedra being included in R32/m group space. The cell
dimensions differ slightly for different calcite crystals depending e.g. on the purity, the conditions
during crystal growth, temperature, and pressure. Hexagonal cell parameters are: b1 = b2 = 5.58 Å,
b3 = 17.060 Å, = = 90°, and = 120° [33] (Figure 1.1).
Phase log10 Ksp
(I=0) Reference
Calcite
−8.42 Jacobsen and Langmuir [26]
−8.45 Berner [27]
−8.48 Plummer and Busenberg[28]
Aragonite
−8.28 Berner [27]
−8.28 Plummer and Busenberg [28]
−8.31 Garvin et al. [29]
Vaterite −7.91 Plummer and Busenberg [28]
31
Figure 1.1: Structure of calcite [34].
Calcite structure can be described using the hexagonal representation, with Miller or Bravais-Miller indices. The Miller indices, is a group of three numbers that indicates the orientation of a plane or set of parallel planes of atoms in a crystal. The orientation of a surface or a crystal plane may be defined by considering how the plane (or the parallel plane) intersects the main crystallographic axes of solid. The application of a set of rules leads to the assignement of Miller indices, (h, k, l); a set of number which quantify the intercepts and thus may be used to uniquely identify the plane or surface. If four axes are defined in the crystal, and not three as presented before, this leads to four Bravais-Miller indices which can be written (h, k, i, l).In this work, in order to be internally consistent, notations using three Miller indices were used.
The primitive rhombohedral unit cell of calcite contains ten atoms (two CaCO3 formula units) and
consists of alternating (111) planes of Ca atoms and carbonate groups. Ca atoms are situated at 0 and 1/2 along [111], and carbonate groups are located at 1/4 and 3/4 along this vector [35]. In
32
The most common cleavage face for calcite is (104). This surface is the most stable and is often identified on crystal growth, calcite cleavage and dissolution. So, rhombohedral crystals are therefore also the most dominant morphology of calcite observed in the natural environment. During growth, calcite contains some shallow pyramids named growth hillock as was observed by DIC (differential interface contrast) microscopy in Paquette and Reeder [36] study. Surfaces are composed most of (001), (110), (012), and (104) faces, but the (104) face is by far the most
abundant and the most stable. This face is corresponding to [ and [ directions. The
abundance of faces can be explained by PBC theory - Periodic Bond Chain Theory. The crystal morphology can be derived from the crystal structure, according to Hartman and Perdok theory. According to this theory, the [ is considered to be the most stable. This explains the high stability of the calcite crystal face and its reason for the high abundance on this face on crystal grown from solution.
Ruiz-Agudo [37] observed the atomic steps on the crystal surfaces reflect its rhombohedral
symmetry, with two steps intersecting the (104) cleavage face at an acute angle ([ and [ )
and two steps intersecting at an obtuse angle ([441]+ and [481]+). Increasing the pH to 12 led to the
nucleation of 2D islands with rounded [441]+/[481]+ corners. Paquette and Reeder [36] identified
three nonequivalent PBCs in the calcite structure along the [ , the [ and the direction.
The lowest energy on the surface of calcite surface is on the face (104), which also characterizes the rhombohedral morphology of calcite [38, 39]. Ca2+ and CO32− form a rectangular lattice on this plane. The ratio Ca2+/CO32− and the geometry of CO32− depend of the orientation of the crystal face. In the case of (104) face, these ions are present in a ratio 1:1. The surface density of the (104) face is 4.95 atoms. nm−2 (8.226 µmol surface sites. m−2)[40].
1.1.3. Surface reactivity of calcite
1.1.3.1. pH and surface charge of calcite
The pH of saturated calcite suspensions has been often investigated, because it is strongly dependent on calcite dissolution, calcite surface speciation, Ca2+ concentration and solid surface
charge (pHzpc). The charged surface of a mineral affects adsorption. A positively charged surface
33
pH. The pzc (point of zero charge) is defined as the pH value where the net total particle charge is equal to zero [41]. Values of pzc for calcite were found between 8 and 9.5 [42].
If it is assumed that Ca2+ or CO32− has the same affinity for the calcite surface, the pzc is the point where the concentrations of Ca2+ or CO32− are equal. It is important to understand the effect of physical parameters (e.g. temperature) and of the chemical parameters (e.g. pH, pCO2, ionic strength and investigated element concentration or additional organic ligands) on the investigated system [43]. When these parameters vary the sorption can be strongly influenced (reduced or promoted metal sorption) [44]. This is the reason why several early studies are based on classical
“batch” experiments where the influences of different parameters like pH, pCO2, metal
concentration, ionic strength, background electrolyte and time are varied [14].
The surface reactivity of calcite has been described by thermodynamic approaches such as surface complexation modeling (SCM). Based on the model developed by Stumm [45] where the integration of surface speciation into kinetic models of oxides and silicates was made, Van Cappellen and co-workers proposed a SCM model which is presently the main reference in SCM modeling of calcite [23]. Principles of SCM modeling will not be described in details in this bibliographic review since the Ph.D. study has been focused on the first steps before carrying out modeling, which are the identification of mechanisms that should be later considered when modeling the data: structural studies on the surface chemistry are thus presented in detail in the next section.
1.1.3.2. Structural studies of the calcite/water interface
Surface spectroscopic techniques such as XPS (X-ray photoelectron spectroscopy), LEED (low energy electron diffraction), AFM or XAS (X-ray absorption spectroscopy) give information at atomic level on bonding environment on carbonate/water surface.
Chiarelo and Sturchio [46] and Stipp and Hochella [18] showed, respectively by X-ray reflectivity and XPS, that the spacing and the long range ordering of the near-surface lattice are from a statistic point of view identical to those in the bulk of calcite [47]. Their studies reveal that structural distortion of the mineral lattice due to hydration does not penetrate deeper than 1-2 atomic layers. Using atomic force microscopy (AFM), several studies on calcite showed that dissolution and growth occur at high energy level defect sites, on the borders of solid under near-equilibrium
34
conditions (Dove and Hochella [48]; Teng et al. [49]). The saturation index (S.I) can be defined as logarithm between the IAP (ionic activity product) and solubility product (Ksp):
(Eq.1.1)
Three cases can be distinguished:
IAP<Ksp then S.I. < 0 means that the mineral dissolves. IAP>Ksp then the S.I. > 0, means that the mineral precipitates.
IAP=Ksp, then S.I. = 0 means that the mineral is in equilibrium with the solution.
It should be noted that there is dissolution/precipitation even when the system is closed to equilibrium, which highly impacts the surface reactivity of calcite.
At S.I. = 0.2 Dove and Hochella [48] found spiral growth and growth at available molecular steps as the dominant growth mechanisms. At S.I. = 0.4, spiral growth and surface nucleation exist together.
According to Heberling et al. [50], studies by surface diffraction documented that the structure of the calcite (104) face corresponds to a large degree to the termination along this crystallographic direction expected from the bulk crystal structure. Two layers of adsorbed surface hydration water at 2.3 and 3.4 Å above the surface have been identified.
Stipp and Hochella [18], using XPS and LEED, identified two distinct hydrated species using
ultra-high vacuum, namely >CaOH0 and >CO3H0 after exposing calcite to water. LEED is a technique
which permits to identify pattern on atomic level (Å order) in a solid. XPS permits the identification of compounds on near surface and their binding in solid.
Fenter et al. [51] studied calcite-water interface at various pH 6.8, 8.3 and 12.1 under atmospheric conditions by means of X-ray reflectancy. At pH 8.3, the best fit of the reflectancy model is presented at 1.0±0.4 monolayer of hydroxyl species. They report on a full monolayer of water or hydroxyl at 2.50±0.12 Å above the surface. They modeled their data without including calcium carbonate inner-sphere complexes. Surface diffraction is generally very sensitive to inner–sphere
35
adsorption. A surface diffraction study analyzing the 3D structure of the calcite–water interface at pH 8.3 in equilibrium with air was performed by Geissbühler et al. [52]. Their results show that there are two well-ordered water layers with the first 2.30 ± 0.1 Å above the surface and the second one 3.45±0.2 Å above the surface. The ions in the first two monolayers of the surface slightly relax from their bulk positions. The surface carbonate ions are tilted towards the surface by 11.3°. The distance between the surface calcium and the closest water molecule is 2.97 ± 0.12 Å.
In the case of carbonates, dissociation of water molecules adsorbed on the surface form two distinct types of hydration sites. In the case of our material of interest, calcite, hydration of calcite show two different surface sites that are formed >CaOH0 and >CO3H0 having 1:1 stoichiometry on the surface. The presence of these two surface sites was highlighted using spectroscopic techniques by Pokrovky and Schott [53] used performed an IR study (DRIFT- diffuse reflectance infrared Fourier transform) of the surface of calcite. They identified two bands at 3400 cm−1 and 1420 cm−1 as surface hydroxyl groups and carbonate groups. For the solutions that have a low pH, they noticed an increase of the hydroxyl band and explain it by an increase of hydrated calcium- surface complexes.
Changes in calcite structure are expected, due to the dynamics of system and re-crystallisation processes coinciding with the adsorption of radionuclides [19]. Surface re-crystallization may cause partial incorporation of radionuclides into the calcite structure.
With a better understanding of calcite surface and its behavior in solution, a bibliographic review of aqueous behavior and interaction of Eu(III) and Ni(II) with calcite is presented below.
1.2. Lanthanide: europium
1.2.1. Aqueous chemistry of europium
In natural environment, europium is generally present in +III oxidation state. Under reducing conditions, it can be also found under +II oxidation state. The most common and stable europium
isotopes are 151Eu and 153Eu, the more abundant being 153Eu. The most common radioactive isotope
is 152Eu, which is a β-emitter. Other Eu(III) isotopes found in radioactive waste is 155Eu which is a fission product, but also in a small quantity produced by neutron capture on 153Eu. Another radioactive Eu isotope is 154Eu which is produced by neutron activation of 153Eu.
36
Eu(III) is an important metal because of its similar behavior to Cm(III), Am(III), Pu(III) and Bk(III), which mobility in groundwater systems has to be assessed since they are among the radioactive species (242Cm, 243Cm, 244Cm and 241 Am) present in radioactive waste. Its fluorescent properties enable the use of TRLFS as an interesting tool to investigate aqueous speciation and sorption mechanisms at the molecular level.
A multitude of chemical species exists in the system Eu−NaCl−CO2−calcite. Over time, the
aqueous speciation as well as the solubility of the solid phases has been investigated. Thermodynamic data are available for speciation and solubility calculations at standard conditions for europium solutions and solid phases and have been selected in several projects, among which the Thermochimie database, which provided consistency to the numerous and sometimes ambiguous data in the literature. At pH smaller than 7, europium hydrolyzes slightly while at basic pH Eu(III) can form strong hydroxide precipitates. Aqueous carbonate ions are well known to be very strong inorganic ligands complexing actinides/lanthanides [54, 55]. Trivalent solid carbonates have been determined to be the most important solubility - controlling phases for trivalent elements under natural environment conditions [56]. Speciation diagrams for the conditions of our experimental studies will be given in Chapter 3. Spectroscopic studies on the aqueous Eu(III) complexes and Eu(III) containing solid phases are presented in this section, with an emphasis on spectrofluorimetry results, since this technique is the one used during this Ph.D. work.
Runde et al. [56] focused their research on synthesis and spectroscopic characterization of isolated solid phases of Eu(III) and Am(III). Structural information on crystalline and amorphous compounds was obtained by spectroscopic techniques like FTIR, XRD and XAS. Finally, they used TRLFS to get a deeper understanding of the obtained compounds. By DTA/TGA (Differential Thermal Analysis/Thermal Gravimetric Analysis), they showed that the mixed hydroxy-carbonate
EuOHCO3(s) does not contain water molecules [56, 57]. The absence of water molecules for
EuOHCO3(s) was evidenced by the presence of a very narrow IR band at 3479 cm−1 confirming the
presence of a hydroxo group. For Eu2(CO3)3:2-3 H2O(s), it was very difficult to establish exactly the correct number of water molecules, contrary to NaEu(CO3)2:5H2O(s) where the number of water molecules was determined to be 5 by DTA/TGA. By FT-IR, the presence of water was confirmed. TRLFS allowed to distinguish between Eu(III) hydroxides and carbonates which cause a different splitting into discrete crystal field levels; this technique also allowed to distinguish between Eu(III)
37
solid carbonates. They used the fluorescence lifetimes to estimate the number of water molecules surrounding Eu for two species: Eu2(CO3)3:2-3H2O(s), τ = 234 ± 10 s (nH2O = 2.8 ± 0.5) and NaEu(CO3)2:5H2O(s), τ = 208 ± 8 s (nH2O = 4.5 ± 0.5). The correlation between inner-sphere water molecules and lifetimes were done by applying an equation developed by Horrocks [58, 59] and Chopin [60] :
(Eq.1.2)
For Eu(III) the constants values are determined by Chopin [60] and are x=1.05 and y=0.70. The obtained results for water molecules confirms their DTA/TGA data [60]. XAS and TRLFS were successfully used to determine the coordination environment of Eu(III) carbonates in solution, as well as solids.
Later, Plancque [61] and his collaborators investigated Eu(III) complexes formed with hydroxide, carbonate and humic substances by TRLFS. They varied ligand concentration and pH using a fixed Eu(III) concentration in order to obtain the aqueous speciation of Eu(III) carbonates Eu(CO3)+, Eu(CO3)2− and Eu(CO3)33−. The first species that they identified is the free europium ion at pH = 2 under atmospheric conditions obtaining a lifetime of 110 ± 10 s. This value has been obtained until pH = 6, for a total concentration of Eu(III) of 6.6 10−6 mol.L−1. In Table 1.2, Table 1.3 and
Table 1.4 the calculated lifetimes for the europium carbonate aqueous and solid species are summarized.
38
Table 1.2: Eu(III) literature lifetimes for aqueous Eu(III) hydroxo species.
Species
Wavelength (nm) F1/F2 ratio Lifetime (µs) nH2O Temperature (K) References
Transitions 5D 0 →7F0 5D0 → 7F1 5D0 → 7F2 Eu3+(aq) 580 593 618 8/1 110 5 9 298 Stumpf et al. [62] 110 10 298 Moulin et al. [63] 110 10 293 Plancque et al. [61] 591.7 616.4 1/0.5 110 8.9 297 Heller et al. [64]
EuOH2+ (aq) 580 593 615 1/1 50 5 - 293 Plancque et al. [61]
Eu(OH)2+ (aq) 580 593 615 1/1 40 5 - 293 Plancque et al. [61]
Eu(OH)3 (aq) 580 593 615 1/1 40 5 - 293 Plancque et al. [61]
39
Table 1.3: Eu(III) literature lifetimes for aqueous Eu(III) carbonate species.
Species
Wavelength (nm) F1/F2 ratio Lifetime (µs) nH2O Temperature(K) References
Transitions 5D 0 →7F0 5D0 → 7F1 5D0 → 7F2 EuCO3+ (aq) 580 591 616 1/2 180 10 5.3 293 Plancque et al. [61] 579 592 617 170 5.7 298 Kim et al. [68] Eu(CO3)2− (aq) 580 592 616 1/3 290 3.1 293 Plancque et al. [61] 580 592 617 230 4.0 298 Kim et al. [65] Eu(CO3)33− (aq) 580 594 617 1/4 440 1.8 293 Plancque et al. [61] 592 615 385 2.2 298 Kim et al. [65] 580 593 614/618 1/6 400 2.1 293 Moulin et al. [63]
40
Table 1.4: Eu(III) literature lifetimes for Eu(III) hydroxide, hydroxo-carbonate and carbonate solid phases.
Species Wavelength (nm) Lifetime (µs) Temperature (K) References Transitions 5D 0 →7F0 5D0 → 7F1 5D0 → 7F2
Eu(OH)3(s) 577.50 591.40 594.88 616.26 21.6 ± 3.3 298.15 Runde et al. [56]
Eu(OH)3(s) 579.71 592.42 616.90 220 Pointeau [66] EuOHCO3(s) 577.47 586.17 587.92 600.10 610.13 617.09 621.23 109.8 ± 7.7 298.15 Runde et al. [56] Eu2(CO3)3:2-3H2O(s) 579.24 591.4 593.61 606.21 613.16 615.12 617.51 233.6 ± 9.8 298.15 Runde et al. [56] Eu2(CO3)3:3H2O(s) / / / 270 ± 27 298.15 Vu-Do [67] NaEu(CO3)2:5H2O(s) 578.80 588.17 592.52 594.46 613.65 616.71 619.08 207.7 ± 8.2 298.15 Runde et al. [56]


![Figure 3.12: Time−resolved luminescence spectra (left) and decay curve (right) of [Eu(III)] 0 = 10 −4 mol.L −1 , I=10 −1 mol.L −1 , s/L=5.g.L −1 CaCO 3 , pCO 2 = 10 −3.5 atm,](https://thumb-eu.123doks.com/thumbv2/123doknet/13023260.381428/100.918.99.749.148.407/figure-time-resolved-luminescence-spectra-decay-curve-right.webp)


![Figure 3.16: Time−resolved luminescence spectra (left) and time decay curve (right) of [Eu(III)] 0 = 10 −4 mol.L −1 , CaCO 3 single crystal, I=10 −1 mol.L −1 NaCl, pCO 2 = 10 −3.5 atm,](https://thumb-eu.123doks.com/thumbv2/123doknet/13023260.381428/109.918.134.785.228.481/figure-time-resolved-luminescence-spectra-decay-single-crystal.webp)
