Zerf Mohammed, J Hum Bio & Health Edu 2018, 2: 1 2: 010
Research
Aerobic Fitness as a Superior Predictor Factor to Estimate the
Optional Body Weight among the Soccer Players
Zerf Mohammed
Physical Education Institute Laboratory OPAPS, University of Mostaganem, Mostaganem, Algeria
*Corresponding Author: Zerf Mohammed, Physical Education
Institute Laboratory OPAPS, University of Mostaganem, Mostaganem, Algeria; E-mail: biomeca.zerf@outlook.com
Sub Date: March 6th 2018, Acc Date: April 25th 2018, Pub Date: April
26th 2018.
Citation: Zerf Mohammed (2018) Aerobic Fitness as a Superior
Predictor Factor to Estimate the Optional Body Weight among the Soccer Players. J. Hum Bio & Health Edu 2: 010.
Copyright: © 2018 Zerf Mohammed. This is an open access article
distributed under the terms of the Creative Commons Attribution License, which permits unrestricted use, distribution, and reproduction in any medium, provided the original author and source are credited.
Abstract
Aerobic training is the best mode of exercise for burning fat. While previous studies have shown that weight change alone may not detect important beneficial changes in body composition associated with aerobic training. Thus, this issue regard, the current research focused on aerobic fitness as superior predictor factor to determine the optional body weight, midst 160 male soccer players under 19 years. Tested by Cooper test as a physiological parameter to esteem Vo2max and weight to height as anthropometric parameters to estimate the BMI and body fat. Results showed that fat percentage augmentation leads to a decrease in aerobic fitness, as the best factors inflicting the Vo2maxlevels among football players better than BMI. On this base, the current study supports that level of Vo2max revealed the impact body fat percent as an important factor to estimate body composition changes relative to optional competitive weight among sportswomen. State in this study based on BFP measurement to be a better criterion than BMI for prediction the low VO2max aerobic capacity among the soccer players.
Keywords:
BFP; BMI; Vo2max; Control Weight; Soccer PlayersIntroduction
There is a wide range of approaches to assessing optional body weight were the most suitable request the laboratory practices. State by preventing studies as costly methods [1], not suited for every day medical practice [2] or physical control progressiontraining tests. The opposite of aerobic performance field tests that can estimate the maximal oxygen up take associated with categorizing aerobic fitness when testing large groups. Whereas Wener, et al confirm that Vo2max is affected by genetics, training, gender, age, and body composition [3].
Founded on the above and the contextual, which confirmed aerobic fitness as cardiovascular fitness [4] correlate to health as quality of life [5], helping the players/ human to maintain the recommended body weight [6]or ideal body weight [7]. As part of the weight control program among athletes [8]. Confirmed by Sayyed, et al [9] in the use of aerobic (endurance) activity. As one of the best forms exercises, weight control
programs, definite by lower body fat percentage and higher lean mass as optimal for athletes to enhance their performance [10]regulars to their body fat training allied to their aerobic capacity levels [11].
Supported in the current study via VO2max index as a superior predictor factor to estimate the optional body. Recommended for greater competitive body health [12], based on the body fat as less metabolically active than lean body mass, the case of athletic performance, confirmed by Rosalinda, et al, as an adjusted weight used to control the energy diet Vo2max, that is primarily resolute in the aerobic capacity of the working [13]. While Joseph, et al, suggests that the key is to develop predicted values from Vo2, which takes into account age and sex, and the relation between body weights correlated with height [14], as well as the distribution of body weight, confirmed by Ronald. K [15].
Material and Methods
Sample
The data used in this study were obtained from the database of team 5 Physical Education Institute Laboratory OPAPS for the academic years 2014-2015. In terms of player-related data, 160 male soccer players under 19 years, from the Algerian championship national territory was examined in parameters (anthropometric and physiological decided for
the current study) by Team 5 at the end of the physical preparation for the years 2014-2015. After the agreement with their coach. All examinations were achieved at the earliest weeks, before the start of the championship. While in experiments of the study protocol and methods, we choose the laboratory OPAPS “Institute of Physical Education of our university” who approve it, by the professors of football and physiologist of effort.
Experimental Protocol
To determinate the functional capacity to perform a maximal exercise, as one of the intended goals of any form of stress testing [16]. Verma SS, et al, confirms that the applications of these regression equations will be of practical importance to biomedical scientists engaged in the development of a simple procedure for indirect assessment of Vo2max [17]. Confirmed by Sharp TA, et al [18] as a positive correlation between Vo2max and fat-free mass and negatively with adiposity. However, Huuskonen A, et al, admits that relative aerobic capacity is associated with lower BMI and levels physical performance [19]. Following these steps, we chose regression analysis as the most appropriate method to analyze combinations of variables chosen to study.
Testing Protocol
The Maximal Aerobic Capacity: We use the maximal aerobic
capacity formula of Test Cooper:
Vo2max (ml/min/kg) =22.351* Distance (km) - 11.288,confirmed by John G, et al, as corresponding values laboratory of the estimatedVo2max [20], with a precision set between 90- 95%, according to [21], described by the Cooper Institute as pointers of best picture endurance of maximal aerobic capacity [22], consistent with the levels of health and quality of life [23]. 4.3.2. Weight and Height: Height (m) and weight (kg) were each measured in the standing position [11], to calculate the body mass index (BMI) = weight (kg) /height (m2) [24]. Well Go to Y, et al confirms the Vo2 peak is associated with biological status, after its connectivity with height related to weight [25]. Whereas ideal body weight is the body weight for
a given height that is statistically associated with the greatest longevity [26], which can be estimated either by reviewing the medical record for the body weight [27] and calculated mathematically by dividing weight in kilograms by the square of height in meters [28]. Whereas this formula represents the calculi of BMI, where Vishwanath S, (2011) confirms that some football players, maybe overweight because of their increased lean body mass, but not obese or overrated [29]. Since BMI is not a perfect measure, it does correlate strongly with percent body fat, according to Lauren, et al [30]. Form the above, we use the formula proposed by Deurenberg, et al. BFP = (1,2 × BMI) + (0,23 × age) - (10,8 × Sex) - 5, 4 [31]as inexpensive and convenient means for soccer player.
Statistical Analyses
Data analysis was performed using SPSS 22.0 for Windows (32- bit). Data collected from the tests showed a normal distribution and homogeneity, presented as a means, standard deviation, Shapiro-Wilk tests and Levene’s test. Regression analyses were performed to analyze the combined of the variables chosen for study. The relationship between the variables was analyzed by Pearson correlations (r).
Results
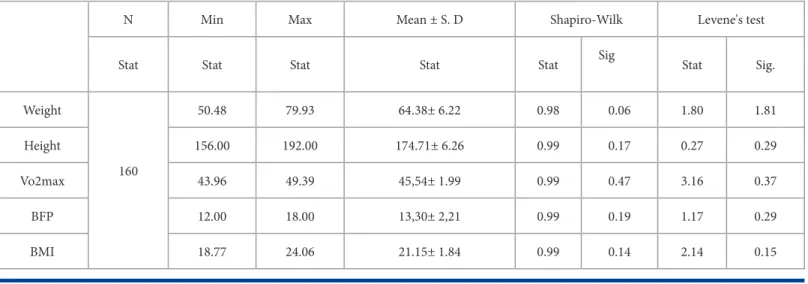
The characteristics of the study sample are provided in table 1. All the variables accepted normality founded on the Shapiro -Wilk test and the homogeneity established by Levene’s test. Depending on normative data for Vo2max, our sample ranges between fair and good [32]. Appreciate by Peter R.J. Reaburn (2014) via the soccer players within more than 36.3 ml/kg/ minasbenefitVo2max norms [33]. Support the case of this study through BFP norms, which categorize our sample in a normal fitness category, according to Raul Garrido-Chamorro, et al [34]. Admit by BMI categories, which classifies our players in the normal weight body mass index (BMI), reported by Marie A [35]from 18.5 to 24.9.
N Min Max Mean ± S. D Shapiro-Wilk Levene's test
Stat Stat Stat Stat Stat Sig Stat Sig.
Weight 50.48 79.93 64.38± 6.22 0.98 0.06 1.80 1.81
Height 156.00 192.00 174.71± 6.26 0.99 0.17 0.27 0.29
All the correlations in Table 2 are highly significant at P≤ 0.05 and 0.01. Where Vo2max is strongly negatively correlated with BFP follows by BMI and weight in the opposites of Height, which is very positive. Accounted by Pantel is (2012) that the strong relationship between BMI and BFP suggests the further use of BMI in adolescent soccer players [36]. Whileto determine thesuperiorityofaerobic performance in predicting the change of body composition, we chose regulation as a statistical model. See Table
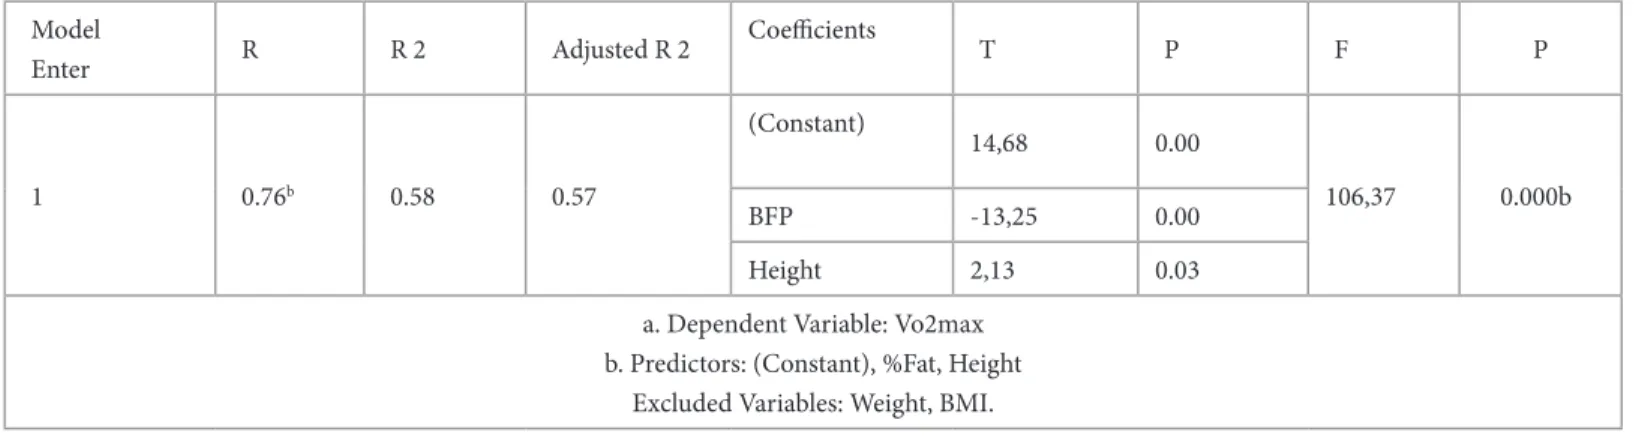
View Table 3 Mode 1, the analyse shows BFP and Height as superior’s factors inflicting the levels of aerobic fitness. Support in the case of this study based on the variablesexcluded from the regression. Which revealed that adjustment of aerobic capacity requests the measurement of fat-free mass estimate base on highest BF than BMI [37].
Discussion
Based on the statistical applied. Through tables 2. Our resultsapproved theresults record by Pantelis(2012) that the strong relationship between BMI suggests the further use of BMI in adolescent soccer players [36]. Whereas as superiors factors impacted the VO2max our result Table 3, support the finding of N K out lianos that BFP is more effective than BMI [38] in predicting the aerobic capacity. Sustenance by Peter S via height size and its relation to body fat distribution as a superfactor
toestimate VO2max [39]. Establish by Allen L & P rentice A [40] among BMI measurement that cannot distinguish between the mass of body fat or muscle mass and thus is not appropriate for use with athletes in order to evaluate their body fat status. Confirmed by Jose, et all inuse of BMI to predict optimal body weight for an athlete can be misleading. Interpret by this last that the predictive formula was developed based on average individuals, not athletes [41]. Founded on these results and limitations of the research, we approve the indication quote by Connie Henke, et al [42] to esteem the adjusted athletics body weight [43], we need to detect the excess body weight in the form of a fat percent than total, reports at a distinct disadvantage in almost practiced sports [44]. Conclude by Mondal H, & Mishra SP (2017) via obesity in terms of Fat% attend a better criterion than BMI for prediction the low VO2max [37]. Admitted in this study through weight loss recommendations can be achieved by the improvement of aerobic functioning supported by the observed relationship between percent of body fat and maximal oxygen uptake more than BMI alone, account in similar as a cautioned measure in athletes. Proofs guide us to agree that body weight and body composition as a part of a weight-control program [45], must considerthe correlation between vo2max and lean body mass that is more closely associated with height than weight [46]. Inspected in this study via BFP attend to be a better criterion than BMI for prediction the low VO2max associate with the optimal competitive body more than BMI [47]. Findings, which confirm Vo2max as the best index for aerobic fitness and the control program body fat loss [48]. Whereas to manage body weight [49], in the case of our sample, we recommend the analysis of BFP as better criterion than BMI for prediction body change correlated to VO2max as the most important factors for any complete fitness program [11].
Pearson
Correlation Weight Height BMI BFP
Vo2max -0.43** 0.32** -0.74** -0.75**
**. Correlation is significant at the 0.01 level (2-tailed).
Table 2: Presents the correlations between the variables tested in the current study. Model Enter R R 2 Adjusted R 2 Coefficients T P F P 1 0.76b 0.58 0.57 (Constant) 14,68 0.00 106,37 0.000b BFP -13,25 0.00 Height 2,13 0.03
a. Dependent Variable: Vo2max b. Predictors: (Constant), %Fat, Height
Excluded Variables: Weight, BMI.
Conclusion
Our study back up the hypothesis that the high extensiveness of heaviness among sports women. Request the control of the levels of Vo2max as a superior factor to predict the ideal competitive body weight. Admit in the case of this study based on the body fat measurement as a super factor to predict the level of VO2max in sports women better than BMI. Determine by Mondal H, & Mishra SP (2017) via obesity in terms of Fat% attend to be a better criterion than BMI for prediction the low VO2max [37]. Establish in the present based on regression model to esteem the aerobic capacity adjusted for optional body weight. Where the program shows the BFP and height as the superiors factor in predicting aerobic capacity associated with changes body composition relative to optional bodyor loss. Support by literature in the estimates of physiologic capacity, which can be confounded by variations in fat mass. When adjustments are made with body mass because fat mass increases the body mass but do not contribute markedly to oxygen uptake during the exercise.
References
1. Neamat Allah J, Wald D, Hüsing A, Teucher B, Wendt A, Delorme S et al. (2014) Validation of anthropometric indices of adiposity against whole-body magnetic resonance imaging – a study within the German European Prospective Investigation into Cancer and Nutrition (EPIC) Cohorts. PLOS ONE 9: 91586.
2. Marzena M, Kęska A, Tkaczyk J, Lutosławska G (2015) Body shape index versus body mass index as correlates of health risk in young healthy sedentary men. Journal of Translational Medicine 13: 75. 3. Wener W K Hoeger, Sharon A Hoeger (2016) Lifetime Physical
Fitness and Wellness A Personalized Program. US CengageBrain com 212.
4. Charles B Corbin, Guy C Le Masurier, Dolly Lambdin (2007) Fitness for Life Middle School. US Human Kinetics 9.
5. Judith E Brown (2012) Nutrition Now. US CengageBrain com 27-4. 6. Sharkey, Brian J, Gaskill, Steven (2013) Fitness cycling US Human
Kinetics 126.
7. Terry Ann Spitzer Gibson, Wener WK Hoeger (2011) Water Aerobics for Fitness and Wellness. US CengageBrain.com 6. 8. Dana L Duren, Richard J Sherwood, Stefan A Czerwinski,
Miryoung Lee, Audrey C Choh et al. (2008) Body Composition Methods Comparisons and Interpretation. J Diabetes Sci Technol 2(6): 1139-1146.
10. Heather Hedrick Fink, Alan E Mikesky (2015) Practical Applications in Sports Nutrition. US Jones & Bartlett Learning 317. 11. Mohammed Z, Abelatif H, Mokhtar M, Ali B (2016) Height versus
Weight which Cassel Parameter Determine Pulmonary Functions Fitness among the Algerians Soccer Players. J Pulm Respir Med 6: 353.
12. Audrey Berman, Glenora Lea Erb, Shirlee Snyder, Trudy Dwyer, Barbara Kozier et al. (2014) Kozier and Erb’s Fundamentals of Nursing Volumes 1-3 Australian Edition (3e). Australia: Pearson Australia 1386.
13. Jayaprakash Cs (2003) Sports Medicine. New Delhi: Jaypee Brothers Medical Publishers 55.
14. Joseph G Murphy, Margaret A Lloyd (2012) Mayo Clinic Cardiology: Concise Textbook. UK: Oxford University Press 187. 15. Ronald Klomp, Frans Bosch (2005) Running: Biomechanics and
Exercise Physiology in Practice. US: Elsevier Churchill Livingstone 116.
16. Ahmadian HR, Sclafani JJ, Emmons EE, Morris MJ, Leclerc KM et al. (2013) Comparison of Predicted Exercise Capacity Equations and the Effect of Actual versus Ideal Body Weight among Subjects Undergoing Cardiopulmonary Exercise Testing. Hindawi Publishing Corporation Cardiology Research and Practice 5. 17. Verma SS, Gupta RK, Gupta JS (1984) Some simple multiple linear
regression equations for estimation of maximal aerobic power in healthy Indian males. Eur J Appl Physiol Occup Physiol 52(3): 336-339.
18. Sharp TA, Reed GW, Sun M, Abumrad NN, Hill JO (1992) Relationship between aerobic fitness level and daily energy expenditure in weight-stable humans. Am J Physio 263:121-128. 19. Huuskonen A, Lappalainen J, Oksala N, Santtila M, Häkkinen
K et al. (2012) Aerobic fitness does not modify the effect of FTO variation on body composition traits. PLoS ONE 7(12) 51635. 20. John Gormley, Juliette Hussey (2009) Exercise Therapy: Prevention
and Treatment of Disease. US: Wiley.com 83.
21. Mayorga Vega D, Bocanegra Parrilla R, Ornelas M, Viciana J (2016) Criterion-Related Validity of the Distance- and Time-Based Walk/Run Field Tests for Estimating Cardiorespiratory Fitness: A Systematic Review and Meta-Analysis. PLoS One 11(3).
24. Linda Skidmore Roth (2015) Mosby’s Drug Guide for Nursing Students with 2016 Update. US Elsevier Health Sciences 1293. 25. Goto Y, Yokokawa H, Fukuda H, Naito T, Hisaoka T, et al. (2015)
Body mass index and waist circumference are independent risk factors for low vital capacity among Japanese participants of a health checkup: a single-institution cross-sectional study. Environ Health Prev Med 20(2):108-115.
26. Vishwanath Sardesai (2003) Introduction to Clinical Nutrition Second Edition. US CRC Press 317.
27. Edward C Feldman, Richard William Nelson (2004) Canine and Feline Endocrinology and Reproduction. US Elsevier Health Sciences 502.
28. Susan G Dudek (2010) Nutrition Essentials for Nursing Practice. US Wolters Kluwer Health 48.
29. Vishwanath Sardesai (2011) Introduction to Clinical Nutrition. Third Edition US CRC Press 353.
30. Lauren M Rossen, Eric Rossen (2013) Psych 101 Series Sampler (eBook): Introductions to Key Topics in Psychology. UK Springer Publishing Company 5.
31. Deurenberg P, Westrate JA, Seidell JC (1991) Body mass index as a measure of body fatness age and sex specific prediction formulas. Br J Nutr 65(2): 105-114.
32. Vivian H Heyward (1998) The Physical Fitness Specialist Certification Manual The Cooper Institute for Aerobics Research Dallas TX 3rd Edition. US: Advance Fitness Assessment & Exercise Prescription 48.
33. Peter RJ Reaburn (2014) Nutrition and Performance in Masters Athletes. US CRC Press 345.
34. Raul Garrido Chamorro, Jose Enrique Sirvent Belando, Marta Gonzalez Lorenzo, Cristina Blasco Lafarga, Enrique Roche (2012) Skinfold Sum: Reference Values for Top Athletes Int J Morphol 30(3): 803-809.
35. Marie A Boyle (2015) Personal Nutrition. US: CengageBrain.com 288.
36. Pantelis Theodoros Nikolaidis (2012) Elevated Body Mass Index and Body Fat Percentage Are Associated with Decreased Physical Fitness in Soccer Players Aged 12–14 Years. 3(3): 168-174.
37. Mondal H, Mishra SP (2017) Effect of BMI Body Fat Percentage and Fat Free Mass on Maximal Oxygen Consumption in Healthy Young Adults. J Clin Diagn Res 11(6): 17-20.
38. N Koutlianos, E Dimitros, T Metaxas, M Cansiz, AS Deligiannis et al. (2013) Indirect estimation of VO2max in athletes by ACSM’s equation: valid or not?. Hippokratia 17(2): 136-140.
39. Peter Slinger, MD, FRCPC (2011) Principles and Practice of Anesthesia for Thoracic Surgery. UK Springer Shop 16.
40. Allen L, Prentice A (2005) Encyclopedia of Human Nutrition. US Elsevier 450.
41. Jose Antonio, Douglas Kalman, Jeffrey R Stout (2008) Essentials of Sports Nutrition and Supplements. Totowa NJ Humana Press 204. 42. Connie Henke Yarbro, Margaret Hansen Frogge, Michelle
Goodman (2005) Cancer Nursing: Principles and Practice. US Jones Bartlett Learning 770.
43. Debra K Moser, Barbara Riegel (2008) Cardiac Nursing: A Companion to Braunwald’s Heart Disease. US: Elsevier Health Sciences 163.
44. Anita Bean, Carol Vorderman (2000) The Complete Guide to Sports Nutrition. US: A & C Black Publishers 101.
45. Sandy Fritz (2012) Sports & Exercise Massage-Elsevieron Vital Source: Comprehensive Care for Athletics, Fitness, & Rehabilitation. US Mosby 98.
46. David Tennant (2012) Food Chemical Risk Analysis. UK Springer Shop 51.
47. Aquatic Exercise Association (2010) Aquatic Fitness Professional Manual-6th Edition. US Human Kinetics 303.
48. Margaret Hodson, Andrew Bush, Duncan Geddes (2012) Cystic Fibrosis, Third Edition. US CRC Press 354.
49. Paul Insel, Don Ross, Kimberley McMahon (2016) Nutrition. US: Jones and Bartlett Publishers 341.