EUROPEAN ECONOMY
The
2018
Ageing Report
Economic & Budgetary
Projections for the 28 EU
Member States (2016-2070)
LEGAL NOTICE
Neither the European Commission nor any person acting on behalf of the European Commission is responsible for the use that might be made of the information contained in this publication.
This paper exists in English only and can be downloaded from
https://ec.europa.eu/info/publications/economic-and-financial-affairs-publications_en.
Luxembourg: Publications Office of the European Union, 2018
PDF ISBN 978-92-79-77460-7 ISSN 2443-8014 doi:10.2765/615631 KC-BC-18-011-EN-N
© European Union, 2018
Reuse is authorised provided the source is acknowledged. The reuse policy of European Commission documents is regulated by Decision 2011/833/EU (OJ L 330, 14.12.2011, p. 39). For any use or reproduction of material that is not under the EU copyright, permission must be sought directly from the copyright holders.
The 2018 Ageing Report
Economic and Budgetary Projections for the EU Member States
(2016-2070)
This is the sixth report with long-term projections of the budgetary impact of the ageing population in the EU Member States and Norway, covering the period 2016–2070. In response to the mandate, the EPC mandated a working group, the Ageing Working Group (AWG) under the chairmanship of Godwin Mifsud, to take forward the work needed to discharge this remit.
This report is presented by the EPC and the European Commission services (Directorate General for Economic and Financial Affairs - DG ECFIN) after full discussion on the basis of the AWG’s comprehensive work. The Directorate-General for Economic and Financial Affairs provided the necessary analysis and calculations used in the report. The demographic projections were carried out by Eurostat.
The report was prepared under the supervision of Lucio Pench (Director in DG ECFIN), Wolfgang Merz (Chairman of the EPC), Godwin Mifsud (Chairman of the AWG), Giuseppe Carone (Head of Unit in DG ECFIN). The main contributors were Pedro Arevalo, Santiago Calvo Ramos, Ben Deboeck, Per Eckefeldt, Nicola Gagliardi, Boriana Goranova, Benedetta Martinelli, Anda Patarau, Adriana Reut, Chris Uregian and the members of the AWG (see list of Members below). The EPC and the Economic and Financial Affairs DG would like to thank all those concerned.
Comments on the report would be gratefully received at the following addresses:
DG ECFIN - Unit C2
Directorate-General for Economic and Financial Affairs European Commission
Giuseppe Carone Rue de la Loi 200 B-1049 Brussels
E-mail: [email protected]
Secretariat of the Economic Policy Committee
EPC secretariat Rue de la Loi 200 B-1049 Brussels
MEMBERS OF THE AGEING WORKING GROUP
CHAIRMAN
Mr. Godwin MIFSUD Ministry of Finance, Malta
BELGIQUE-BELGÏE
Ms. Nicole FASQUELLE Bureau fédéral du Plan - Federaal Planbureau
Dr. Peter WILLEME Bureau fédéral du Plan - Federaal Planbureau
BULGARIA
Ms. Rositsa TRANKOVA Ministry of Finance
Ms. Penka TANEVA National Social Security Institute
CZECH REPUBLIC
Mr. Zbynek STORK Ministry of Finance
Mr. Jindrich MARVAL Ministry of Finance
DANMARK
Mr. Soren ARNBERG Ministry of Finance
Mr. Morten YDE PETERSEN Ministry of Finance
BUNDESREPUBLIK DEUTSCHLAND
Mr. Werner EBERT Federal Ministry of Finance
Mr. François PEGLOW Federal Ministry of Labour and Social Affairs
ESTONIA
Mr. Risto KAARNA Ministry of Finance
Ms. Tonu LILLELAID Ministry of Finance
ELLAS
Ms. Angeliki ZOULAKI National Actuarial Authority
Ms. Eirini ANDRIOPOULOU Ministry of Finance
ESPAÑA
Ms. Carolina MATEOS Ministry of Economy, Industry and Competitiveness
FRANCE
Mr. Thomas LAURENT Ministère de l'économie, des finances et de l'industrie
Ms. Mylène SABATINI Ministère de l'économie, des finances et de l'industrie
CROATIA
Ms. Josipa MESTROVIC SPOLJAR Croatian Health Insurance Fund
Ms. Ljiljana MARUSIC Croatian Pension Insurance Institute
IRELAND
Mr. Ian POWER Department of Finance
Mr. David HUGHES Department of Finance
ITALIA
Mr. Rocco APRILE Ministero dell'Economia e delle Finanze
Ms. Elena FABRIZI Ministero dell'Economia e delle Finanze
CYPRUS
Mr. Costas STAVRAKIS Ministry of Labour, Welfare and Social Insurance
Ms. Maria MATSI Ministry of Finance
LATVIA
Mr. Jurijs KABAKOVS Ministry of Finance
Ms. Sandra STABIŅA Ministry of Welfare
LITHUANIA
Ms. Rasa SLIOGERIENE Ministry of Finance
Ms. Vidija PASTUKIENE Ministry of Social Security and Labour LUXEMBOURG
Mr. François PELTIER STATEC
Mr. Kevin EVERARD Inspection Générale de la Securité Sociale
HUNGARY
Mr. Krisztián TÓTH Hungarian State Treasury
MALTA
Mr. Melchior VELLA Ministry of Finance
Ms. Pauline SALIBA Ministry of Finance
NEDERLAND
Mr. Harry TER RELE Centraal Planbureau
Mr. Wouter HOGERVORST Ministry of Finance
ÖSTERREICH
Mr. Peter GRAFENEDER Bundesministerium für Finanzen
Mr. Armin HEINRICH Bundesministerium für Finanzen
POLAND
Ms. Joanna STACHURA Ministry of Finance
Mr. Pawel STRZELECKI National Bank of Poland
PORTUGAL
Ms. Conceicao NUNES Ministry of Finance
Ms. Rita FIGUEIRAS Ministry of Labour, Solidarity, and Social Security
ROMANIA
Mr. Daniel VALCU Ministry of Public Finance
Mr. Lucian NOVAK National Commission for Economic Forecasting
SLOVENIA
Ms. Eva ZVER Institute of Macroeconomic Analysis and Development
Mr. Franc KLUZER Ministry of Finance
SLOVAKIA
Mr. Thomas RIZMAN Ministry of Finance
Mr. Peter HARVAN Ministry of Finance
SUOMI FINLAND
SVERIGE
Mr. Jonas NORLIN Ministry of Finance
Mr. Olle SUNDBERG Ministry of Health and Social Affairs
UNITED KINGDOM
Mr. George VERNON HM Treasury
Mr. Vincent TANG HM Treasury
OBSERVERS
Mr. Yngvar DYVI Ministry of Finance, Norway
Mr. Per-Mathis KONGSRUD Ministry of Finance, Norway
EUROPEAN CENTRAL BANK Ms. Carolin NERLICH EUROSTAT Mr. Giampaolo LANZIERI EPC SECRETARIAT Mr. Jens LARSEN Mr. Fuat VARDAR EUROPEAN COMMISSION Mr. Giuseppe CARONE Mr. Per ECKEFELDT
1. 2018 Ageing Report: mandate and broad principles 1
2. The economic and budgetary impact of population ageing 3
Part I: Underlying demographic and macroeconomic assumptions 15
1. Demographic assumptions 16
1.1. Population projections 16
2. Macroeconomic assumptions 29
2.1. Background 29
2.2. Labour force projections 29
2.3. Projections of labour productivity and GDP 39
2.4. Comparison with the 2015 Ageing Report 42
3. Sensitivity tests 46
3.1. Overview of the sensitivity tests and alternative scenarios 46
3.2. Potential GDP Projection results 47
Part II: Long-term projections of age-related expenditure and
unemployment benefits
49
1. Pensions 50
1.1. Introduction 50
1.2. Taxonomy of main pension schemes in EU countries 50
1.3. Coverage of pension projections 52
1.4. Features of pension systems in the EU 52
1.5. Pension expenditure projections 66
1.6. Drivers of pension expenditure 76
1.7. Disaggregation of new pensions 86
1.8. Sensitivity tests 88
1.9. Comparison with the 2015 Ageing Report 95
1.10. Scope for improvement of member states pension projections 100
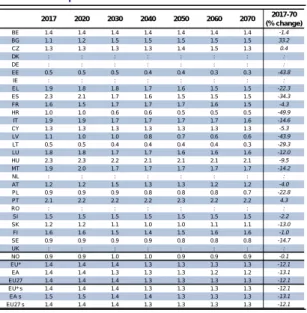
2. Health care expenditure 101
2.1. Introduction 101
2.2. Determinants of health care expenditure 101
2.3. Short overview of the projection methodology 108
2.4. Projection results 116
2.5. Comparison with the 2015 Ageing Report 127
2.6. Conclusions 129
3. Long term care 132
3.1. Introduction 132
3.2. Determinants of long-term care expenditure 133
3.3. Overview of the projection methodology 138
3.4. Projection results 142
3.5. Comparison with the 2015 Ageing Report 151
3.6. Conclusions 153
4. Education 156
4.2. General characteristics of national education systems 156
4.3. Projection results 158
4.4. Sensitivity tests 164
5. Unemployment benefit expenditure 167
5.1. Introduction 167
5.2. The input data 167
5.3. Unemployment benefit expenditure: baseline projections 169
5.4. Demographic and macro-economic risk scenarios 169
5.5. Comparison with the 2015 Ageing Report 169
Annexes 171
AI. Pension questionnaire 171
AII. Additional information on pension systems and projections 175
AIII. Input data used to project health care expenditure 180
AIV. Input data used and long-term care expenditure 183
AV. Input data used to project education expenditure 190
AV.1. METHODOLOGY 190
AV.2. DATA 190
Part III: Statistical Annex – CROSS-COUNTRY TABLES
195
1. Tables 196
1.1. Statistical Annex – Cross-Country Tables 196
Part IV: Statistical Annex – COUNTRY FICHES
275
1. Belgium 276
2. Bulgaria 279
3. The Czech Republic 282
4. Denmark 285 5. Germany 288 6. Estonia 291 7. Ireland 294 8. Greece 297 9. Spain 300 10. France 303 11. Croatia 306 12. Italy 309 13. Cyprus 312 14. Latvia 315 15. Lithuania 318 16. Luxembourg 321 17. Hungary 324 18. Malta 327 19. The Netherlands 330 20. Austria 333 21. Poland 336 22. Portugal 339 23. Romania 342
24. Slovenia 345 25. Slovakia 348 26. Finland 351 27. Sweden 354 28. United Kingdom 357 29. Norway 360 30. Euro Area 363 31. European Union 27 366 32. European Union* 369
Part V: Resources
373
1. Abbreviations and symbols used 374
2. References 378
LIST OF TABLES
1. Overview of the 2018 long-term budgetary projections – Baseline
scenario 12
2. Overview of the 2018 long-term budgetary projections – TFP risk scenario 12 3. Overview of the 2018 long-term budgetary projections – AWG risk
scenario 12
I.1.1. Projection of net migration flows, 2016-70 19
I.1.2. Total population projections, 2016-70 22
I.1.3. Decomposition of the population by age-groups, 2016 and 2070 23 I.1.4. Demographic dependency ratios, 2016-2070 (%) 24 I.1.5. Comparison of population and dependency ratio projections used in
2018 and 2015 Cost of Ageing projection exercises, 2016 - 2060 25 I.1.6. Comparison of demographic assumptions used in 2018 and 2015 Cost of
Ageing projection exercises, 2016-60 26
I.1.7. Old-age dependency ratio (65+/(15-64) 28
I.2.1. Decomposition of annual average potential GDP growth rates,
2016-2070 (%) 42
I.2.2. Long-term projections compared (2015 and 2018 projections): labour
force developments 44
I.2.3. Long-term projections compared (2015 and 2018): potential GDP growth
and its determinants 45
I.3.1. Overview of sensitivity tests and policy scenario 46 I.3.2. Decomposition of average annual potential GDP growth of the
European Union, 2016-2070 (%) 47
II.1.1. Main public pension scheme types in the EU 50 II.1.2. Automatic balancing mechanisms, sustainability factors and links to life
expectancy in pension systems 54
II.1.3. Statutory retirement ages, early retirement (in brackets) and incentives to
postpone retirement 56
II.1.4. Average effective exit age from the labour market by gender 57 II.1.5. Duration of retirement by gender, also as percentage of average
II.1.6. Contributions to the public pension system in 2016 and 2070 (% of GDP) 60 II.1.7. Contribution rates to the public pension system 61 II.1.8. Level and change in gross public pension expenditure; 2016-2070,
baseline scenario (%/pps. of GDP) 66
II.1.9. Breakdown per period of change in gross public pension expenditure
(pps. of GDP) 69
II.1.10. Change in public pension expenditure per age group in 2016-2070 (pps.
of GDP) 74
II.1.11. Breakdown of change in gross public pension expenditure; 2016-2070
(pps. of GDP) 78
II.1.12. Contribution of the dependency ratio effect to the change in public
pension expenditure (pps. of GDP) 79
II.1.13. Coverage ratio (% of population >65y) 80 II.1.14. Contribution of the coverage ratio effect to the change in public
pension expenditure (pps. of GDP) 80
II.1.15. Contribution of the benefit ratio effect to the change in public pension
expenditure (pps. of GDP) 81
II.1.16. Contribution of the labour market effect to the change in public pension
expenditure (pps. of GDP) 81
II.1.17. Benefit ratio: 2016 and 2070 (in %) 82
II.1.18. Replacement rates in 2016 and 2070 (%) 84 II.1.19. Minimum pensions (non-contributory only) 85 II.1.20. Contributory period for new pensions (number of years) 87 II.1.21. Average effective accrual rates of new public pensions 87 II.1.22. Summary table: impact of all sensitivity tests on the change in gross
public pension expenditure in 2016-2070 (deviation from baseline, pps. of
GDP) 93
II.1.23. Comparison of gross public pension expenditure levels in 2016 and 2060: 2015 vs. 2018 Ageing Reports (% and pps. of GDP) 96 II.1.24. Breakdown of the difference in the gross public pension expenditure
change in 2016-2060 between the 2018 and 2015 Ageing Reports (pps.
of GDP) 97
II.1.25. Alternative breakdown of the difference in the gross public pension expenditure change in 2016-2060 between the 2018 and 2015 Ageing
Reports (pps. of GDP) 99
II.1.26. Scope for improvement in the Member States' projections 100 II.2.1. Overview of the scenarios used to project health care spending 113 II.2.2. Health care reforms with direct budget impact taken into account in the
projections 116 II.2.3. Demographic scenario - projected increase in public expenditure on
health care over 2016-2070, as % of GDP 118
II.2.4. High life expectancy scenario - projected increase in public expenditure on health care over 2016-2070, as % of GDP. 118 II.2.5. Healthy ageing scenario - projected increase in public expenditure on
health care over 2016-2070, as % of GDP 119
II.2.6. Death-related costs scenario - projected increase in public expenditure on health care over 2016-2070, as % of GDP 119 II.2.7. Income elasticity scenario - projected increase in public expenditure on
II.2.8. The EU28 cost convergence scenario - projected increase in public
expenditure on health care over 2016-2070, as % of GDP 121 II.2.9. Labour intensity scenario - projected increase in public expenditure on
health care over 2016-2070, as % of GDP 122
II.2.10. Sector-specific composite indexation scenario - projected increase in
public expenditure on health care over 2016-2070, as % of GDP 122 II.2.11. Non-demographic determinants scenario - projected increase in public
expenditure on health care over 2016-2070, as % of GDP 123 II.2.12. AWG reference scenario - projected increase in public expenditure on
health care over 2016-2070, as % of GDP 123
II.2.13. AWG risk scenario - projected increase in public expenditure on health
care over 2016-2070, as % of GDP 124
II.2.14. TFP risk scenario - projected increase in public expenditure on health
care over 2016-2070, as % of GDP 124
II.2.15. Overview of scenario results - increase in public expenditure on health
care over 2016-2070, as pps. of GDP 125
II.2.16. Sensitivity tests of the AWG reference scenario on health care - increase in public expenditure on health care over 2016-2070, as pps. of GDP 126 II.2.17. Decomposing the impact of drivers on differences in spending growth in
health care expenditures between the 2018 and 2015 Ageing Reports, in
pps. of GDP 128
II.3.1. Overview of different scenarios used to project long-term care spending 140 II.3.2. Long-term care reforms with direct budget impact taken into account in
the projections 143
II.3.3. Projections with country-specific indexation vs standard indexation 144 II.3.4. Demographic scenario, projected public expenditure on long-term care
as % of GDP 144
II.3.5. Base case scenario, projected public expenditure on long-term care as
% of GDP 145
II.3.6. High life expectancy scenario, projected public expenditure on
long-term care as % of GDP 146
II.3.7. Healthy ageing scenario, projected public expenditure on long-term
care as % of GDP 146
II.3.8. Shift from informal to formal care scenario, projected public expenditure
on long-term care as % of GDP 147
II.3.9. Coverage convergence scenario, projected public expenditure on
long-term care as % of GDP 147
II.3.10. Cost convergence scenario, projected public expenditure on long-term
care as % of GDP 148
II.3.11. Cost and coverage convergence scenario, projected public
expenditure on long-term care as % of GDP 148 II.3.12. AWG reference scenario, projected public expenditure on long-term
care as % of GDP 149
II.3.13. AWG risk scenario, projected public expenditure on long-term care as %
of GDP 149
II.3.14. Sensitivity scenarios - change in spending as % of GDP 2016-2070 150 II.3.15. Comparison between public long-term care spending as % of GDP in the
2018 and the 2015 Ageing Reports, in the base year (i.e. 2016) of current
II.3.16. Decomposing the impact of drivers on differences in spending growth (2016-2060) between the 2018 and the 2015 Ageing Reports- based on the reference case scenario, in pps. of GDP 153 II.3.17. Overview of results across scenarios – Change in spending as % of GDP
2016-2070 154 II.4.1. Government expenditure on education, baseline scenario, % of GDP 159
II.4.2. Breakdown of total variation in expenditure between 2016 and 2070 -
Baseline scenario 161
II.4.3. Breakdown of revisions in expenditure-to-GDP ratio (2018 AR round minus 2015 AR round) - Values for the Baseline scenario in 2060 162 II.4.4. Baseline and Sensitivity Scenarios (Public Expenditure-to-GDP ratio) -
Difference between 2016 and 2070 165
II.4.5. Alternative sensitivity scenarios - Difference from the Baseline in 2070 166 II.5.1. Periodic full and partial unemployment benefits, % of GDP 168 II.5.2. Unemployment rate projections, age 15-64, % of labour force 169 II.5.3. Unemployment benefit expenditure, baseline and alternative scenarios,
% of GDP, 2016-70 170
II.AI.1. Pension projections reporting framework: blocks common to all schemes 171 II.AI.2. Pension projections reporting sheet: decomposition of new public
pensions expenditure - earnings related for defined benefit (DB) schemes 173 II.AI.3. Pension projection reporting sheet: decomposition of new public pension
expenditure - earnings related for notional defined contribution (NDC)
schemes 173 II.AI.4. Pension projection reporting sheet: decomposition of new public pension
expenditure - earnings related for point schemes (PS) 173 II.AI.5. Pension projections reporting sheet: decomposition of new private
pension expenditure 174
II.AII.1. Pension schemes in EU Member States and projection coverage 175 II.AII.2. Coverage of special pensions in the 2018 pension projections 176 II.AII.3. Key indexation and valorisation parameters of pension system in Europe
(old-age pensions) 177
II.AII.4. Average retirement age (old-age pensions) and average exit age from
the labour market 178
II.AII.5. Special pension and public pension expenditure (2016) % of GDP 179 II.AII.6. Special pensions span (2016) % of pensioners 179 II.AIII.1. Overview of the health care data provided for and used in the 2018
Ageing Report 180
II.AIII.2. Data sources for the health care sector-specific indexation components 182 II.AIV.1. Combinations of data sources for estimating long-term care expenditure 184 II.AIV.2. Availability of input data for long-term care expenditure projections 185 II.AIV.3. Public expenditure on LTC on the basis of the SHA joint questionnaire with
proxy for HC.R.1 from ESSPROS as a % of GDP (2015 or latest) 186 II.AIV.4. Dependency rates, based on EU-SILC 188 II.AIV.5. Coverage rates in the base case scenario 189 II.AV.1. Base enrolment rates by country, age and ISCED level 191 II.AV.2. Expenditure-to-GDP ratio in the base period - Breakdown by component 192 II.AV.3. Expenditure-to-GDP ratio in the base period - Breakdown by ISCED levels 192 II.AV.4. Results of the Baseline scenario (Public education expenditure as
II.AV.5. Results of the High Enrolment Rate scenario (Public education
expenditure as percentage of GDP) 192
II.AV.6. Total expenditure on education, in levels (million euros) and as % of GDP 193
LIST OF GRAPHS
1. Overview of the 2018 long-term projection exercise 2 2. Population by age group and gender, 2016-70 (thousands) 3 3. Population and employment developments (million), EU 5 4. Total age-related expenditure (2016, peak year and 2070), % of GDP 6 5. Projected change in age-related expenditure (2016-70), by expenditure
component, pps. of GDP 7
6. Total public pension benefit ratio, in %, 2016 and 2070 8 7. Projected age-related expenditure (2016-70), different scenarios, % of
GDP, EU and EA 9
8. Projected change in age-related expenditure (2016-70), different
scenarios, pps. of GDP 10
9. Total age-related expenditure, different scenarios and by component,
2016 and 2070, % of GDP 11
10. Projected change in age-related and pension expenditure compared,
2018 and 2015 AR, 2016-60, pps. of GDP 11
I.1.1. Total average fertility rates in European Union and euro-area, 1960-2015 16 I.1.2. Projection of total fertility rates, 2016-2070 (number of births per woman) 17 I.1.3. Life expectancy at birth in the EU, 1960-2015 (in years) 17 I.1.4. Projection of life expectancy at birth, males (in years), 2016-2070 18 I.1.5. Projection of life expectancy at birth, females (in years), 2016-2070 18 I.1.6. Projection of life expectancy at 65, females (in years), 2016-2070 18 I.1.7. Projection of life expectancy at 65, males (in years), 2016-2070 18 I.1.8. Net migration flows, 1965-2015 (thousands) 19 I.1.9. Population by age group and gender, 2016-70 (thousands) 22 I.1.10. Population of main geographic areas and selected countries as
percentage of the world population 27
I.2.1. Impact of pension reforms on participation rates of persons aged 55-64 in
2070 (percentage points) 30
I.2.2. Impact of pension reforms on the average exit age from the labour force for persons aged 55-64 years old, 2016-2070 (increase in average exit
age in years) 31
I.2.3. Impact of pension reforms on participation rates of persons aged 65-74 in
2070 (percentage points) 32
I.2.4. Participation rates across ages and gender, 2016-70 (%) 33 I.2.5. Percentage changes in total labour supply of the population aged 20 to
64 and 20 to 74 (2016-2030, 2030-2070) (1) 34 I.2.6. Unemployment rate assumptions for those aged 15-64, 2016-70 (%) 35 I.2.7. Employment rate assumptions for those aged 20-64, 2016-2070 (%) (1) 36 I.2.8. Change in total hours worked by persons aged 15-74, 2016-2070 (%) (1) 37 I.2.9. Effective economic old age dependency ratio - inactive population
aged 65+/employed persons aged 20-64, 2016-2070 (%) (1) 38 I.2.10. Total economic dependency ratio - total inactive population/employed
I.2.11. Average annual GDP per capita growth rates, 2016-70 (%) (1) 40 I.2.12. Labour productivity per hour, annual average growth rates, 2016-2070
(%) 40
I.2.13. Annual average actual and potential GDP growth rates, 2016-2026 (%)
(1) 41
I.2.14. Determinants of annual average labour productivity growth: Total factor productivity and capital deepening (contribution in pps.), 2016-2070 41 I.2.15. Average annual potential GDP growth rates under baseline and TFP risk
scenarios, 2013-2070 (%) 43
I.2.16. Annual GDP growth rates 2016-2060 in the 2018 and 2015 baseline
scenario projections - period average (%) 43
I.3.1. Average annual potential GDP growth rates, 2016-70 (%) 47 I.3.2. Labour input (annual average growth rates) 2016-2070 (%) 48 I.3.3. Average annual growth rate in labour productivity, 2016-2070 (%) 48 II.1.1. Evolution of the average effective exit age (EEA) and statutory
retirement age (SRA) between 2016 and 2070 55 II.1.2. Increase in the average effective exit age from the labour market versus
shift in duration of retirement over the period 2016 – 2070 55 II.1.3. Change in gross public pension expenditure; 2016-2070 (pps. of GDP) 67 II.1.4. Pension spending in 2016 and 2070: relative position towards the EU
average (pps. of GDP) 67
II.1.5. Change in gross public pension expenditure prior to 2016, selected
countries (pps. of GDP) 67
II.1.6. Change in gross public pension expenditure for the main general
schemes, 2016-2070 (pps. of GDP) 68
II.1.7. Gross public pension expenditure in EU: time profile 2016-2070 (%GDP) 69 II.1.8. Years and increase to peak expenditure 70 II.1.9. Gross public pension expenditure: time profile 2016-2070 for selected
countries (%GDP) 71
II.1.10. Share of public pensioners per age group: EU (% of total public
pensioners) 72 II.1.11. Share of public pensioners per age group: 2070 vs. 2016 (% of total public
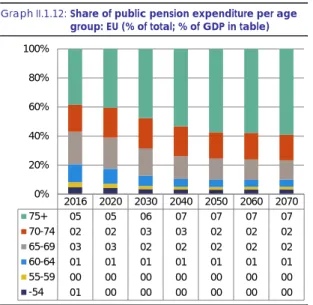
pensioners) 73 II.1.12. Share of public pension expenditure per age group: EU (% of total; % of
GDP in table) 74
II.1.13. Gross versus net public pension expenditure in 2016 and 2070 (% of GDP) 75 II.1.14. Private (occupational and individual) pension schemes: expenditure and
contributions in 2016 and 2070 (% of GDP) 75
II.1.15. Contribution to change in gross public pension expenditure; 2016-2070
(pps. of GDP) 76
II.1.16. Impact of an increase of life expectancy on the change in gross public pension expenditure in 2016-2070 (deviation from baseline, pps. of GDP) 88 II.1.17. Impact of lower migration on the change in gross public pension
expenditure in 2016-2070 (deviation from baseline, pps. of GDP) 89 II.1.18. Impact of higher migration on the change in gross public pension
expenditure in 2016-2070 (deviation from baseline, pps. of GDP) 89 II.1.19. Impact of lower fertility on the change in gross public pension
II.1.20. Impact of lower overall employment rate of age group 20-64 on the change in gross public pension expenditure in 2016-2070 (deviation from
baseline, pps. of GDP) 90
II.1.21. Impact of higher overall employment rate of age group 20-64 on the change in gross public pension expenditure in 2016-2070 (deviation from
baseline, pps. of GDP) 90
II.1.22. Impact of higher employment rate among older workers on the change in gross public pension expenditure in 2016-2070 (deviation from
baseline, pps. of GDP) 91
II.1.23. Impact of higher/lower TFP growth on the change in gross public pension expenditure in 2016-2070 (deviation from baseline, pps. of GDP) 92 II.1.24. TFP risk scenario: impact on the change in gross public pension
expenditure in 2016-2070 (deviation from baseline, pps. of GDP) 92 II.1.25. Impact of linking retirement age to life expectancy on the change in
gross public pension expenditure in 2016-2070 (deviation from baseline,
pps. of GDP) 93
II.1.26. Change in gross public pension expenditure in 2016-2070: baseline scenario, baseline + most favourable scenario & baseline + least
favourable scenario (% of GDP) 94
II.1.27. Change in gross public pension expenditure in 2016-2060: latest
projections vs. 2015 Ageing Report (pps. of GDP) 95 II.1.28. Revision of the dependency ratio and of the change in gross public
pension expenditure ratio in 2016-2060 in the 2018 Ageing Report as
compared to the 2015 Ageing Report (pps. of GDP) 98 II.1.29. Revision of the benefit ratio and of the change in gross public pension
expenditure ratio in 2016-2060 in the 2018 Ageing Report as compared to
the 2015 Ageing Report (pps. of GDP) 98
II.2.1. Age-related expenditure profiles of health care provision (spending per
capita as % of GDP per capita) in 2016 103
II.2.2. Schematic presentation of the projection methodology 108 II.2.3. Projected increase in public expenditure on health care due to
demographic change over 2016-2070, as % of GDP 117 II.2.4. Impact of demography and health status - comparison between
scenarios in EU15 and NMS 120
II.2.5. Range of results from different scenarios on health care in EU28 125 II.2.6. Sensitivity tests of the AWG reference scenario on health care, EU28 126 II.2.7. Age-gender expenditure profiles and population changes in the 2018
and 2015 Ageing Reports 129
II.3.1. Total and public long-term care expenditure in the EU, as % GDP 132 II.3.2. Total (public) expenditure on long-term care in the EU, as a share of total
(public) current health expenditure 132
II.3.3. Age-related coverage of dependent population by type of care
provided in the EU, as % of population 133
II.3.4. Country-specific coverage rates of long-term care recipients, as % of
dependent population 134
II.3.5. Median dependency rates by age-group for EU28, based on EU-SILC 134 II.3.6. Institutional care: Expenditure per recipient of long-term care services in
institutional care, as % of GDP per capita 135 II.3.7. Home care: Expenditure per recipient of long-term care services in home
II.3.8. Cash benefits: Expenditure per recipient of long-term care cash benefits
care, as % of GDP per capita 135
II.3.9. Schematic presentation of the projection methodology 139 II.3.10. Demographic scenario, current and projected levels of public
expenditure on LTC as % of GDP; 2016-2070 145 II.3.11. AWG reference scenario: Differences in the projected increase in public
expenditure on long-term care over 2016-2060 between the 2018 and
2015 Ageing Report, as pps. of GDP 151
II.3.12. Projected expenditure in different LTC scenarios for the EU in % of GDP 154 II.3.13. Projected expenditure in LTC AWG reference and risk scenarios, for the
EU in % of GDP 154
II.3.14. Range of results for scenarios with mainly demographic sensitivity analysis (no policy change scenarios), EU in % of GDP 155 II.3.15. Range of results for scenarios with mainly cost and coverage sensitivity
analysis (policy change scenarios), EU in % of GDP 155 II.4.1. Students-to-Staff ratio across ISCED levels (Base Year 2016) 157 II.4.2. Average compensation per member of staff as ratio of GDP per worker
(Base Year 2016) 158
II.4.3. Structure of public expenditure on education as a percentage of GDP
(Base Year 2016) 158
II.4.4. Changes in government expenditure by ISCED level between 2016 and
2070 160
II.4.5. Comparison of students and employed between the 2015 AR and the
2018 AR - Values for the baseline scenario in 2060 163 II.AIV.1. Expenditure profiles of long-term care services by age and gender in the
EU15, spending per recipient as % of GDP per capita and comparing
2018 and 2015 Ageing Reports 187
II.AIV.2. Expenditure profiles of long-term care recipients in the New Member States, spending per recipient as % of GDP per capita and comparing
2018 and 2015 Ageing Reports 187
LIST OF BOXES
I.1.1. Methodology for the migration assumptions in the 2015-based
population projections 20
II.1.1. Average retirement age versus average exit age from the labour market 58
II.1.2. Special pensions in the EU 62
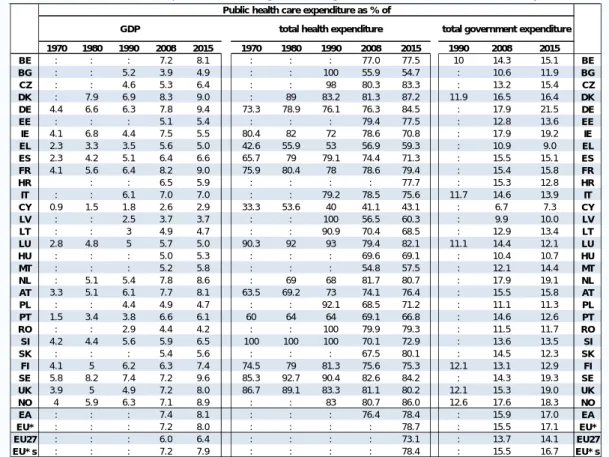
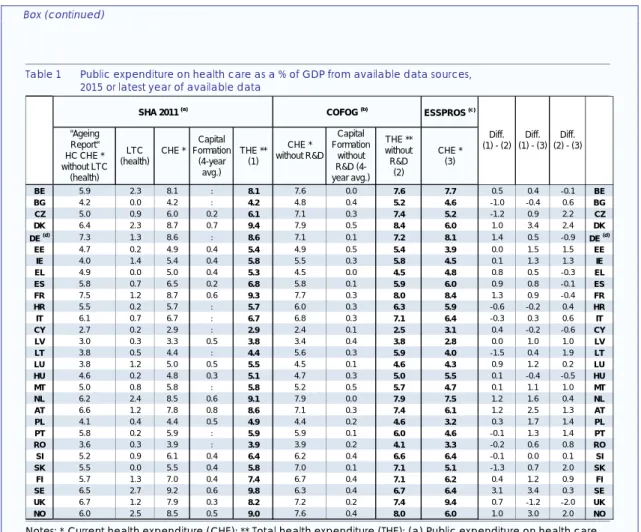
II.1.3. Breakdown of the pension expenditure-to-GDP ratio 77 II.2.1. Public health care expenditure through the last decades 102 II.2.2. Income elasticity of health care demand, a short literature survey 106 II.2.3. Excess cost growth in health care expenditures, a short literature survey 107 II.2.4. Internationally comparable data on total public health care expenditure 109
The sustainability of public finances in the EU can be better monitored and safeguarded if its analysis banks on reliable and comparable information on possible challenges, including the expected strains caused by the demographic changes ahead.
For this reason, the ECOFIN Council gave a mandate to the Economic Policy Committee (EPC) to produce a new set of long-term budgetary projections by 2018, on the basis of new population projections to be provided by Eurostat.
The EPC and the Commission services (Directorate-General for Economic and Financial Affairs - DG ECFIN) agreed on a work programme with broad arrangements to organise the budgetary projections and reach an agreement on its assumptions and methodologies to discharge this mandate (see the overview of the projection exercise for details).
The long-term projections show where (in which countries), when, and to what extent ageing pressures will accelerate as the baby-boom generation retires and as the people in the EU are expected to live longer in the future. Hence, the projections are helpful in highlighting the immediate and future policy challenges for governments posed by projected demographic trends. The report provides a very rich set of information at the individual country level which covers a long time-span (until 2070), compiled in a comparable and transparent manner.
The projections feed into a variety of policy debates and processes at EU level, including the overarching Europe 2020 strategy for smart, sustainable and inclusive growth. In particular, they are used in the context of the European Semester so as to identify policy challenges, among others in setting the medium-term budgetary objectives (MTOs), in the annual assessment of the sustainability of public finances carried out as part of the Stability and Growth Pact, and in the analysis on the impact of ageing populations on the labour market and potential economic growth.
Coverage and overview of the 2018 long-term projection exercise
The long-term projections take as starting point Eurostat's population projections for the period 2016 to 2070. In addition, the EPC, on the basis of proposals prepared by the Commission services (DG ECFIN) and the Ageing Working Group (AWG) of the EPC, agreed upon assumptions and methodologies common for all Member States to project a set of exogenous macroeconomic variables covering the labour force (participation, employment and unemployment rates), labour productivity, and the real interest rate (see Graph 1). This combined set of projections enabled the calculation of GDP for all Member States up to 2070. The macroeconomic assumptions on which this report is based were agreed upon in the first half of 2017 and published in November 2017 (1).
On the basis of these assumptions, separate budgetary projections were carried out for five government expenditure items. The projections for pensions were run by the Member States using their own national model(s), reflecting current pension legislation (2). In this way, the projections benefit from capturing the country-specific circumstances prevailing in the different Member States as a result of different pension legislation, while at the same time ensuring consistency by basing the projections on commonly agreed
(1) See European Commission (DG ECFIN) and Economic Policy Committee (AWG) (2017) "2018 Ageing Report: Underlying assumptions and projection methodologies", European Commission, European Economy, Institutional papers No 65.
(2) In order to ensure high quality and comparability of the pension projection results, an in-depth peer review was carried out by the AWG and the Commission in several meetings during September-December 2017. The projections incorporate pension legislation in place at that time. No further reform measures after 1 December 2017 have been incorporated in this report.
underlying assumptions. A novelty in this projection round is a detailed account of the extent to which special pensions (those which have different conditions for a pension from the general pension schemes prevailing in a country) are an important part of public pension provision in the EU countries.
The projections for health care, long-term care, education and unemployment were run by the European Commission (DG ECFIN) on the basis of a common projection model for each expenditure item, taking into account country-specific settings where appropriate. The results of this set of projections are aggregated to provide an overall projection of age-related public expenditure (see Graph 1).
Graph 1: Overview of the 2018 long-term projection exercise
Source: Commission services, EPC.
There is uncertainty surrounding these long-term projections, which are made under a 'no-policy-change' assumption to illustrate what the future could be if current policies remain unchanged. The projection results are strongly influenced by the underlying assumptions. For this reason, a set of sensitivity tests are carried out to illustrate the extent to which the public expenditure projections are sensitive to key assumptions.
This report is structured in two parts. The first part describes the underlying assumptions: the population projection, the labour force projection and the macroeconomic assumptions used. The second part presents the long-term budgetary projections on pensions, health care, long-term care, education and unemployment benefits. A Statistical Annex gives an overview of the main assumptions and macroeconomic projections as well as projection results of age-related expenditure items by area and by country.
2. THE ECONOMIC AND BUDGETARY IMPACT OF POPULATION AGEING
Significantly lower working-age population projected for the EU over the coming decades
The demographic projections over the long term reveal that the EU is ‘turning increasingly grey’ in the coming decades. The total population in the EU is projected to increase from 511 million in 2016 to 520 million in 2070, but the working-age population (15-64) will decrease significantly from 333 million in 2016 to 292 million in 2070 due to fertility, life expectancy and migration flow dynamics (3).
Graph 2: Population by age group and gender, 2016-70 (thousands)
Source: Commission services, Eurostat.
For males, the projected population in 2070 is lower than or close to the population in 2016 in all age cohorts between 0 and 64 years old. Conversely, in all age cohorts of 65 years old and above, the projected population in 2070 is higher than in 2016. For females, the projected population in 2070 is lower than or close to the population in 2016 in all age cohorts between 0 and 69. Conversely, in the age cohorts above 69 years old, the projected population in 2070 will be higher than in 2016. Moreover, while in 2016 the largest cohort for both males and females is 45-49 years old, in 2070 the largest cohort will be 70-74 years old for women and 50-54 years old for men (see Graph 2). Overall, the median age will rise by 4 years for both men and women by 2070. Similar developments are projected for the euro area. The projected changes in the population structure reflect assumptions on fertility rates, life expectancy and migration flows. The total fertility rate is assumed to rise in almost all Member States between 2016 and 2070, increasing from 1.58 to 1.81 for the EU as whole. In the EU, life expectancy at birth for males is expected to increase by 7.8 years over the projection period, from 78.3 in 2016 to 86.1 in 2070. For females, life expectancy at birth is projected to increase by 6.6 years, from 83.7 in 2016 to 90.3 in 2070, implying a convergence of life expectancy between males and females. Annual net migration inflows to the EU are projected to decrease from about 1.5 million people in 2016 to 0.8 million people by 2070, representing a decreased contribution from 0.3% to 0.15% of the total population.
(3) For EU27 (all EU countries except the UK), the total population is projected to decrease from 445 million in 2016 to 439 million in 2070, and the working age population (15-64) is projected to fall from 291 million in 2016 to 246 million in 2070.
0 5000 10000 15000 20000 Males 2070 Males 2016
EU28 - Population by age groups and sex
0 5000 10000 15000 20000 0-4 5-9 10-14 15-19 20-24 25-29 30-34 35-39 40-44 45-49 50-54 55-59 60-64 65-69 70-74 75-79 80-84 85-89 90+ 0 5000 10000 15000
Females 2070 Females 2016 Males 2070 Males 2016
EA - Population by age groups and sex
0 5000 10000 15000 0-4 5-9 10-14 15-19 20-24 25-29 30-34 35-39 40-44 45-49 50-54 55-59 60-64 65-69 70-74 75-79 80-84 85-89 90+ Females 2070 Females 2016
The projected demographic old-age dependency ratio almost doubling over the long-term
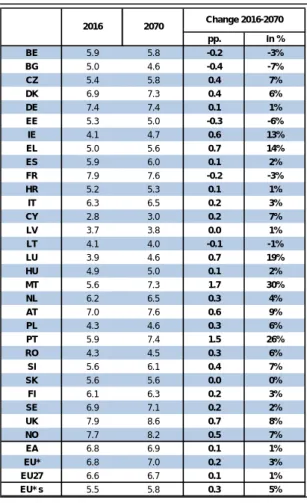
The old-age dependency ratio (people aged 65 and above relative to those aged 15 to 64) in the EU is projected to increase by 21.6 pps. over the projection period, from 29.6% in 2016 to 51.2% in 2070. This implies that the EU would go from having 3.3 working-age people for every person aged over 65 years to only two working-age persons. Most of this increase is driven by the very old-age dependency ratio (people aged 80 and above relative to those aged 15-64) which is rising by 14 pps. (8.3% to 22.3%) over this horizon.
Overall participation and employment rates projected to rise, in particular for women and for older workers thanks to implemented pension reforms
Participation rates are projected using a cohort simulation model (CSM), which allows taking into account assumptions on the impact on the participation rate of older workers of legislated pension reforms, including measures to be phased in gradually. In most of the EU Member States that have recently legislated pension reforms, these are projected to have a sizeable impact on the labour market participation of workers aged 55-64, depending on their magnitude and phasing in. The projections show an average increase of approximately 12.2 pps. in the participation rate for men (4). The expected increase in the participation rates of women between 55-64 years old is slightly higher (16.2 pps. on average), reflecting the progressive convergence of participation rates across genders in a number of countries. The total participation rate for those aged 20-64 is projected to rise from 77.5% in 2016 to 80.7% in 2070 in the EU as a whole and from 77.6% to 80.6% in the euro area. This is being driven by higher female participation, which is projected to rise by 5.5 pps. compared with 0.8 pps. for males in the EU and by 5.7 pps. compared with 0.3 pps. for men in the euro area.
Labour supply will decline because of the projected drop of the working-age population
Total labour supply for those aged 20 to 64 in the EU is projected to fall by 9.6% over 2016-70, of which 2% by 2030 and a further 7.8% between 2030 and 2070. In the euro area, the projected fall in labour supply is 9.7% over the entire period, of which 2.3% takes place between 2016 and 2030 and a further 7.5% between 2030 and 2070.
Employment rates expected to rise…
Given the population projection, the labour force projection and the unemployment rate assumptions (5), the total employment rate (for persons aged 20 to 64) in the EU is projected to increase from 71.1% in 2016 to 73.9% in 2030 and 75.8% in 2070. In the euro area, a similar development is expected, with the employment rate rising from 69.9% in 2016 to 75.3% in 2070.
…while employment is projected to fall
The population projection trends have significant effects on labour market. Three distinctive periods can be identified for the EU (See Graph 3).
− 2007-2010: the working-age population was growing, but employment was sluggish as the financial and economic crisis weighed on job growth during this period.
− 2011-2020: the working-age population starts to decline as the baby-boom generation enters retirement. However, the assumed reduction in unemployment rates, the projected increase in the
(4) Unweighted average of the 26 Member States considered.
(5) A reduction in the unemployment rate in the EU as a whole of around 2 ¼ percentage points is projected over the long-term (to 6 ½% in 2070). A slightly larger fall of 2 ¾ pps is projected for the euro area (to 6 ½% in 2070).
employment rates of women and older workers cushion the impact of demographic change, and the overall number of persons employed start to increase during the latter part of this period.
− From 2021: the projected increase in employment rates is slower, as trend increases in female employment and the impact of pension reforms will be less pronounced. Hence, both the working-age population and the number of persons employed falls over the remainder of the projection period. Graph 3: Population and employment developments (million), EU
60 64 68 72 76 80 190 210 230 250 270 290 310 200 7 201 2 201 7 202 2 202 7 203 2 203 7 204 2 204 7 205 2 205 7 206 2 206 7 RH S -E mploy m en t ra te L H S -P op ul at ion & Emp loy ment
Source: Commission services, Eurostat, EPC.
Stable potential GDP growth projected over the long-term
In the EU as a whole, the average annual GDP growth rate is projected to remain quite stable over the long-term. After an average potential growth of 1.2% up to 2040, an increase to 1.5% is projected over the remainder of the projection horizon. Over the whole period 2016-2070, the average annual GDP growth rate in the EU is projected to be 1.4%. Developments in the euro area are slightly less positive than in the EU as a whole, with an average annual growth rate of 1.3% over 2016-2070. In per capita terms, developments are projected to be similar, with average potential GDP growth of 1.3% in both the EU and the euro area.
The sources of GDP growth will alter dramatically over the projection horizon. Labour will make a positive contribution to growth in both the EU and the euro area up to the 2020s, but turn negative thereafter. For the EU and for the euro area, an assumed increase of employment rates makes a positive contribution to average potential GDP growth. However, this is more than offset by a decline in the share of the working-age population, which is a negative influence on growth (by an annual average of -0.2 percentage points). As a result, labour input contributes negatively to output growth on average over the projection period (by 0.1 pps. in the EU and by 0.2 pps. in the euro area). Hence, labour productivity growth, driven by TFP growth, is projected to be the sole source of potential output growth in both the EU and the euro area over the entire projection period.
Working-age population (20-64) - EU (LHS) Total employment (20-64) - EU (LFS) Employment rate (20-64) (RHS)
Millions Until 2010: sluggish employment and slow growth in working-age
2010-20: rising employment, declining
working-age population
From 2021 onwards: both employment and working-age
Budgetary projections: population ageing put upward pressure on public spending
The fiscal impact of ageing is projected to be a significant challenge in almost all Member States, with effects becoming apparent already during the next two decades in many countries. As in previous long-term projection exercises, a baseline scenario (the AWG reference scenario) focuses on the budgetary impact mostly due to demographic developments.
Additionally, there is considerable uncertainty as to future developments of age-related public expenditure, related to future GDP growth prospects, in particular as regards TFP growth, uncertainty of the population projections and to the challenge to cope with trend increases in public spending in particular on health care and long-term care. For this reason, a set of sensitivity tests are carried out to illustrate the extent to which the public expenditure projections are sensitive to key assumptions such as demographic assumptions, labour force and macro-economic assumptions and assumptions on the cost drivers (see section on risk scenarios below).
Baseline projection results
In the baseline scenario, the total cost of ageing was 25% of GDP in 2016 and is projected to rise by 1.7 pps. of GDP (baseline scenario) in the period to 2070 in the EU. In the euro area, it is projected to rise from 26% of GDP in 2016 by 1.1 pps. in the baseline scenario up to 2070 (see Graph 4 and Table 1). The peak in age-related expenditure as a share of GDP takes place in the middle of the projection horizon. This reflects primarily the expenditure profile for pension expenditure. For a majority of countries, the highest value is reached before the end of the projection horizon (see Graphs 4 and 7). This results from the projection of pension expenditure, where the impact of reforms often takes a long time to set in. In addition, in several countries, the population ageing effect peaks before 2070 (the old-age dependency ratio does not increase over the entire projection horizon). Hence, the limited decline in pension expenditure (as a share of GDP) is projected to materialize only after nearly three decades of further increases in the EU overall.
Graph 4: Total age-related expenditure (2016, peak year and 2070), % of GDP
10 15 20 25 30 35 40 LV LT HR RO EE IE EL CY BG PL SK HU ES CZ PT SE NL UK MT IT DE DK FR SI LU AT FI BE NO EA EU* EU 2 7 2016 2070 Peak
Source: Commission services, EPC.
There is however considerable variety across EU Member States and also in the profile over time in the long-term spending trends (see Graphs 4, 5 and Table 1). According to the projections:
− A fall in total age-related expenditure relative to GDP is projected in eight Member States (EL, HR, FR, LV, EE, IT, LT and ES). In all of these countries, a decline in the pension-to-GDP ratio is projected over the long-term (exceeding 3 pps. of GDP in EL, HR and FR).
− For another set of countries (PT, DK, CY, PL, SE, RO, BG, FI, HU and SK), the age-related expenditure ratio is expected to rise moderately (by up to 3 pps. of GDP).
− The age-related expenditure ratio increase is projected to be the largest in the remaining ten Member States (NL, AT, IE, DE, UK, BE, CZ, SI, MT and LU), rising by 3 pps. of GDP or more and with pension expenditure increasing in all of these countries (exceeding 2.5 pps. of GDP in LU, SI, BE, MT and CZ ).
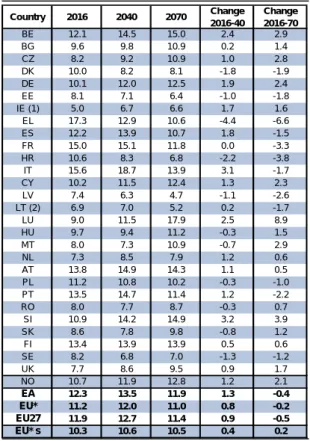
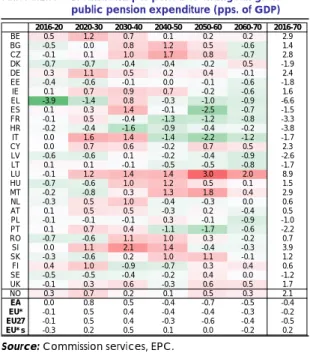
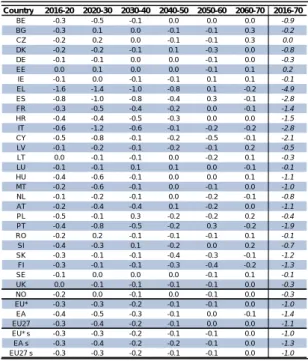
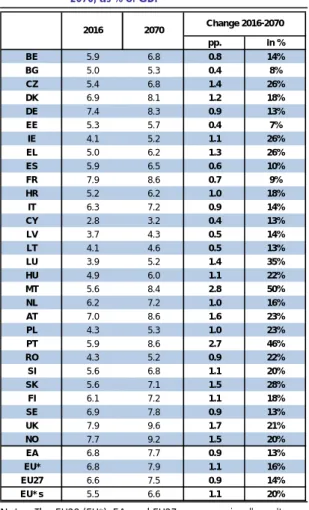
Looking at the components of age-related expenditure in the baseline scenario, the increase up to 2070 is mostly driven by long-term care and health care spending, which combined is projected to rise by 2.1 pps. of GDP (Long-term care: +1.2 pps., Health care: +0.9 pps.) in the EU (EA: +1.8 pps.). After a projected increase of 0.8 pps. of GDP up to 2040 (EA: +1.3 pps.), public pension expenditure is projected to return close to its 2016 level (EU: -0.2 pps., EA: -0.4 pps.). However, the projected decline in pension spending is mostly visible in the latter part of the projection horizon. Education expenditure is projected to remain unchanged by 2070. Unemployment benefit expenditure is projected to decline by 0.2 pps. of GDP (see Graph 5 and Table 1).
Graph 5: Projected change in age-related expenditure (2016-70), by expenditure component, pps. of GDP
Source: Commission services, EPC.
-10 -5 0 5 10 15 -10 -5 0 5 10 15 EL HR FR LV EE IT LT ES PT DK CY PL SE RO BG FI HU SK NL AT IE DE UK BE CZ NO SI MT LU EA EU* EU 27
A reduction of public pension spending as a share of GDP over the long term is projected in 12 Member States (EL, HR, FR, LV, PT, DK, EE, IT, LT, ES, SE and PL), as a result of implemented pension reforms (see Table 1). These reform measures, including changes to the retirement age and the pension benefit, have primarily been adopted to address fiscal sustainability concerns of pension systems. As a consequence, the public pension benefit ratio (average pensions in relation to average wages) is projected to decline in almost all Member States and on average in the EU by 10.6 pps. over the period 2016-70 (see Graph 6) (6). For some countries the decline is projected to be 20 pps. or more (EL, PL, PT, CY and
(6) These pension projections are made on the basis of current pension policies under the ‘no policy change’ assumption. If pensions were to be perceived as 'too low' in the future, policy changes could occur (through measures increasing pension expenditure i.e. via higher indexation or changes to eligibility requirements).
ES). Pension reforms leading to low public pension benefit ratios could be politically challenging over the long run, and could give rise to upward risks to the pension expenditure projections.
However, many countries also have private pension schemes, and the total benefit ratio in 2070 is on average 10.5 pps. higher (for countries where private pensions are reported) (7). Moreover, the decline in the minimum pension benefit ratio is much smaller in most countries because those pensions are indexed to wages (or similar) (8), and is projected to decrease by 1.7 pps. on average in the EU (9). Hence, risks relating to minimum pensions being too low in the future are contained, due to higher indexation of minimum pensions compared with the general pension scheme.
Graph 6: Total public pension benefit ratio, in %, 2016 and 2070
Note: the EU aggregates are simple averages in this graph.
0 10 20 30 40 50 60 70 80 90 0 10 20 30 40 50 60 70 80 90 LV HR LT EE SE PL RO IE UK BG SI HU NL PT DK DE NO FR CZ ES SK AT MT BE CY EL FI IT LU EU* EA EU 27
Source: Commission services, EPC.
Risk analysis supplements the baseline projection results
Given the very long time-span over which the projections are made, there is considerable upside and downside uncertainty as to future developments of age-related public expenditure. The budgetary projections were also run with a set of alternative scenarios to assess the sensitivity of age-related government expenditure to different underlying assumptions (demographic, macro-economic and in terms of cost drivers).
Two of these scenarios were therefore carried out for all budgetary items, as was the case in the previous report, defined as follows:
− TFP risk scenario (10
): In light of the trend decline in TFP growth performance over the last decades in the EU, due visibility and prominence should also be given to the risk of lower TFP growth in the future. Thus, a TFP risk scenario is included, with a lower TFP growth rate (converging to 0.8% instead of 1%). The TFP risk scenario essentially shows that GDP growth could be much lower in the event that future TFP growth rates developed less dynamically than in the baseline scenario, i.e. more in line with the growth rate (0.8%) observed over the last 20 years. In this scenario, potential GDP
(7) Private pension projections are available for nine Member States (DK, EE, HR, LV, LT, NL, PT, RO and SE).
(8) In addition, even when this is not the case, in the projections for minimum pensions it is assumed that they are indexed to wages after ten years at the most, so as to retain the principle of those pension schemes to provide a minimum income also in the future.
(9) Minimum pension projections are available for all but nine Member States (CZ, DE, EL, HR, CY, LU, NL, AT and SI). (10) With an impact on the projections for pensions, health care and long-term care.
would grow by 1.1% on average up to 2070 in the EU and the euro area, as opposed to 1.4% and 1.3%, respectively, in the baseline scenario.
− AWG risk scenario (11
): Non-demographic drivers may exercise an upward push on costs in the health care and long-term care areas. In order to gain further insights into the possible importance of such developments, another set of projections was run which assumes the partial continuation of recently observed trends in health care expenditure due to, e.g. technological progress. Moreover, an upward convergence of coverage and costs to the EU average is assumed to take place in long-term care.
Risk scenario projections
Graph 7 illustrates the projected increase in age-related expenditure (total and strictly) over 2016-70 in the three different scenarios (Baseline, TFP risk and AWG risk ) for the EU and the EA. In the EU as a whole, the total cost of ageing was 25% of GDP in 2016 and is projected to rise by 1.7 pps. of GDP (baseline scenario), by 2.2 pps. (TFP risk scenario) and by as much as 4 pps. (AWG risk scenario) in the period to 2070. In the euro area, it is projected to rise from 26% of GDP in 2016 by 1.1 pps. (baseline scenario), by 1.7 pps. (TFP risk scenario) and by 3.6 pps. (AWG risk scenario) up to 2070.
Graph 7: Projected age-related expenditure (2016-70), different scenarios, % of GDP, EU and EA
24 25 26 27 28 29 30 2016 2026 2036 2046 2056 2066 EU - total age-related
Source: Commission services, EPC.
The projected rise in strictly age-related expenditure (pensions, health care, long-term care and education) is higher, since unemployment benefit expenditure is projected to fall in the period to 2070 (by 0.2 pps. of GDP in the EU and the EA, see Table 1 and Graph 7). The projected rise in strictly public age-related expenditure is almost 1.8 pps. of GDP in the EU (EA: +1.4 pps.) between 2016 and 2070 in the baseline
(11) With an impact on the projections for health care and long-term care.
Baseline AWG risk TFP risk
24 25 26 27 28 29 30 2016 2026 2036 2046 2056 2066 EA - total age-related
Baseline AWG risk TFP risk
24 25 26 27 28 29 30 2016 2026 2036 2046 2056 2066 EU - strictly age-related
Baseline AWG risk TFP risk
24 25 26 27 28 29 30 2016 2026 2036 2046 2056 2066 EA - strictly age-related
scenario (see Table 1 and Graph 7) (12). A higher increase is projected in the TFP risk scenario, up by 2.4 pps (EA: +1.9pps) and in the AWG risk scenario, rising by 4.1 pps (EA: +3.8 pps.)
Graph 8: Projected change in age-related expenditure (2016-70), different scenarios, pps. of GDP
Source: Commission services, EPC.
The TFP risk scenario primarily affects pension expenditure, projected to rise by ½ pps. of GDP more on average (EU and EA) up to 2070 compared with the baseline scenario. This is because pensions in payments are in many countries projected to rise in line with inflation, i.e. slower than wages (which evolve in line with labour productivity growth, which in turn depends on TFP growth). By contrast, it only has a small impact on health care and long-term care, as unit costs in these areas are closely linked to labour productivity growth and hence with wage growth. The projected increase in total age-related expenditure would be about ½ pps. of GDP higher than the baseline scenario up to 2070 in the EU and EA (see Graph 8, Graph 9 and Table 2).
The AWG risk scenario has an important effect on health care and long-term care expenditure. The projected increase in total age-related expenditure would be 2 ½ pps. of GDP higher than the baseline scenario up to 2070 for both the EU as a whole and the EA. It would entail an increase over the entire projection horizon of 4 pps. in the EU and of 3.6 pps. in the EA (see Graph 8, Graph 9 and Table 3). However, in both risk scenarios, the EU aggregates mask considerable variety and the expenditure projections are very different across Member States.
(12) As in previous long-term projection exercises, the baseline scenario focuses on the budgetary impact mostly due to demographic developments. -8 -4 0 4 8 12 16 EL HR FR LV EE IT LT ES PT DK CY PL SE RO BG FI HU SK NL AT IE DE UK BE CZ NO SI MT LU EA EU* EU 27
Total age-related expenditure
Baseline scenario AWG Risk scenario TFP risk scenario -8 -4 0 4 8 12 16 EL HR FR LV EE IT LT ES PT DK CY PL SE RO BG FI HU SK NL AT IE DE UK BE CZ NO SI MT LU EA EU * EU 27
Strictly age-related expenditure
Baseline scenario AWG Risk scenario TFP risk scenario
Graph 9: Total age-related expenditure, different scenarios and by component, 2016 and 2070, % of GDP
Source: Commission services, EPC.
A slightly higher projected increase in age-related spending projections now compared with the 2015 Ageing Report
Total age-related public expenditure according to the baseline scenario is now projected to rise more in all EU countries except EE, EL, FR, LT, MT, NL, SK and FI compared with the projections in the 2015 Ageing Report up to 2060 (13). Age-related expenditure was however slightly lower in 2016 than projected in the 2015 Ageing Report in the EU (-0.5 pps. of GDP). The higher projected increase is mainly due to higher increases in pension expenditure over the long-term (see Graph 10), and also to long-term care expenditure. This reflects a more pronounced population ageing effect in the EU up to 2060 according to the latest Eurostat population projection, but also the impact of reducing the retirement age in the future in some countries (e.g. CZ and PL), which has led to higher pension expenditure increases.
Graph 10: Projected change in age-related and pension expenditure compared, 2018 and 2015 AR, 2016-60, pps. of GDP
Source: Commission services, EPC.
(13) Pension reforms implemented and having been subject to a peer review by the EPC after the 2015 Ageing Report was published are included in the 2015 AR projections in Graph 10.
0 5 10 15 20 25 30 2016 2070 -Baseline scenario 2070 - TFP risk scenario 2070 - AWG risk scenario 2016 2070 -Baseline scenario 2070 - TFP risk scenario 2070 - AWG risk scenario
European Union Euro Area
Unemployment benefits Education Long-term care Health care Pensions
+4.0 +2.2 +1.1 +3.6 +1.7 (% of GDP) +1.7 BE BG CZ DK DE EE IE EL ES FR HR IT CY LV LT LU HU MT NL AT PL PT RO SI SK FI SE UK NO EA EU* EU27 -8 -6 -4 -2 0 2 4 6 8 10 12 -4 -2 0 2 4 6 8 10 12
Total age-related expenditure Higher Lower 2015 AR 2 018 A R BE BG CZ DK DE EE IE EL ES FR HR IT CY LV LT HU MT NL AT PL PT RO SI SK FI SE UK NO EA EU* EU27 -6 -4 -2 0 2 4 6 -6 -4 -2 0 2 4 6 8
Public pension expenditure
201
8 A
R Lower
2015 AR Higher
n : Econo m ic and Budget ary Pr oje c tions f o r t he EU M e mber St at es ( 2016-20 70)
Note: Unless otherwise stated, EA: euro area; EU*: All 28 Member States; EU27: All EU Member States except the UK; EU*s: non-weighted EU average.
Source: Commission services, EPC.
2016 level CH 16-40 CH 16-70 2016 level CH 16-40 CH 16-70 2016 level CH 16-40 CH 16-70 2016 level CH 16-40 CH 16-70 2016 level CH 16-40 CH 16-70 2016 level CH 16-40 CH 16-70 2016 level CH 16-40 CH 16-70
BE 12.1 2.4 2.9 5.9 0.3 0.4 2.3 0.9 1.7 5.8 -0.1 0.0 26.2 3.5 5.0 1.4 0.0 0.0 27.6 3.5 5.0 BE BG 9.6 0.2 1.4 5.0 0.5 0.3 0.4 0.1 0.1 3.1 0.2 0.6 18.0 1.1 2.4 0.4 -0.1 -0.1 18.5 1.0 2.3 BG CZ 8.2 1.0 2.8 5.4 0.8 1.1 1.3 0.8 1.6 3.2 0.4 0.8 18.1 3.0 6.2 0.1 0.0 0.0 18.2 3.0 6.2 CZ DK 10.0 -1.8 -1.9 6.9 0.6 1.0 2.5 1.2 2.2 7.4 -0.5 -0.7 26.8 -0.6 0.6 0.9 -0.2 -0.2 27.6 -0.8 0.3 DK DE 10.1 1.9 2.4 7.4 0.6 0.7 1.3 0.5 0.6 4.2 0.1 0.3 22.9 3.1 4.1 0.6 0.1 0.1 23.5 3.2 4.2 DE EE 8.1 -1.0 -1.8 5.3 0.1 0.3 0.9 0.2 0.5 4.8 -0.2 0.2 19.1 -0.9 -0.9 0.2 0.0 0.0 19.3 -0.8 -0.8 EE IE 5.0 1.7 1.6 4.1 0.8 1.0 1.3 0.8 1.9 3.6 -0.4 -0.2 14.1 2.9 4.3 1.1 -0.2 -0.2 15.2 2.7 4.1 IE EL 17.3 -4.4 -6.6 5.0 1.0 1.2 0.1 0.0 0.1 3.1 -0.9 -0.8 25.5 -4.3 -6.1 0.4 -0.2 -0.3 25.8 -4.6 -6.4 EL ES 12.2 1.8 -1.5 5.9 0.8 0.5 0.9 0.5 1.3 3.7 0.0 0.3 22.6 3.1 0.7 1.3 -0.7 -0.9 24.0 2.5 -0.2 ES FR 15.0 0.0 -3.3 7.9 0.5 0.5 1.7 0.5 0.6 4.8 -0.2 -0.4 29.4 0.9 -2.6 1.6 -0.3 -0.4 31.0 0.6 -3.0 FR HR 10.6 -2.2 -3.8 5.2 0.5 0.7 0.9 0.2 0.3 3.7 -0.6 -0.5 20.4 -2.1 -3.3 0.3 -0.1 -0.1 20.7 -2.2 -3.4 HR IT 15.6 3.1 -1.7 6.3 0.6 0.7 1.7 0.6 1.2 3.5 -0.5 -0.3 27.2 3.8 -0.1 0.9 -0.3 -0.3 28.0 3.5 -0.4 IT CY 10.2 1.3 2.3 2.8 0.2 0.4 0.3 0.1 0.3 5.8 -1.7 -1.6 19.1 -0.1 1.3 0.5 -0.3 -0.3 19.5 -0.4 1.0 CY LV 7.4 -1.1 -2.6 3.7 0.6 0.6 0.4 0.1 0.1 4.5 0.1 0.5 16.0 -0.2 -1.4 0.4 0.0 -0.1 16.4 -0.2 -1.4 LV LT 6.9 0.2 -1.7 4.1 0.6 0.4 1.0 0.7 1.0 3.9 -0.3 -0.1 15.8 1.1 -0.4 0.2 0.0 0.0 16.0 1.1 -0.4 LT LU 9.0 2.5 8.9 3.9 0.6 1.2 1.3 0.8 2.8 3.3 -0.1 0.1 17.5 3.7 13.0 0.5 -0.1 -0.1 18.1 3.6 12.9 LU HU 9.7 -0.3 1.5 4.9 0.7 0.8 0.7 0.2 0.4 3.6 -0.2 0.2 18.9 0.4 3.0 0.1 0.0 0.0 19.0 0.4 3.0 HU MT 8.0 -0.7 2.9 5.6 1.7 2.7 0.9 0.7 1.4 5.4 -0.7 -0.2 20.0 1.1 6.7 0.2 0.1 0.1 20.2 1.2 6.8 MT NL 7.3 1.2 0.6 6.2 0.6 0.8 3.5 1.8 2.5 5.2 -0.3 -0.5 22.3 3.4 3.4 1.3 -0.3 -0.3 23.6 3.0 3.0 NL AT 13.8 1.1 0.5 7.0 0.7 1.3 1.9 0.7 1.9 4.9 -0.2 0.0 27.6 2.3 3.8 0.9 -0.2 -0.2 28.5 2.1 3.6 AT PL 11.2 -0.3 -1.0 4.3 0.5 0.8 0.5 0.4 0.8 4.3 -0.2 0.4 20.3 0.3 1.0 0.1 0.0 0.0 20.4 0.3 1.0 PL PT 13.5 1.2 -2.2 5.9 1.6 2.4 0.5 0.4 0.9 4.5 -1.0 -0.6 24.5 2.2 0.4 0.9 -0.3 -0.3 25.4 2.0 0.1 PT RO 8.0 -0.3 0.7 4.3 0.8 0.9 0.3 0.2 0.3 2.5 0.0 0.3 15.0 0.7 2.2 0.1 0.0 0.0 15.1 0.7 2.2 RO SI 10.9 3.2 3.9 5.6 1.0 1.0 0.9 0.5 0.9 4.0 0.1 0.6 21.5 4.8 6.4 0.4 -0.1 -0.1 21.9 4.7 6.3 SI SK 8.6 -0.8 1.2 5.6 1.1 1.2 0.9 0.3 0.6 3.7 -0.2 0.0 18.8 0.4 3.0 0.2 0.0 0.0 18.9 0.4 3.0 SK FI 13.4 0.5 0.6 6.1 0.6 0.8 2.2 1.4 2.1 5.9 -0.1 -0.4 27.6 2.4 3.0 2.2 -0.4 -0.4 29.8 2.0 2.6 FI SE 8.2 -1.3 -1.2 6.9 0.4 0.7 3.2 0.9 1.7 5.8 0.2 0.4 24.1 0.2 1.7 0.3 -0.1 -0.1 24.4 0.1 1.6 SE UK 7.7 0.9 1.7 7.9 0.8 1.4 1.5 0.6 1.3 5.2 -0.1 -0.2 22.4 2.2 4.3 0.1 0.0 0.0 22.5 2.2 4.3 UK NO 10.7 1.2 2.1 7.7 0.8 1.2 3.7 1.6 3.4 7.6 -0.5 -0.3 29.7 3.1 6.5 0.6 -0.2 -0.2 30.2 2.9 6.3 NO EA 12.3 1.3 -0.4 6.8 0.6 0.7 1.6 0.7 1.1 4.3 -0.1 0.0 24.9 2.4 1.4 1.1 -0.2 -0.2 26.0 2.2 1.1 EA EU* 11.2 0.8 -0.2 6.8 0.6 0.9 1.6 0.6 1.2 4.5 -0.1 0.0 24.1 2.0 1.8 0.8 -0.2 -0.2 25.0 1.8 1.7 EU* EU27 11.9 0.9 -0.5 6.6 0.6 0.7 1.6 0.6 1.1 4.4 -0.1 0.0 24.5 2.0 1.4 0.9 -0.2 -0.2 25.4 1.8 1.1 EU27 EU* s 10.3 0.4 0.2 5.5 0.7 0.9 1.3 0.6 1.1 4.4 -0.3 -0.1 21.5 1.4 2.2 0.6 -0.1 -0.2 22.1 1.2 2.1 EU* s
Unemployment benefits Total age related items
Ageing Report 2018 - Baseline scenario
Execut
iv
e Sum
m
Source: Commission services, EPC.
DE 10.1 1.9 2.5 7.4 0.5 0.7 1.3 0.8 1.4 4.2 0.1 0.3 22.9 3.4 4.8 0.6 0.1 0.1 23.5 3.5 4.9 DE EE 8.1 -0.9 -1.5 5.3 0.1 0.2 0.9 0.2 0.5 4.8 -0.2 0.2 19.1 -0.8 -0.7 0.2 0.0 0.0 19.3 -0.7 -0.6 EE IE 5.0 1.6 1.6 4.1 0.8 1.0 1.3 0.8 2.0 3.6 -0.4 -0.2 14.1 2.8 4.3 1.1 -0.2 -0.2 15.2 2.5 4.1 IE EL 17.3 -3.6 -5.7 5.0 0.9 1.1 0.1 0.0 0.1 3.1 -0.9 -0.8 25.5 -3.5 -5.2 0.4 -0.2 -0.3 25.8 -3.7 -5.5 EL ES 12.2 2.2 -1.4 5.9 0.8 0.5 0.9 0.5 1.3 3.7 0.0 0.3 22.6 3.5 0.7 1.3 -0.7 -0.9 24.0 2.9 -0.2 ES FR 15.0 0.4 -2.4 7.9 0.5 0.4 1.7 0.6 0.7 4.8 -0.2 -0.4 29.4 1.3 -1.7 1.6 -0.3 -0.4 31.0 0.9 -2.1 FR HR 10.6 -2.2 -3.6 5.2 0.5 0.7 0.9 0.2 0.3 3.7 -0.6 -0.5 20.4 -2.1 -3.1 0.3 -0.1 -0.1 20.7 -2.2 -3.2 HR IT 15.6 3.4 -1.1 6.3 0.6 0.7 1.7 0.6 1.2 3.5 -0.5 -0.3 27.2 4.1 0.5 0.9 -0.3 -0.3 28.0 3.8 0.2 IT CY 10.2 1.4 2.5 2.8 0.2 0.4 0.3 0.1 0.3 5.8 -1.7 -1.6 19.1 0.0 1.5 0.5 -0.3 -0.3 19.5 -0.3 1.3 CY LV 7.4 -0.8 -2.4 3.7 0.6 0.5 0.4 0.1 0.1 4.5 0.1 0.5 16.0 0.0 -1.3 0.4 0.0 -0.1 16.4 0.0 -1.3 LV LT 6.9 0.2 -1.6 4.1 0.5 0.3 1.0 0.7 1.0 3.9 -0.3 -0.1 15.8 1.1 -0.4 0.2 0.0 0.0 16.0 1.1 -0.4 LT LU 9.0 2.9 9.5 3.9 0.5 1.1 1.3 0.7 2.8 3.3 -0.1 0.1 17.5 4.1 13.5 0.5 -0.1 -0.1 18.1 4.0 13.4 LU HU 9.7 0.5 2.1 4.9 0.6 0.8 0.7 0.2 0.4 3.6 -0.2 0.2 18.9 1.2 3.5 0.1 0.0 0.0 19.0 1.2 3.5 HU MT 8.0 -0.5 3.4 5.6 1.7 2.6 0.9 0.7 1.4 5.4 -0.7 -0.2 20.0 1.3 7.2 0.2 0.1 0.1 20.2 1.4 7.2 MT NL 7.3 1.2 0.6 6.2 0.6 0.8 3.5 1.8 2.5 5.2 -0.3 -0.5 22.3 3.4 3.4 1.3 -0.3 -0.3 23.6 3.0 3.0 NL AT 13.8 1.8 0.8 7.0 0.7 1.3 1.9 0.7 1.9 4.9 -0.2 0.0 27.6 3.1 4.0 0.9 -0.2 -0.2 28.5 2.9 3.8 AT PL 11.2 0.5 -0.5 4.3 0.4 0.8 0.5 0.4 0.8 4.3 -0.2 0.4 20.3 1.1 1.4 0.1 0.0 0.0 20.4 1.1 1.4 PL PT 13.5 1.7 -1.2 5.9 1.6 2.3 0.5 0.4 0.9 4.5 -1.0 -0.6 24.5 2.7 1.4 0.9 -0.3 -0.3 25.4 2.5 1.1 PT RO 8.0 0.1 1.2 4.3 0.8 0.9 0.3 0.2 0.3 2.5 0.0 0.3 15.0 1.1 2.6 0.1 0.0 0.0 15.1 1.1 2.6 RO SI 10.9 3.6 4.2 5.6 1.0 1.0 0.9 0.5 0.9 4.0 0.1 0.6 21.5 5.2 6.7 0.4 -0.1 -0.1 21.9 5.1 6.6 SI SK 8.6 -0.2 1.7 5.6 1.0 1.1 0.9 0.3 0.6 3.7 -0.2 0.0 18.8 0.9 3.4 0.2 0.0 0.0 18.9 0.9 3.4 SK FI 13.4 1.2 1.2 6.1 0.5 0.7 2.2 1.4 2.1 5.9 -0.1 -0.4 27.6 3.0 3.5 2.2 -0.4 -0.4 29.8 2.6 3.1 FI SE 8.2 -1.3 -1.2 6.9 0.4 0.7 3.2 0.9 1.7 5.8 0.2 0.4 24.1 0.2 1.7 0.3 -0.1 -0.1 24.4 0.1 1.6 SE UK 7.7 1.1 2.2 7.9 0.8 1.4 1.5 0.6 1.2 5.2 -0.1 -0.2 22.4 2.4 4.6 0.1 0.0 0.0 22.5 2.4 4.6 UK NO 10.7 1.2 2.1 7.7 0.7 1.2 3.7 1.6 3.4 7.6 -0.5 -0.3 29.7 3.0 6.4 0.6 -0.2 -0.2 30.2 2.8 6.2 NO EA 12.3 1.5 0.0 6.8 0.6 0.6 1.6 0.7 1.3 4.3 -0.1 0.0 24.9 2.7 1.9 1.1 -0.2 -0.2 26.0 2.5 1.7 EA EU* 11.2 1.1 0.2 6.8 0.6 0.8 1.6 0.7 1.3 4.5 -0.1 0.0 24.1 2.3 2.3 0.8 -0.2 -0.2 25.0 2.1 2.1 EU* EU27 11.9 1.1 -0.1 6.6 0.6 0.7 1.6 0.7 1.3 4.4 -0.1 0.0 24.5 2.3 1.9 0.9 -0.2 -0.2 25.4 2.1 1.7 EU27 EU* s 10.3 0.7 0.6 5.5 0.7 0.9 1.3 0.6 1.1 4.4 -0.3 -0.1 21.5 1.7 2.6 0.6 -0.1 -0.2 22.1 1.5 2.4 EU*