QUANTIFICATION OF SODIUM PRESENT IN DRY AGGREGATES AND ANODES
Julie Bureau1, Duygu Kocaefe1, Dipankar Bhattacharyay1, Yasar Kocaefe1, Brigitte Morrais21 UQAC/AAI Research Chair on Carbon and REGAL Aluminum Research Center
University of Quebec at Chicoutimi 555 Boulevard de l'Université, Chicoutimi, QC, Canada G7H 2B1 2Aluminerie Alouette Inc., 400, Chemin de la Pointe-Noire, Sept-Îles, Québec, Canada G4R 5M9
Keywords: Carbon anodes, anode quality, sodium content, electrophoresis, specific sodium-ion electrode
Abstract
In aluminum industry, it is important to determine the concentration of contaminants present in anode raw materials as rapidly as possible in order to adjust the anode recipe. Sodium, which is an impurity coming largely from anode butts, significantly influences the anode reactivity, and an increase in its concentration increases the anode consumption. A simple and inexpensive method was developed to quantify the sodium content in dry aggregates and anodes without grinding the samples. The method is based on potentiometric principles using a sodium-ion specific electrode. A sample can be analyzed easily within thirty minutes. In order to prevent the rapid degradation of the specific electrode due to experimental conditions, sodium is extracted from samples by electrophoresis prior to the test. The comparison shows that the measured sodium concentrations obtained are similar to the results determined by other test methods.
Introduction
Primary aluminum is produced by the electrolysis of alumina (Al2O3) dissolved in cryolite (Na3AlF6) using the Hall-Héroult process. The reduction reaction takes place at the cathode to form the molten aluminum. During this process, oxygen is removed in the form of carbon dioxide (CO2) on the anode side. The carbon required for the production of CO2 is supplied by the carbon anodes used in the electrolytic process. Thus, the anode is consumed and has to be replaced at regular intervals [1-3]. A green anode is made from anode paste which consists of about 85% dry aggregate (fresh petroleum coke, butts, green and baked rejects) and 15% binder (coal tar pitch). The rejected green and baked anodes and butts are crushed and added to the dry aggregate, and they constitute around 20 % of the anode paste [2-4].
The theoretical value for the consumption of carbon for the electrolytic production of aluminum is 0.334 kg C/kg Al [3], but due to various losses (reaction with air and CO2) and current efficiency, the actual consumption is over 0.4 kg C/kg Al [3]. The rates of reaction of air and CO2 with the anode are influenced by the presence of different impurities in the anode. Sodium is one of the impurities, which catalyzes the anode reactivity [1]. The major source of sodium is butts. The anodes are submerged into the electrolytic bath, which contains cryolite (Na3AlF6). During the electrolysis, they absorb sodium. When the anode is consumed up to a certain height, they (called butts) are taken out of the electrolytic bath, cleaned and crushed and used in anode production. Even though they are cleaned externally, a significant amount of sodium still stays in the butt particles. The presence of butt particles in the anode recipe influences the percentage of sodium in anodes and, in turn, the reactivity of the anode [2-4].
The quality of anodes has a direct impact on the cost of metal, energy consumption, and environmental emissions. One of the key goals for industry is to improve/maintain anode quality in spite of the variations in the quality of the raw materials. Availability of tools for monitoring the impurity levels will contribute significantly to achieve this goal [2-4].
There are different standard methods to quantify sodium. The American Society for Testing and Materials (ASTM) developed different test methods using Inductively Coupled Plasma Atomic Emission Spectrometry (ICP-AES), Atomic Absorption Spectrometry (AAS), Flame Emission Spectroscopy (FES), and X-ray Fluorescence Spectroscopy (XRF) [5]. Batista and Da Silveira [1] characterized samples of coke, pitch, and butt powder by XRF and AAS. Many researchers employed ICP-AES and AAS for the determination of various elements in lubricants [6] and in soil [7]. The XRF method has been utilized in a number of cases [8-10] for the estimation of sodium. Carter et al. [11] presented a review on the application of AAS in the industrial analysis of metals, chemicals, and advanced materials. An update of this review was published by Gibson et al [12].
A number of researchers have used zinc uranyl acetate for the estimation of sodium in the presence of interfering ions such as phosphate [13-15]. The concentrations of sodium in different samples were measured by Emission Flame Photometry [16-19]. In aluminum industry, the estimation of sodium is usually done by different methods such as XRF and AAS, which require intensive sample preparation, highly skilled personnel, and costly reagents. The methods are usually time-consuming. Thus, there is a need for simple methods for fast and efficient estimation of sodium. In this context, researchers have developed potentiometric methods for the estimation of sodium using sodium-ion specific electrode (SISE) [20-23]. SISE is usually suitable for a system which does not contain any particulate materials. In the presence of particulate materials, its life reduces to a great extent.
The aim of this work is to develop a simple, quick, and inexpensive method to estimate reliably the quantity of sodium present in anode raw materials using SISE in the presence of particulate materials.
Materials and methods
Materials
Industrial anode raw materials (cokes and butts) were used to test the method. The samples contained different concentrations of sodium. Ionic strength adjuster (ISA) and standard solutions of sodium were acquired from Thermo Fisher Scientific Inc.
Methodology
Potentiometry is an electrochemical method used for estimating the concentrations of chemical species present in a solution. In this method, a working electrode (WE) and a reference electrode (RE) are dipped into the solution and the potential difference between the two electrodes are measured at a constant current. Usually, for most of the potentiometric methods of analysis, the value of current is set to zero by using high impedance associated with the reference electrode. Zero current helps minimize the variation in the half-cell potential of the reference electrode during the analysis. The potential difference (∆𝐸𝐸) between WE and RE varies with change in the concentration of ions in the solution. [24-26].
SISE measures sodium in a solution potentiometrically. The concentration of sodium ion (CNa+) in a solution can be correlated with ∆𝐸𝐸 using the equation (1) [24-26].
∆𝐸𝐸 = ∆𝐿𝐿 − 𝛽𝛽𝑅𝑅𝑅𝑅𝐹𝐹 𝑙𝑙𝑙𝑙𝐶𝐶𝑁𝑁𝑁𝑁+ (1) where
∆L represented the constants of the system β is the membrane efficiency
R is the ideal gas constant = 8.314 J·K-1·mol-1 T is the temperature in Kelvin (K)
F is Faraday’s constant = 96485 Coulombs (C)
In this work, a SISE (ROSS Sodium Ion Selective Electrode Thermo Scientific, 8611BNWP) was employed. This probe contains both WE and RE.
The SISE is a probe made of porous glass membranes containing specific chemical compounds that facilitate selective migration of sodium in the electrode (see Figure 1). The membrane usually does not allow the passage of ions larger than the sodium ion. The ions smaller than sodium can interfere with the response of the electrode; however, these interferences are usually low compared to the response of sodium. The probe glass is fragile in certain mediums and deforms with time. The glass membrane of SISE degrades faster in the presence of particulate impurities, which can block the pores with time. Their presence can reduce the response of the SISE [24-26].
Figure 1. Composition of a specific electrode membrane [26, 27]. Analysis of sodium in fresh coke or butts using SISE is challenging due to two major reasons. First, the sodium ions do not leave the surface of the samples easily in aqueous medium. Second, the particulate sample can degrade the SISE within a
short time. To solve these two issues, electrophoresis technique was employed (a) to extract the sodium ions from the samples and (b) to measure the extracted sodium using SISE in the absence of particles.
Researchers have used electrophoresis technique to separate different ions based on their ionic mobilities through a medium by the application of direct current. Rengan et al. [28] developed an electrophoresis method to separate different ions. Electrophoresis was used by Janos [29] to separate the lanthanide and the actinide series elements.
Usually, agar gel is utilised as the medium in electrophoresis. A small well is created inside the agar gel and filled with the sample. The gel along with the sample is placed in a conducting solution and direct current is passed through the system using two electrodes (anode and cathode) by applying a potential difference. The passage of current causes the positive ions to move towards the cathode. Due to the resistance offered by the agar gel and the size of the ions, different positive ions move towards the cathode at different speeds for a particular time. The ionic force of the conducting solution and the amount of applied current have to be sufficient in order to have a good separation [24-26].
Thus, in this work, the quantity of sodium in fresh coke and butt particles were estimated in two steps. In the first step, electrophoresis was used to transfer the sodium in the samples to the conducting solution outside the agar gel. This ensured that the coke or butt particles stayed inside the agar gel, whereas the sodium ions moved to a solution containing no particles. Then, in the second step, SISE was used to estimate the sodium transferred to the solution.
The efficiency of sodium separation depends on the applied potential, ionic strength and nature of the conducting solution, and the time of passage of current.
ISA was chosen as the conducting solution, as recommended by the supplier of the SISE, to eliminate interferences in the measurement.
For a specific value of current passing through a solution of known ionic strength, the time of passage of current should be such that most of the sodium ions are extracted from the sample. Based on Faraday’s law of electrolysis, it can be stated that 1 Faraday (or 96485 Coulombs (C)) of electricity enables the transfer of 1 g equivalent of sodium (23 g). For a current of “I” A passed for a period of “t” s, the electric charge “Q” can be expressed as shown by Equation (2):
Q = It (2) If the amount of sodium in a given sample is “m”, then the charge of “QNa” C required to transfer the sodium is given by Equation
(3):
𝑄𝑄𝑁𝑁𝑁𝑁= 𝑚𝑚 ×9648523 (3)
Thus, the time “tNa” s required to pass the current can be expressed by Equation (4):
𝑡𝑡𝑁𝑁𝑁𝑁= 𝑄𝑄𝑁𝑁𝑁𝑁
Experimental
Preliminary work to identify the role of electrophoresis in the movement of ions
In two identical electrophoresis set-ups, NiCl2 solutions of same concentration and volume were placed into the wells inside the agar gel. Then, the systems were filled with ISA. Dimethylglyoxime (DMG) solution was placed outside the agar gel. DMG produces pink color with Ni salts. Since sodium cannot produce any colored salt, Ni was used to study the effect of electrophoresis on the ionic movement. In one of the set-ups, a potential difference was applied between the two electrodes whereas no potential was applied in the other one. After some time, a pink color was observed in the set-up where the current was present. No pink color was detected in the second set-up. The concentration of Ni in the well is higher than that on the outside of the gel. It is possible that mass diffusion can take place due to the concentration gradient. If mass diffusion plays an important role in the transfer of Ni+2, then pink color should be observed in both set-ups. The absence of pink color when there is no current clearly indicates that the passage of current forced the Ni+2 ions to move towards the exterior of the gel. Thus, there was no ion movement due to the concentration difference.
Electrophoresis set-up for the extraction of sodium
The extraction of sodium from the raw materials was carried out with electrophoresis. Figure 2 shows a schematic representation of the electrophoresis set-up. It comprises of two copper electrodes and an agar gel block in a glass container.
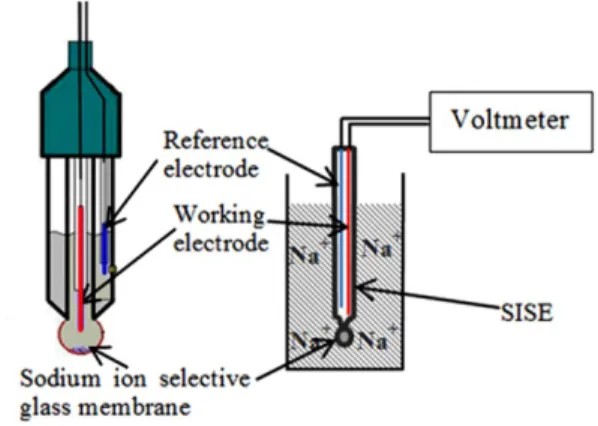
A measured quantity of sample in 1 ml of ISA/distilled water (10% v/v) was placed in the well of the agar gel. A 25 ml conducting solution containing 0.1 % v/v ISA/distilled water was then put in the glass container, and a potential difference of 17.5 V was applied between the two electrodes for a certain period of time. After the experiment, the flow of current was turned off and the solution outside the agar gel was transferred to another beaker. Measurement of sodium concentration in solution using SISE The SISE was dipped in the solution containing the sodium ions (see Figure 3). The potential difference between the WE and RE of the SISE was recorded with respect to time.
Results and discussions
During the electrophoresis step, at the voltage of 17.5 V, it was observed that the current flowing through the system was in the order of 0.02 A. Part of the butt sample used for sodium analysis was analyzed by XRF, and it was found to contain around 1600 ppm of sodium. Since butt particles contain much higher quantity of sodium compared to that of fresh coke, the sodium percentage present in butt sample was used to calculate the minimum time required to transfer the sodium ions by electrophoresis.
Due to the small size of the well in the agar gel, it was possible to add 0.1 g of sample into the well. 0.1 g of a 1600 ppm sodium sample contains
Figure 2. Schematic representation of the electrophoresis method.
Figure 3. Schematic representation of the potentiometric method. (0.1 g sample)(1600 g Na/ 106 g sample) (1/23 g /g.mol) = 6.956 x 10⁻⁶ g.mol of Na. As Na has a valency of 1, the amount of sodium in mole equivalent will be 6.956 x 10⁻⁶ g.mol equivalent. Thus, the electrical charge required to transfer the sodium ions will be (6.956 x 10⁻⁶ g.mol)(96485 C/g.mol) = 0.67 C. Thus, for a current of 0.02 A, time required for the transfer of sodium will be (0.67 C)/ (0.02 A) = 33.56 s. = 0.56 min. This calculation shows that the transfer of sodium could be completed in less than 1 minute. However, in a real system, there are other ions as well as loss of electricity (in the form of heat dissipation) due to the resistance of the agar gel. Hence, the time required for the passage of current was determined experimentally. The required time should be more than the theoretically required time which was calculated above.
An experiment was performed to determine the time required to transfer the sodium ions from a given sample. A measured quantity of solution with a known ppm of sodium was added in the well of the agar gel. The voltage of the solution outside the gel was measured periodically using SISE. Figure 4 shows the response of the SISE at different time intervals. The voltage increased significantly with increasing time up to 6 min and a maximum value was obtained at around 8 min. The voltage is proportional to the sodium concentration, and the atteinment of a maximum shows that all the sodium is transferred at this time. Thus, the time used for electrophoresis for further experiments was chosen as 8 min.
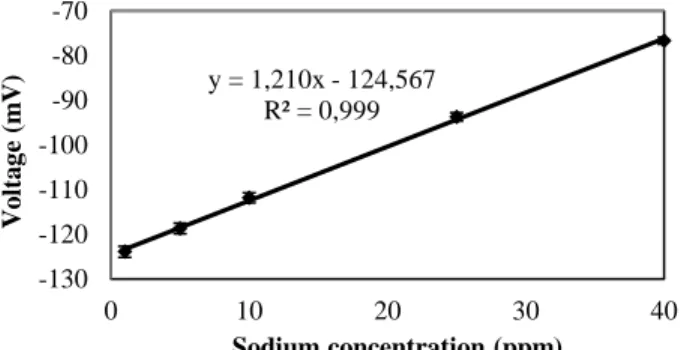
A calibration curve (see Figure 5) was prepared for the estimation of sodium in samples containing unknown concentrations of sodium. Solutions of different known concentrations (1, 5, 10, 25, and 40 ppm) of sodium were prepared using the purchased
standard solutions and ISA. 1 ml of the solutions of different concentrations was added to the well of agar gel. After adding measured quantity of the ISA solution, the electrophoresis was performed for 8 min. Then, the solution outside the gel was analyzed using SISE. The voltage response was plotted against the concentration of the sodium solution used for calibration.
Figure 4. Variation of the response of SISE with time. The calibration curve shows that the voltage increased linearly with increasing sodium concentration in the range of 1 to 40 ppm. As stated earlier, a butt sample was found to contain around 1600 ppm of sodium. The calibration curve was prepared so that it would be possible to measure the sodium concentrations of butt samples up to 4000 ppm which is much higher than that measured for butt sample used in this study.
A butt sample of 0.1 g was placed in a 1 ml solution inside the well of the agar gel. If 0.1 g of sample containing 4000 ppm of Na is analyzed, then this sample contains 40x10-6 g of Na. In the 1 ml solution, this amount of sodium is equivalent to 40x10-6 g of Na × 106 ppm.g-1 or 40 ppm of Na. Therefore, a calibration curve up to 40 ppm is capable of measuring butt samples up to 4000 ppm.
Figure 5. Calibration curve obtained from sodium standards. For a sample of unknown sodium concentration, the ppm of sodium was calculated using the calibration curve based on the measured voltage response. If the calculated ppm is x, then the concentration of sodium in the carbon sample is 100x ppm. The calibration curve was later used to estimate the concentrations of sodium in two coke samples and one butt sample. The results of these measurements are presented in Table 1. The samples analyzed had a particle size of less than 1 mm. The results show that the measured values are similar to the known values. The known sodium concentrations for the two coke samples are from the supplier data for the whole shipment. It is possible that due to
non-homogeneity of the raw materials, the measured values did not match exactly with the known concentrations for these samples. The sodium concentration of butt was found to match well with the XRF measurement of the same sample. The developed method can give a good estimation of sodium concentration. The time requirement for the estimation of sodium using this method is around 30 min.
Table 1. Comparison of known and measured values of sodium concentration in different samples.
Samples
Sodium concentration analysis (ppm)
Known Measured
Coke A 106 (supplier data) 68
Coke B 60 (supplier data) 47
Butt A 1576 (measured by XRF) 1593
Further study will be carried out to improve the manipulation and fabrication of the delicate agar gel. Later, tests will be done using samples of dry aggregates and anodes.
Conclusions
A simple and effective method was developed to determine sodium concentration in coke and butt samples using SISE. Extraction of sodium by electrophoresis prior to the potentiometric measurement using SISE helped prevent the degradation of the electrode. The comparison shows that the measured sodium concentrations are similar to the concentrations determined by other test methods.
Acknowledgements
The technical and financial supports of Aluminerie Alouette Inc. (AAI) as well as the financial support of the Natural Sciences and Engineering Research Council of Canada (NSERC), Développement économique Sept-Îles, the University of Québec at Chicoutimi (UQAC) and the Foundation of the University of Québec at Chicoutimi (FUQAC) are greatly appreciated. A part of the research presented in this paper was financed by the Fonds de recherche du Québec Nature et technologies by the intermediary of the Aluminium Research Centre – REGAL.
References
1. J.D.S. Batista, and B.I. Da Silveira, “Influence of the sodium content on the reactivity of carbon anodes,” Materials Research-Ibero-American Journal Of Materials. 11(3) (2008), p. 387-390.
2. K.L. Hulse, Anode manufacture : Raw materials, formulation and processing parameters (Sierre, Suisse: R & D Carbon Ltd., 2000), xxxv, 416 p.
3. A. Charette, Y.S. Kocaefe, and D. Kocaefe, Le carbone dans l'industrie de l'aluminium (Québec, Chicoutimi: Les presses de l'aluminium, 2012), xxi, 325 p.
4. A.D. Kamran. “Investigation of the materials and paste relationships to improve forming process and anode quality,” (Ph.D. thesis, Université Laval, 2013), 148. 5. American Society for Testing Materials, Annual book of
astm standards (Philadelphia, PA: ASTM, American Society for Testing and Materials, Vol. 5. 1970).
y = 1,210x - 124,567 R² = 0,999 -130 -120 -110 -100 -90 -80 -70 0 10 20 30 40 Vo lt a g e ( m V) Sodium concentration (ppm) -120 -100 -80 -60 2 4 6 8 10 12 Vo lt a g e ( m V) Time (min)
6. P.N. Bangroo, C.R. Jagga, H.C. Arora, and G.N. Rao, “Spectrometric determination of wear metals and additive elements in lubricating oils by aas and icp-aes,” Atomic spectroscopy. 16(3) (1995), p. 118-120.
7. X. Li, B.J. Coles, M.H. Ramsey, and I. Thornton, “Sequential extraction of soils for multielement analysis by icp-aes,” Chemical Geology. 124(1–2) (1995), p. 109-123. 8. Z. Yang, X. Hou, and B.T. Jones, “Determination of wear
metals in engine oil by mild acid digestion and energy dispersive x-ray fluorescence spectrometry using solid phase extraction disks,” Talanta. 59(4) (2003), p. 673-680. 9. A.N. Smagunova, E.N. Korzhova, and T.M. Velikova,
“Elemental analysis of organic materials by x-ray spectrometry,” Journal of Analytical Chemistry. 53(7) (1998), p. 594-605.
10. M. Pouzar, T. Černohorský, and A. Krejčová, “Determination of metals in lubricating oils by x-ray fluorescence spectrometry,” Talanta. 54(5) (2001), p. 829-835.
11. S. Carter, A.S. Fisher, P.S. Goodall, M.W. Hinds, S. Lancaster, and S. Shore, “Atomic spectrometry update. Industrial analysis: Metals, chemicals and advanced materials,” Journal of Analytical Atomic Spectrometry. 25(12) (2010), p. 1808-1858.
12. B. Gibson, S. Carter, A.S. Fisher, S. Lancaster, J. Marshall, and I. Whiteside, “Atomic spectrometry update. Review of advances in the analysis of metals, chemicals and functional materials,” Journal of Analytical Atomic Spectrometry. 29(11) (2014), p. 1969-2021.
13. A.E. Sobel, G. Kraus, and B. Kramer, “The determination of sodium in the presence of phosphates,” Journal of Biological Chemistry. 140(2) (1941), p. 501-508.
14. A.M. Butler, and E. Tuthill, “An application of the uranyl zinc acetate method for determination of sodium in biological material,” Journal of Biological Chemistry. 93(1) (1931), p. 171-180.
15. H.H. Barber, and I.M. Kolthoff, “Gravimetric determination of sodium by the uranyl zinc acetate method. Ii. Application in the presence of rubidium, cesium, potassium, lithium, phosphate or arsenate,” Journal of the American Chemical Society. 51(11) (1929), p. 3233-3237.
16. T. Tanaka, T. Okamura, K. Miura, T. Kadowaki, H. Ueshima, H. Nakagawa, and T. Hashimoto, “A simple method to estimate populational 24-h urinary sodium and potassium excretion using a casual urine specimen,” J Hum Hypertens. 16(2) (2002), p. 97-103.
17. T. Kawasaki, K. Itoh, K. Uezono, and H. Sasaki, “A simple method for estimating 24 h urinary sodium and potassium excretion from second morning voiding urine specimen in adults,” Clin Exp Pharmacol Physiol. 20(1) (1993), p. 7-14. 18. Intersalt Cooperative Research Group, “Intersalt: An
international study of electrolyte excretion and blood pressure. Results for 24 hour urinary sodium and potassium excretion. Intersalt cooperative research group,” BMJ : British Medical Journal. 297(6644) (1988), p. 319-328. 19. A.M. Bold, R.J. Hurst, and R.R. McSwiney, “Automated
estimation of sodium, potassium, and calcium using the eppendorf flame photometer,” Journal of Clinical Pathology. 18(2) (1965), p. 240-243.
20. D.D. Koch, D. Parrish, and J.H. Ladenson, “Evaluation of a direct potentiometric method for sodium and potassium used in the du pont aca,” Clinical Chemistry. 29(6) (1983), p. 1090-1092.
21. J. Bobacka, A. Ivaska, and A. Lewenstam, “Potentiometric ion sensors,” Chemical Reviews. 108(2) (2008), p. 329-351. 22. G. Lisak, T. Arnebrant, T. Ruzgas, and J. Bobacka,
“Textile-based sampling for potentiometric determination of ions,” Analytica Chimica Acta. 877 (2015), p. 71-79. 23. A. Boeyckens, J. Schots, H. Vandenplas, F. Senesael, W.
Goedhuys, and F.K. Gorus, “Ektachem slides for direct potentiometric determination of sodium in plasma: Effect of natremia, blood ph, and type of electrolyte reference fluid on concordance with flame photometry and other potentiometric methods,” Clinical Chemistry. 38(1) (1992), p. 114-118.
24. D.A. Skoog, F.J. Holler, and T.A. Nieman, Principles of instrumental analysis (Texas, FW, Québec, MTL: Saunders College, 1998), xv, 849, 69 p.
25. D.C. Harris, Exploring chemical analysis (New York: W.H. Freeman, 2005), xiii, 610 p., [8] p. more.
26. D.A. Skoog, D.M. West, and F.J. Holler, Chimie analytique (Belgique, BRU: De Boeck, 1997), xviii, 870, [102] p., 24 p. more in color.
27. Thermo orion ross sure-flow sodium electrode. 2015 [Access to the 14 august 2015; Available from: http://www.fondriest.com/thermo-orion-ross-combination-sodium-electrode.htm.
28. K. Rengan, R.A. Meyer, and Nuclear Chemistry Division Lawrence Livermore National Laboratory., Ultrafast chemical separations (Washington, DC: The National Academies Press, 1993), 282.
29. P. Janoš, “Analytical separations of lanthanides and actinides by capillary electrophoresis,” Electrophoresis. 24(12-13) (2003), p. 1982-1992.
![Figure 1. Composition of a specific electrode membrane [26, 27].](https://thumb-eu.123doks.com/thumbv2/123doknet/7603734.233352/2.918.109.414.787.957/figure-composition-of-a-specific-electrode-membrane.webp)