HAL Id: tel-00684391
https://tel.archives-ouvertes.fr/tel-00684391
Submitted on 2 Apr 2012
HAL is a multi-disciplinary open access archive for the deposit and dissemination of sci-entific research documents, whether they are pub-lished or not. The documents may come from teaching and research institutions in France or abroad, or from public or private research centers.
L’archive ouverte pluridisciplinaire HAL, est destinée au dépôt et à la diffusion de documents scientifiques de niveau recherche, publiés ou non, émanant des établissements d’enseignement et de recherche français ou étrangers, des laboratoires publics ou privés.
To cite this version:
Ikhlak Ahmed. A bioinformatics analysis of the arabidopsis thaliana epigenome. Agricultural sciences. Université Paris Sud - Paris XI, 2011. English. �NNT : 2011PA112230�. �tel-00684391�
Ikhlak Ahmed
A Bioinformatics analysis of the
Arabidopsis thaliana Epigenome
Laboratoire: CNRS UMR8197 - INSERM U1024 Institut de Biologie de l'ENS(IBENS)
Prof. Dao-Xiu Zhou
President
Prof. Christian Fankhauser
Rapporteur
Dr. Raphaël Margueron Rapporteur
Dr. Chris Bowler
Examiner
Dr. Vincent Colot
Examiner
Dr. Allison Mallory
Examiner
Dr. Michaël Weber
Examiner
Jury
Supervisors: Dr. Chris Bowler and
Dr. Vincent Colot
Bowler who trusted in me and gave me the opportunity to come here and work in the excellent possible conditions. I have no words to express my thankfulness to Vincent Colot for his enthusiastic supervision and the incredibly valuable sessions we spent together that shaped my understanding of DNA methylation.
I am very thankful to my friends Uma Maheswari, Alexis Sarazin, Clara Bourbousse, Stéphanie Drevense who were always there to solve my day-to-day problems. I would also like to thank all the members of the Bowler & Colot groups for their advices, scientific discussions and the moral support they gave me. I also want to thank Sophie de Peindray for her great help.
During this work I have collaborated with many colleagues for whom I have great regard, and I wish to extend my warmest thanks to Frédy Barneche, François Roudier and Hadi Quesneville who have helped me with the work.
I wish to thank my entire extended family for their love and belief in me especially to my sister, Seema Gull, for her constant efforts to keep us all happy and to take care of the family in my absence.
Lastly, and most importantly, I am forever indebted to my parents, AG and papa, for always being there, to care, protect and raise me, their rightful teachings and unconditional love. To them I dedicate this thesis.
Introduction ... 5
Histone post-translational modifications ... 9
DNA Methylation ... 12
Genomic Context of DNA Methylation ... 13
Establishment and maintenance of DNA methylation ... 16
Regulation of DNA methylation ... 21
Methods to identify DNA methylation ... 23
The bioinformatics of epigenome data analysis ... 27
R and Bioconductor support ... 31
Analysis of microarray ChIP-on-chip data ... 34
Peak Finding ... 37
Aims and organisation of the thesis ... 40
References: ... 41
CHAPTER II ... 51
GENOME-WIDE EVIDENCE FOR LOCAL DNA METHYLATION SPREADING FROM
SMALL RNA TARGETED SEQUENCES IN ARABIDOPSIS ... 51
Introduction ... 52
Materials and Methods ... 55
DNA methylation analysis ... 56
Results ... 57
INTEGRATIVE EPIGENOMIC MAPPING DEFINES FOUR MAIN CHROMATIN
STATES IN ARABIDOPSIS ... 97
Introduction ... 98
Results ... 101
Discussion ... 105
Materials and methods ... 108
References ... 109
Supplementary ... 111
Review process file ... 121
Additional Methods ... 128
Combinatorial Analysis ... 128
Co-association ... 135
Cluster Analysis ... 136
Cluster Validity and clustering tendency ... 140
CHAPTER IV ... 145
SPATIAL & TEMPORAL DYNAMICS IN HISTONE H2BUB CHROMATIN MARK
DURING LIGHT DRIVEN DEVELOPMENTAL ADAPTATION & THE ROLE THEREIN
FOR FINE-TUNING OF GENE EXPRESSION ... 145
Introduction ... 146
Methods ... 154
ChIP-chip analysis ... 154
Transcriptome analysis ... 155
Discussion ... 185
References: ... 190
CHAPTER V ... 194
DISCUSSION ... 194
CHAPTER I
INTRODUCTION TO CHROMATIN AND
Introduction
Deoxyribonucleic acid (DNA) is the genetic material that contains the instructions needed for normal development and functioning of almost all known living organisms. However the linear length of naked DNA far exceeds the microscopic dimensions of a cell nucleus. Eukaryotic genomes are therefore compacted into a condensed form called chromatin that is essential to fit the DNA within the confines of a nucleus. Chromatin is composed of DNA plus the proteins (and RNA) that package DNA. The composition and properties of chromatin can vary immensely, e.g. between different types of cells of an organism, during different phases of the cell cycle, or in response to stimuli perceived from the environment.
Besides efficient packing of the genetic material, other major roles of chromatin are to strengthen the DNA and prevent DNA damage, control DNA replication and to provide regulated access of DNA to the transcriptional machinery. Thus while all cells of an organism carry the same DNA sequence, it is the chromatin-mediated selective read out of the genome that distinguishes one cell type from another. Chromatin-mediated control of genome activity can be either transient or else stably transmitted across multiple cell divisions and in some cases even across generations. The study of the transmission of chromatin states without changes of the underlying DNA sequence is a rather new discipline called epigenetics. Chromatin-based epigenetic processes are crucial for development of an adult organism from a fertilised egg and may also be involved in the inheritance of traits. Chromatin has long been recognized to exist in distinct states, starting with the classical cytological definition of euchromatin and heterochromatin. Typically, euchromatin contains transcriptionally active genes whereas heterochromatin is transcriptionally silent, tightly packed and mainly composed
of repeat sequences including transposable elements. However, heterochromatin is sometimes divided into constitutive or facultative forms (Fransz, Soppe et al. 2003). As its name implies, constitutive heterochromatin is observed in most if not all the cells of an organism. This form of heterochromatin mainly occurs around the centromere and near telomeres and its abnormal juxtaposition with genes can result in their transcriptional silencing, in a process called position effect variegation (Reuter and Spierer 1992). Facultative heterochromatin on the other hand does not show any significant enrichment in repetitive sequences and is formed only under specific circumstances or in specific cell-types (Oberdoerffer and Sinclair 2007). A classical example of facultative heterochromatin is the inactive X-chromosome in female mammals.
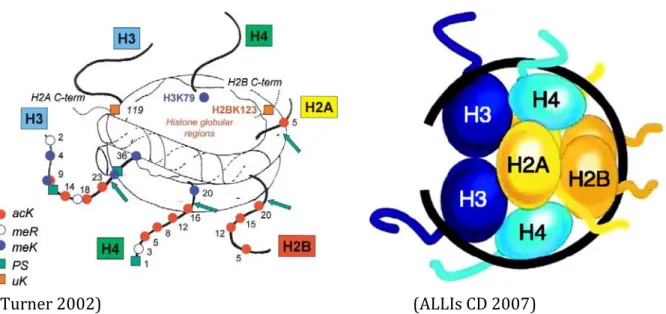
The fundamental unit of chromatin is the nucleosome (Kornberg and Thomas 1974) (Figure 1.1.1). It consists of a protein octamer, which contains two molecules of each of the core histone proteins (H2A, H2B, H3, H4;(Kornberg and Thomas 1974)), around which 147 bp of DNA is wrapped. In addition a linker histone H1 sits on top of this structure keeping in place the DNA that is wrapped around the nucleosome. Histones are highly basic proteins folded into a C-terminal globular domain and a flexible relatively unstructured N- tail that protrudes from DNA surface in the nucleosome core particle. These N- tails can be subjected to a diverse set of post-translational modifications that modulate their interaction with other chromatin components and hence change the structural and functional properties of chromatin. Histone modifications are generally represented by following a nomenclature system as below:
ii. The single-letter amino acid abbreviation (e.g., K for Lysine) followed by the amino acid position in the protein
iii. The type of modification (me: methyl, P: phosphate, ac: acetylation, ub: ubiquitin) followed by a numeral that gives the number of groups present.
Using the above nomenclature the di-methylation of histone H3, Lysine 9 would be represented by H3K9me2.
The post-translational modifications of histones most studied are those that lead to gene 'activation' or 'repression', depending on whether the presence of modification correlates with gene activity or silencing. For example, H3K4me3 is associated with gene activation, H3K27me3 is associated with stable repression of genes, while H3K9me2 with long term silencing of mobile repeat elements.
Variation in chromatin structure is also brought about by the incorporation of histone variants. For example, histone H3, is incorporated into chromatin predominantly during replication and is replaced in a replication-independent manner by the histone variant H3.3, which differs from H3 by only four amino acids. H3.3 tends to accumulate in active chromatin (McKittrick, Gafken et al. 2004). Similarly, the histone H2A.Z variant of H2A marks regions around gene promoters (Redon, Pilch et al. 2002; Zhang, Roberts et al. 2005), and CENP-A, which is a more divergent form of histone H3, is located exclusively in centromeric regions, where it plays essential functions including proper segregation of chromosomes (Howman, Fowler et al. 2000; Régnier, Vagnarelli et al. 2005).
Figure 1.1.1: Schematics of nucleosome structure. The nucleosome is the basic unit of chromatin, and consists of a protein octamer containing two molecules each of histones H2A, H2B, H3, and H4, around which 147 base pairs of nuclear DNA is wrapped. Left: the nucleosome core particle is shown with six histone N-termini tails and two C-termini tails. Coloured symbols indicate post-translational modifications and numbers amino acid positions. All DNA-related processes such as transcription, replication and repair must gain access to the DNA, which is mediated by the dynamic nature of the nucleosome structure and regulated by numerous post-translational modifications found at both the N and C-termini of the core histones. Right: Schematic representation of the organization of histones within the nucleosome core particle (DNA in black, N-tails in colour)
Histone post-translational modifications
A number of histone modifications exist on all the four basic histones that form the nucleosome core and this list is still growing (Bannister and Kouzarides 2011). These modifications can either directly alter the structure of the chromatin by their mere presence on the nucleosomes or can in turn create affinities for other chromatin-associated proteins to cause downstream alterations, e.g. recruitment of Heterochromatin Protein 1 (HP1) by the methylated lysine 9 of histone H3 or Polycomb-group proteins (PcG) by the H3K27me3 to establish a silenced chromatin state. Histone PTMs might also regulate chromatin dynamics by recruiting remodeling enzymes that utilize the energy derived from the hydrolysis of ATP to reposition nucleosomes.
Specific histone modifications are associated with various chromatin dependent processes such as the regulation of gene expression or heterochromatin formation. For example, silent and active genes are typically associated with hypo-acetylated and hyper-acetylated histones respectively. On the other hand, methylation of lysine residues can be associated with either activation or repression depending on the residue, and the degree of methylation or the organism concerned. Thus, H3K9me3 tends to mark active genes in Arabidopsis but is located primarily in heterochromatin in Drosophila and mammals (Berger 2007; Kouzarides 2007; Li, Carey et al. 2007). A number of high-resolution epigenomic maps of histone PTMs have been recently obtained for a range of model organisms, including plants, through a combination of chromatin technologies and genomic tiling microarrays or high-throughput sequencing based approaches. Most studies in plants have focused on the methylation and acetylation of lysine residues on histone H3 (Zhang, Clarenz et al. 2007; Bernatavichute, Zhang et al. 2008; Charron,
He et al. 2009; Zhang, Bernatavichute et al. 2009; Zhou, Wang et al. 2010; Roudier, Ahmed et al. 2011) and have revealed the complex association between different modifications and the underlying chromatin structure. For example, the chromatin domains marked by H3K9me2 are often also marked by the methylation of cytosine residues in DNA (DNA methylation) and this combination is a characteristic feature of repeat and transposable element sequences that form constitutive heterochromatin. H3K4me3, H3K9ac, H3K27ac, and H3K36me3 on the other hand show a strong positive correlation with expression levels and are typically associated with transcriptionally active euchromatic domains (Charron, He et al. 2009; Zhou, Wang et al. 2010). Another histone mark, H3K27me3, is a repressive mark associated with facultative heterochromatin and typically found on silent non-transposable element genes. Polycomb repressive complexe PRC2, a conserved member of the PcG family of proteins is responsible for the deposition of this mark and contributes to chromatin compaction (Margueron and Reinberg 2011) . The marks H3K4me1 and H3K4me2 do not show any significant correlations with gene expression levels and their roles instead depend on the co-occurrence with other chromatic marks such as H3K4me3 or H3K27me3 (Zhang, Clarenz et al. 2007). Thus the chromatin-DNA interactions are often guided by combinations of histone marks that establish and stabilize a given chromatin state. This combinatorial regulation by histone PTMS has been proposed to involve the so-called ‘histone code’ (Jenuwein and Allis 2001). An overview of known histone modifications along with their associated putative functions is shown in Table 1.1.
DNA Methylation
DNA methylation refers to the enzymatic transfer of a methyl group (-CH3) to the cyclic carbon
5 or nitrogen 4 of cytosines and to the nitrogen 6 of adenines. In eukaryotes, DNA methylation is almost exclusively restricted to the carbons of cytosine residues and acts as a classic epigenetic mark that plays key roles in the control of genome activity. DNA methylation in higher eukaryotes is essential for development and cellular differentiation. However the propagation of this mark dramatically differs between plants and mammals. Thus whereas plants tend to propagate pre-existing DNA methylation states across generations, mammals typically remove this mark during zygote formation and re-establish it through successive cell divisions during development. A recent report, however, indicates that in zygotes hydroxylation of methyl groups occurs rather than the complete removal of methyl groups (Iqbal, Jin et al. 2011).
Methylation of DNA is a hallmark of epigenetic inactivation and heterochromatin in both plants and mammals, typically associated with a silenced chromatin state, and is largely confined to silent repeat elements and transposon sequences. DNA methylation in mammals predominantly occurs on cytosine residues found in a symmetrical sequence context (CG sites) and is estimated to occur at ~70-80% of CG dinucleotides throughout the genome (Ehrlich, Gama-Sosa et al. 1982). Key exceptions to this global methylation of the mammalian genome are CpG islands found as dense clusters of CG dinucleotides near gene promoters. A considerable amount of non-CG methylation is also found in mammalian embryonic stem (ES) cells where one quarter of 5-methyl cytosine was found to occur as CHG or CHH sites (Lister, Pelizzola et al. 2009). In plants, methylation can be observed on any kind of cytosine i.e.,
cytosine bases found in a symmetrical sequence context (CG and CHG sites; H is A, T or C) as well as in asymmetrical sequence contexts (CHH sites).
Genomic Context of DNA Methylation
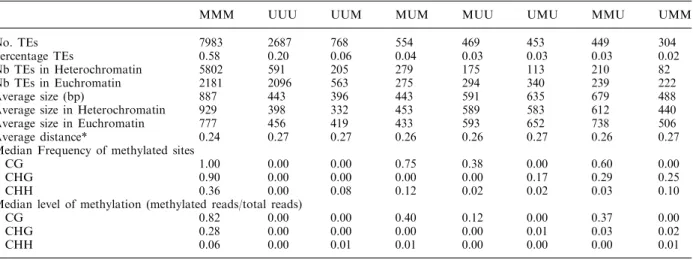
Eukaryotic genomes consist not only of genic sequences but also of transposable elements (TEs), that are capable of moving to new locations and have a potential to increase their number of copies from one generation to another (Orgel and Crick 1980). Genome sequencing has revealed that TEs comprise a large fraction of most eukaryotic genomes, including the human genome (approx. 50% ;(Lander, Linton et al. 2001)) and proliferation of these elements is largely responsible for differences in genome size among eukaryotes (Kidwell 2002). These mobile DNA sequences, often considered as ‘selfish’ or ‘parasitic’ elements, are highly mutagenic, and active TEs can disrupt protein coding genes, cause chromosomal breakage, illegitimate recombination or other genome rearrangements. The various classes of transposon sequences employ different mechanisms to proliferate within a genome. For example, Class I elements, termed retrotransposons, use an RNA intermediate for their transposition, Class II or DNA transposons employ a ‘cut and paste strategy,’ and a third class of transposons called Helitrons are thought to use a ‘rolling circle mechanism’. Most TEs of any class are not actively duplicating or transposing mainly due to a mutation or deletion of a part of the TE sequence (non-autonomous elements). However, full-length autonomous copies of TEs are present, and these are typically silent (Slotkin and Martienssen 2007; Lisch 2009). Although TE activity is typically deleterious within the lifespan of an organism, their role over evolutionary time-scales is considered to be a major factor that contributes to shaping the functional genome of an organism.
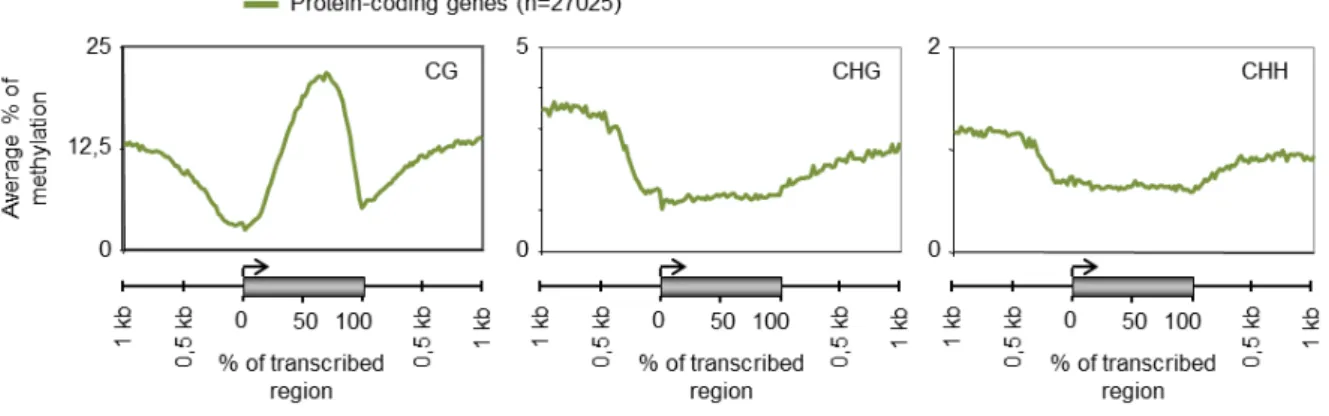
Genome-wide and other local mapping studies of DNA methylation have long indicated both non-autonomous and full-length TEs to be the main targets of cytosine DNA methylation in eukaryotes. Multiple lines of evidence indicate that eukaryotic DNA methylation serves primarily to keep in check these potentially harmful sequences (Suzuki and Bird 2008) and cytosine methylation is therefore generally seen as a classical silencing epigenetic mark that is associated with the repression of TEs and other repetitive sequences. However, gene-body methylation has been proposed as an ancient property of eukaryotic genomes with preference for exons in most organisms including Arabidopsis thaliana where it is associated with active genes (Zhang, Yazaki et al. 2006; Zilberman, Gehring et al. 2007; Cokus, Feng et al. 2008; Lister, O'Malley et al. 2008; Feng, Jacobsen et al. 2010; Zemach, McDaniel et al. 2010). Unlike in transposons, where cytosine methylation is distributed throughout the length of the TE sequence, methylation within genes occurs predominantly at CG sites only, is confined to the transcriptional part of the gene, and is depleted at both the 5’ and 3’ ends of coding sequence (Figure 1.2.1). This suggests that methylation at the 5’ and 3’ ends of genes could be inhibitory to transcription, potentially interfering with initiation or termination. Indeed, methylation of promoter sequences and 5’ coding sequences is strongly negatively correlated with the expression of the downstream gene.
Figure 1.2.1: Analysis of CG, CHG and CHH methylation levels in wild type for the entire set of annotated protein coding genes in the Arabidopsis genome (27,025 genes). DNA methylation data are from (Cokus, Feng et al. 2008).
It has also been proposed that moderately transcribed genes are more likely to be methylated than those with low or high expression (Zhang, Yazaki et al. 2006; Zilberman, Gehring et al. 2007), suggesting a scenario where the transcription process itself could contribute to maintaining or enhancing DNA methylation levels over the transcriptional unit. CG methylation in gene bodies of certain mammalian genes has also been observed and is found to be positively correlated with levels of transcription(Jones 1999), and there is now growing evidence that this may be a general phenomenon (Ball, Li et al. 2009). Gene-body methylation has been hypothesized to suppress spurious initiation of transcription within active genes in Arabidopsis and a similar function may exist in mammals (Suzuki and Bird 2008; Feng, Jacobsen et al. 2010; Zemach, McDaniel et al. 2010).
DNA methylation can suppress transcriptional activity or lead to silent chromatin in two ways. First, the methylation of DNA itself may physically impede the binding of transcription factors to
the gene and make the gene inaccessible to the transcription machinery. Second, in a more likely scenario, methylated DNA may be bound by methyl-cytosine binding proteins. These proteins can then recruit additional proteins to the locus, such as histone deacetylases and other chromatin remodelling proteins that can modify histones or remodel the chromatin, thereby forming compact, inactive and silent chromatin.
Establishment and maintenance of DNA methylation
The DNA methyltransferase (DNA MTase) family of enzymes catalyzes the transfer of a methyl group to cytosine bases in DNA and all known DNA MTases use S-adenosyl-L-methionine (SAM or AdoMet) as a methyl group donor. In Arabidopsis, DOMAINS REARRANGED METHYLTRANSFERASE 2 (DRM2), a homologue of the mammalian de novo DNA methyltransferase DNMT3, is primarily responsible for catalyzing de novo DNA methylation (Cao and Jacobsen 2002). DNA METHYLTRANSFERASE 1 (MET1), which is the homologue of mammalian DNMT1, and the plant-specific methyltransferase (CMT3 in Arabidopsis) , are CG-specific and CHG-CG-specific maintenance methyltransferases, respectively. Although, a general perception is that distinct cytosine DNA methyltransferases are responsible for either de novo or maintenance methylation, an emerging view is that different DNA MTases frequently cooperate to catalyse both steps.
After each round of DNA replication, DNA methylation of the newly synthesized strand is either guided by the parental strand (maintenance) or established de novo through RNA directed DNA methylation (RdDM). RdDM refers to the RNA interference (RNAi) mediated cellular response in plants to the presence of double stranded RNA (dsRNA) in the cell, in which the dsRNA is
processed by the RNase III-like endonuclease, Dicer, to produce small RNAs (siRNAs), which then are loaded on an Argonaut complex to guide DNA MTases to the homologous DNA sequences:. This process induces de novo DNA methylation of cytosine bases in all sequence contexts (CG, CHG, CHH) at the region of siRNA-DNA sequence homology. A prerequisite for siRNA biogenesis is the presence of dsRNA precursors which can form either by bidirectional transcription, transcription through inverted repeats or conversion of transcripts into dsRNA by RNA-dependent RNA polymerases (RDRs). Small RNAs are then incorporated into multiprotein silencing effector complexes to direct either mRNA degradation and repress translation via post transcriptional gene silencing (PTGS), or target DNA methylation and associated repressive chromatin modifications and lead to transcriptional gene silencing (TGS) in a sequence-dependent manner. A vital component of these silencing effector complexes is an argonaute (AGO) protein, which can bind small RNAs through its PAZ domain. Specific members of the argonaute protein family confer functional specificity to different silencing pathways which can be distinguished by either source of dsRNA, size-class of small RNA, or nature of target sequence. Thus, in Arabidopsis whereas the argonaute protein, AGO4 is a member of the RNA-induced transcriptional silencing complex (RITS) involved in TGS and associates with 24-nt siRNAs, AGO1 incorporates into RNA induced silencing complex (RISC) and leads to 21-nt siRNA or miRNA guided cleavage of the target mRNAs (PTGS).
Since cytosines at CG and CHG sites are in a symmetrical sequence context, methylation at these sites has been largely thought to be dependent on maintenance mechanisms (Figure 1.2.2 b; (Teixeira and Colot 2010)). While this holds true for the CG sites, where methylation is mainly under the control of METHYLTRANSFERASE1 in plants (homolog of mammalian
methyltransferase Dnmt1) and Dnmt1 in vitro has a higher affinity for hemi-methylated than for unmethylated CGs (Goll and Bestor 2005). However, the maintenance of methylation at CHG sites does not solely seem to depend on the palindromic symmetry of the sequence, as, methylation maintenance at these sites is mainly carried out by CHROMOMETHYLASE3 (CMT3), a chromodomain containing plant-specific methyl-transferase, and SUVH4, the main histone MTase for histone H3K9 dimethylation (Sharif, Muto et al. 2007; Ooi, O'Donnell et al. 2009). The chromodomain of CMT3 can recognize dimethylated H3K9 and the SRA domain of H3K9 methyl-transferase can bind to methylated CHG sites (Johnson, Bostick et al. 2007).
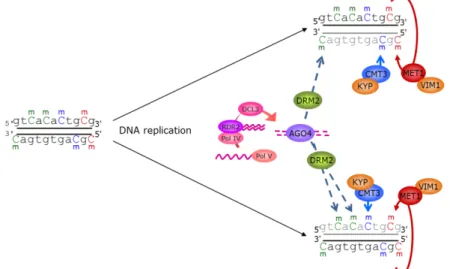
Figure 1.2.2 a: Proposed model for de novo methylation by the RdDM pathway in Arabidopsis. Primary RNA transcripts are thought to be produced by RNA polymerase Pol IV (or perhaps Pol II) and converted by the RNA-dependent RNA polymerase RDR2 into long dsRNAs. Intra- or intermolecular long dsRNAs could also be produced from inverted repeats or as a result of sense/antisense transcription. The long dsRNAs are then processed by the RNase III enzyme DCL3 into 24-nt siRNAs, which are loaded into a silencing complex containing AGO4. Formation of the siRNA-loaded AGO4 complex, in concert with transcription of the target locus by the RNA polymerase Pol V, would lead to the recruitment of the DNA MTase DRM2 to mediate de novo DNA methylation of the target locus in all sequence contexts. Transcripts produced by either Pol IV or Pol V and corresponding to the methylated region would then be used to amplify the production of siRNAs, creating a reinforcing loop. All cytosines on the two DNA strands are shown as methylated for simplicity. However, not all cytosines within a target sequence are expected to become methylated at once. Black and coloured Cs represent unmethylated and methylated (m) sites, respectively (CG – red; CHG – blue; CHH – green; Taken from Teixeira & Colot 2010).
Figure 1.2.2 b: Proposed model for maintenance of DNA methylation in Arabidopsis. After DNA replication, the newly synthezised strand (grey) is unmethylated. The SRA- and RING-domain-containing protein VIM1 is thought to recognize hemi-methylated CG sites and help recruit the DNA Mtase MET1 to these sites. Maintenance of CHG methylation is thought to involve a reinforcing loop between the plant-specific DNA MTase CMT3 and the H3K9me2 methyltransferase SUVH4/KYP. CHH methylation is propagated in a locus-specific manner by the constant action of RdDM (represented only by AGO4 and DRM2 for simplicity) and/or by CMT3 and MET1 (not shown). Colours are as in Figure 1.2.2 a. (Figure adopted from Teixeira & Colot 2010)
Regulation of DNA methylation
Epigenetic regulation implies that marks corresponding to active and inactive chromatin states are not only heritable but also potentially reversible. Cytosine DNA methylation indeed can be lost through passive or active means. Passive loss occurs when methylated cytosine bases fail to maintain their methylated status during multiple rounds of DNA replication. In contrast, active demethylation can occur in non-dividing cells and require the activities of demethylating enzymes known as DNA glycosylases, which function through a base excision repair mechanism, i.e., they remove and replace a methylated cytosine base from the DNA double helix with a normal cytosine. Active DNA demethylation occurs genome-wide in both mammals and plants during pre- and post-zygotic reproductive stages. In mouse embryos, immediately after fertilization the paternal genome is demethylated by an active mechanism and the maternal genome is demethylated by a passive mechanism that depends on DNA replication. Around the time of implantation both are remethylated to different extents in the embryonic and extraembryonic lineages (Reik, Dean et al. 2001; Feng, Cokus et al. 2010). Similarly, in angiosperms like Arabidopsis, genome-wide loss of DNA methylation occurs in the endosperm by simultaneous loss of DNA MTase MET1 and induction of DEMETER (DME), a DNA glycosylase that removes cytosine methylation in all sequence contexts (Gehring, Bubb et al. 2009; Hsieh, Ibarra et al. 2009). Both plants and mammals use DNA methylation for gene imprinting, which is the parent-specific differential expression of alleles of the same gene. Imprinting in mammals is established in the germline cells, passed to the zygote and maintained throughout development of the embryo and adult life and is then erased in primordial germ cells (PGCs) before new imprints are set. In plants imprinting occurs in the endosperm, the structure that nurtures the
developing embryo. Thus, whereas imprinting in mammals is the consequence of differential methylation of specific sequences in gametes (Munshi and Duvvuri 2007), plants such as Arabidopsis implement a more drastic form of imprinting in which the genome-wide loss of methylation in endosperm, mediated by DME, results in a methylation asymmetry between embryo and endosperm (Gehring, Bubb et al. 2009; Hsieh, Ibarra et al. 2009) that also demethylates maternal alleles of imprinted genes and causes endosperm-preferred expression for these genes.
DNA methylation plays an essential role in safeguarding the integrity of the genome, particularly in germ cells, against the activities of parasitic elements such as transposons. A major safeguarding mechanism which ensures the silencing of these elements is via transcriptional (TGS) or posttranscriptional gene silencing (PTGS) mediated by RNAi. TGS at transposons and other repeats in Arabidopsis is strictly enforced via methylation at all three types of sites but largely at CG sites that involves the maintenance activities of MET1 and DDM1, a SWI-SNF chromatin-remodelling factor with intrinsic affinity for transposons and/or repeats. In contrast, genes show a MET1 dependent and DDM1 independent type of methylation (Lippman, Gendrel et al. 2004; Teixeira, Heredia et al. 2009). However, it remains to be seen whether RNAi has any role in gene methylation, though it has been postulated that miRNAs (endogenous ~21-nt small RNAs) may guide DNA methylation of genes in some circumstances like mRNA cleavage of the PHABULOSA gene mediated by miRNA 165 and 166 in
Arabidopsis and subsequent methylation of the gene downstream of miRNA-DNA sequence
TGS directed at transposons and other repeat elements can also epigenetically regulate the expression of neighbouring genes as in the case of the imprinted homeobox gene FWA
(Fujimoto, Kinoshita et al. 2008). Thus transposons can play a major role in shaping the
functional genome. Transposons, because of their inherent capability to move from one position to another in a genome, are potentially deleterious, and are therefore the main targets of DNA methylation-mediated TGS silencing. Hence, transposons rarely move during the life span of an organism. When a transposon lands closer to a gene sequence, it may affect gene activity by either disrupting the promoter structure in the first place and rendering an active promoter as non-functional, or the new insertion may occur close to the gene regulatory sequences without having a direct impact on promoter activity. However, the subsequent transcription from the new insertion may recruit silencing marks like DNA methylation to the locus and could even additionally spread this methylation via the so-called secondary RdDM (Daxinger, Kanno et al. 2009) or DNA methylation spread (Ahmed, Sarazin et al. 2011) to the promoter regions of neighboring genes.
Methods to identify DNA methylation
Hybridisation-based methods have long been used to characterize methylated regions in DNA. However, these methods cannot be directly used to identify DNA methylation states because the methyl group is located in the major groove of DNA and does not impose a detectable effect on the hydrogen bonding properties of methyl-cytosine (Laird 2010). Therefore, methylation dependent pre-treatments of genomic DNA are employed to reveal the presence or absence of the methyl group at cytosine residues. Currently, three main approaches are used to identify DNA methylation (Lister and Ecker 2009; Laird 2010):
(i) Endonuclease digestion, based on treatment of DNA with methylation-sensitive restriction enzymes followed by hybridization to high-density oligonucleotide arrays. Being dependent on the presence of specific recognition sites for the restriction enzyme, this method can only identify a subset of all methylation sites. However, a mixture of different restriction enzymes is typically used which greatly improves the detection capabilities of this technique. The other major issue with this technique is that precise location of the methyl-cytosines and therefore the context of the methylation is not identifiable.
(ii) Affinity enrichment of methylated regions using antibodies specific for 5mC or using methyl-binding proteins. These techniques rely on the capture of methylated regions by immuno-precipitation of denatured genomic DNA with an antibody specific for methylated cytosine, or methyl-binding proteins, followed by hybridization to either a tiling array {MeDIP-chip} or sequencing {MeDIP-seq}. Affinity-based methods allow for rapid and efficient genome-wide assessment of DNA methylation. However, these techniques are subject to several limitations including low resolution of detection, cross hybridisation, inability to determine individual cytosine context, requirement for a dedicated array, and bias toward CG-rich sequences and low sensitivity for CG-poor regions. Therefore affinity based methods require substantial experimental or bioinformatic adjustment for various kinds of biases which also includes adjustments for the CpG density at different genomic regions.
(iii) Bisulphite conversion, which provides high-resolution detection of DNA methylation, is regarded as the gold-standard methodology for identifying cytosine methylation. Genomic DNA is treated with sodium bisulfite under denaturing conditions which converts cytosines, but not
methyl-cytosines, into uracil via a sulfonation, deamination, desulfonation reaction. Subsequent synthesis of the complementary strand and sequencing allows determination of the methylation status of cytosines on each strand of the genomic DNA simply by observing whether the sequenced base at a cytosine position is a thymine (unmethylated) or a cytosine (methylated).
Thanks to the dramatic advances being made in high-throughput DNA sequencing it is now possible to map the sites of DNA methylation at single-base resolution throughout an entire genome. Autocorrelation analysis has revealed a significant correlation between methylation states of cytosines within 1000 bases (Cokus, Feng et al. 2008). This has prompted the question of whether it is necessary to identify sites of DNA methylation at the single-base resolution and this idea is reinforced by a revised model that points to the possibility of overall methylation levels of a region being important and copied from parent to daughter strands rather than the exact methylation status of each individual cytosine (Jones and Liang 2009). However, numerous studies have demonstrated the critical importance of knowing the methylation status of individual cytosine sites, including a recent report that shows RNA-directed DNA methylation of a single CpG located within a putative conserved element of the Petunia floral homeotic gene pMADS3 that causes ectopic expression of pMADS3 (Shibuya, Fukushima et al. 2009). Further, 5-methylcytosine could play a role like single nucleotide polymorphisms (SNPs), and contribute towards genotype (epigenotype in this case) to phenotype differences. This makes it particularly important to understand and analyse the genome-wide distribution of this mark at single-base resolution.
Bisulphite-based methods tend to be fairly accurate and reproducible. The major sources of bias and measurement error are incomplete bisulphite conversion and differential PCR efficiency for methylated versus unmethylated versions of the same sequence. Bisulphite conversion destroys the self-complementarity of DNA, and therefore, PCR amplification of the bisulfite treated DNA results in four distinct strands (Xi and Li 2009): bisulfite Watson (BSW), bisulfite Crick (BSC), reverse complement of BSW (BSWR), and reverse complement of BSC (BSCR). Furthermore, a T in the bisulfite read could be mapped to either a C or T in the reference sequence but not vice versa. Such asymmetric C/T matching is critical for mapping high-throughput bisulfite reads to the reference genome. Hence aligning millions of bisulfite-treated short reads (BS reads) onto a reference genome remains a challenge and most short read alignment tools, such as BLAT (Kent 2002), SOAP (Li, Li et al. 2008), and Bowtie (Langmead, Trapnell et al. 2009) do not explicitly enable bisulfite mapping. However there are some newly developed software tools like BSMAP (Xi and Li 2009), RMAP (Smith, Chung et al. 2009), MAQ (Li, Ruan et al. 2008) and BS Seeker (Chen, Cokus et al. 2010) that can be used for the alignment of bisulphite-treated short reads to the reference genome. The first whole-genome shotgun bishlphite sequencing library, reported by Cokus et al. for Arabidopsis used an aligner algorithm called CokusAlignment (Cokus, Feng et al. 2008). The CokusAlignment applied several computational filters to the bisulphite-treated short reads including removing sequences that likely mapped to multiple positions and potentially unconverted reads that contained at least three consecutive cytosines in the CHH context. Using reads of length ~30 bases, 2.6 Gb of sequence reads were retained post-filtering, covering; 85% of the 43 million cytosines in the 119 Mb of Arabidopsis genome with an average coverage of 20X (Cokus, Feng et al. 2008).
The bioinformatics of epigenome data analysis
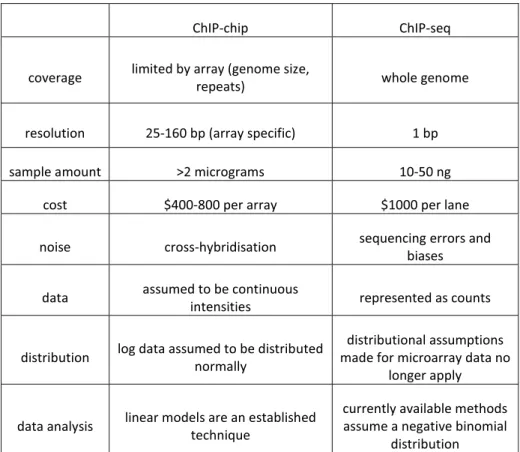
The analytical methods used to explore epigenomics data need to be adapted to the approaches used to generate the data in the first place. Chromatin immunoprecipitation followed by hybridisation to tiling microarrays (ChIP-chip) or massively parallel sequencing (ChIP-seq) are currently the most widely used approaches for identification of chromatin modifications. Although microarrays offer lower cost and higher throughput for certain applications, sequencing-based methods are increasingly being used as they offer many advantages, such as increased resolution and higher sampling. A comparison of the ChIP-chip and ChIP-seq technologies is given in Table 1.3.1
High throughput sequencing technologies currently comprise Illumina's Genome Analyzer and HiSeq (http://www.illumina.com/), Roche's 454 (http://www.454.com/), Helicos 'Helioscope and Applied BioSystems' SOLiD (https://products.appliedbiosystems.com) as well as emerging platforms such as Pacific Biosciences (http://www.pacificbiosciences.com/) and Intelligent Bio Systems (http://intelligentbiosystems.com/). These technologies generate millions of short reads that can be aligned to a reference genome. Various software applications have been written that use different algorithmic approaches and flexibility constraints for the efficient mapping of short reads. A summary of some of the widely used tools is given in table 1.3.2.
Table 1.3.1 Comparison of ChIP-chip and ChIP-seq methodologies.
ChIP-chip ChIP-seq
coverage limited by array (genome size,
repeats) whole genome
resolution 25-160 bp (array specific) 1 bp
sample amount >2 micrograms 10-50 ng
cost $400-800 per array $1000 per lane
noise cross-hybridisation sequencing errors and biases
data assumed to be continuous
intensities represented as counts
distribution log data assumed to be distributed normally
distributional assumptions made for microarray data no
longer apply
data analysis linear models are an established technique
currently available methods assume a negative binomial
distribution
Table 1.3.2: Summary of short-read sequence alignment tools
Name URL Description
BFAST http://bfast.sourceforge.net/
Short read mapping, supported by indexing the reference sequences. Can handle billions of short reads and
accommodate insertions, deletions, SNPs, and colour errors (can map ABI SOLiD colour space reads). Performs a full Smith Waterman alignment.
Bowtie http://bowtie-bio.sourceforge.net/
Uses a Burrows-Wheeler transform to create a permanent, reusable index of the genome. Aligns more than 25 million Illumina reads in 1 CPU hour. Supports Maq-like and SOAP-like alignment policies.
BRAT http://compbio.cs.ucr.edu/brat/ Bisulphite (BS-seq) read mapping
BSMAP http://code.google.com/p/bsmap
Name URL Description
BS Seeker http://pellegrini.mcdb.ucla.edu/B S_Seeker/BS_Seeker.html
Performs accurate and fast mapping of bisulfite-treated short reads. It aligns Bisulfite-treated reads generated from the Cokus et al's library protocol (with tags) or the Lister et al's library protocol (with no tags)
BWA http://bio-bwa.sourceforge.net/
Uses a Burrows-Wheeler transform to create an index of the genome. It's a bit slower than bowtie but allows indels in alignment.
CokusAlignm ent
http://epigenomics.mcdb.ucla.ed
u/BS-Seq/download.html Bisulphite read mapping
ELAND
ELAND module within the Illumina Genome Analyzer Pipeline Software(Illumina, Inc., San Diego, CA)
Implemented by Illumina. Includes ungapped alignment with a finite read length.
GMAP and GSNAP
http://research-pub.gene.com/gmap/
Robust, fast, short-read alignment. GMAP: longer reads, with multiple indels and splices; GSNAP: shorter reads, with a single indel or up to two splices per read. Useful for digital gene expression, SNP and indel genotyping.
GNUMAP http://gemlibrary.sourceforge.ne t/
Accurately performs gapped alignment of sequence data obtained from next-generation sequencing machines (specifically that of Solexa/Illumina) back to a genome of any size. Includes adaptor trimming, SNP calling and Bisulfite sequence analysis.
MAQ http://maq.sourceforge.net/ Ungapped alignment that takes into account quality scores for each base.
mrsFAST http://mrsfast.sourceforge.net/ Short read mapping (supports BS-seq)
Novoalign http://www.novocraft.com/
Gapped alignment of single end and paired end Illumina GA I & II reads and reads from the new Helicos Heliscope Genome Analyzer. High sensitivity and specificity, using base qualities at all steps in the alignment. Includes adapter trimming, base quality calibration, BS-seq alignment, and option to report multiple alignments per read.
RMAP http://www.cmb.usc.edu/people /andrewds/rmap/
Short read mapping from 20bp to at most 64bp (supports BS-seq)
SAMTools http://samtools.sourceforge.net/ Read alignment manipulation, including allele specific expression
SeqMap http://biogibbs.stanford.edu/~jia ngh/SeqMap/
Supports up to 5 mixed substitutions and
insertions/deletions. Various tuning options and input/output formats.
The millions of short reads generated by the sequencing machines are usually presented in a format that associates a quality score to each of the bases. FASTQ is a file format initially developed by the Wellcome Trust Sanger Institute to bundle a FASTA sequence and its quality data. While FASTQ has quickly become the standard for storing short reads, each platform may have native formats that can be converted into FASTQ. For example, Illumina software modules generate data in QSEQ format, which can be directly converted to FASTQ. The ABI SOLiD platform uses a 2 base encoding for their nucleotide sequences and hence uses a “Color Space” FASTA file (CSFASTA).
A FASTQ file normally uses four lines per sequence. Line 1 begins with a '@' character and is followed by a sequence identifier and an optional description (like a FASTA title line). Line 2 is the raw sequence letters. Line 3 begins with a '+' character and is optionally followed by the same sequence identifier (and any description) again. Line 4 encodes the quality values for the sequence in Line 2, and must contain the same number of symbols as letters in the sequence. A minimal FASTQ representation is shown below:
• @HWI-ST169_0186:4:1:1369:1932#0/1
• NCCTAACGACGTTTGGTCAGTTCCATCAACATCATAGCC... • +HWI-ST169_0186:4:1:1369:1932#0/1
• BUWUX[WVWVccccc_\ccccccccccacccc_cc^V^^V[[][[^^X^B...
The quality assurance step processes the FASTQ files by applying some quality checks and clean-up, thereby producing a “clean” FASTQ file per sample. Cleaned-up FASTQ files can be used as input for many of the sequence alignment programs that have been developed to map
short reads to a reference genome. This produces a Sequence Alignment/Map (SAM) file per sample (as well as a file of reads that were not aligned). SAM is a very versatile and near-standardized format for storing many aligned nucleotide sequences. BAM is simply a more compact binary form of the SAM format and the two formats have a back and forth compatibility by using utilities from the SAMtools package (http://samtools.sourceforge.net/). The SAMtools utilities provide all kinds of support to manipulate and operate SAM/BAM files such as sorting, indexing, merging, and building reports of per-base-pair alignment data. SAM files can be sorted or unsorted, but because most tools require the data to be sorted so as to be able to operate within genomic intervals of interest and because sorting doesn’t lose any information, it has become a standard practice to work on sorted SAM files.
A measure of how many reads cover a given genomic locus is given by the “read depth” parameter. The value simply indicates the height of a pile up of reads that have been assembled or mapped to a given genomic locus. In the case of sequence alignment to a reference genome, higher read depth means more certainty in the “consensus” sequence of the sample and more accuracy in detecting variants from the reference. For de novo assembly of a genome, a higher read depth is usually needed, so that large contigs can be formed that are then the building blocks for a draft genome.
R and Bioconductor support
R (http://www.r-project.org/) is a programming language and software environment for statistical computing and graphics. The R language has become a de facto standard among statisticians for developing softwares. Bioconductor (http://www.bioconductor.org/) is a
resource of open software development projects for computational biology and bioinformatics and provides tools for the analysis of high throughput genomic data. Bioconductor uses the R statistical programming language, and is open source and open development. A number of Bioconductor packages have already been developed for analysing next-generation sequencing data and can be used to import fasta, fastq, ELAND, MAQ, BWA, Bowtie, BAM, gff, bed, wig, and other sequence formats, or, trim, transform, align, and manipulate sequences, perform quality assessment for ChIP-seq, RNA-seq, differential expression and other workflows (Figure 1.3.1).
Figure 1.3.1: A selection of Bioconductor packages to analyse high throughput sequencing data. Packages can inherit the functionalities from other packages. Dependencies are shown here with arrows.
The GenomicFeatures package provides a set of tools and methods for making and manipulating transcript centric annotations. With these tools one can easily download the
genomic locations of the transcripts, exons and cds of a given organism, from either the UCSC Genome Browser or a BioMart database. The rtracklayer (Lawrence, Gentleman et al. 2009) package provides an interface between R and genome browsers and lets one manipulate annotation tracks in various formats (currently GFF, BED, bedGraph, BED15, and WIG built-in). This package includes functions that import/export tracks to/from the supported browsers, as well as query and modify the browser state, such as the current viewport. The chipseq (Kharchenko, Tolstorukov et al. 2008) package provides useful tools for design and analysis of ChIP-seq experiments and detection of protein binding positions with high accuracy. These tools include functions that improve tag alignment and correct for background signals. The as-yet-unreleased version of the chipseq package is also aimed at providing convenient interfaces to other powerful packages such as ShortRead and IRanges. The Biostrings package contains memory efficient algorithms for string matching of biological sequences or fast manipulations of larger sets of sequences. The ShortRead package (Morgan, Anders et al. 2009) provides useful tools for analysing high throughput short read sequencing data. These tools include input and output, quality assessment, and downstream analysis functions. The IRanges package provides Infrastructure for manipulating intervals on sequences including functions for representation, manipulation, and analysis of large sequences and subsequences. The package provides efficient low-level and highly reusable classes for storing ranges of integers, Run-Length Encoding vectors, and, more generally, data that can be organized sequentially like Vector objects, as well as views on these Vector objects. The BSgenome package is a container for complete genome sequence of an organism and allows for accessing, analysing, creating, or modifying the data. The biomaRt package (Durinck, Moreau et al. 2005) is an interface to
BioMart databases (e.g., Ensembl, COSMIC, Wormbase and Gramene) and allows users to connect to and search these databases and integrate them with other Bioconductor objects. The Rsamtools package provides an interface to the 'samtools' utilities for manipulating SAM/BAM format files within R environment. The ChIPpeakAnno package (Zhu, Gazin et al. 2010) provides users with facilitation tools for the batch annotation of the peaks identified from either ChIP-chip or ChIP-seq experiments. These tools include functions that find the nearest gene, exon, miRNA or transcription factor binding sites as well as identify Gene Ontology (GO) terms followed by GO enrichment tests. Besides these, there are several packages/tools for visualizing next generation sequencing data, like HilbertVis package(Anders 2009) that provides several functions for visualizing long vectors of integer data by means of Hilbert curves.
Analysis of microarray ChIP-on-chip data
ChIP-on-chip or ChIP-chip combines chromatin immunoprecipitation (ChIP) of DNA fragments associated with a given chromatin modification with hybridization to tiling microarrays in order to verify these DNA fragments. In ChIP-chip, chromatin proteins are covalently cross-linked to the DNA by formaldehyde. The chromatin is then extracted and sheared into fragments typically ~500 bp in length, which sets the limit on the resolution of this technique. The fragmented DNA is fluorescently labelled and hybridized to the tiling microarray, which consists of millions of short (25-70 bp) probes that cover or “tile” the genome at a constant spacing (4 to 100s of nucleotides). The data generated by one experiment consists of an intensity value for each DNA probe. These values measure the relative quantity of DNA at the probe's genomic position in the immunoprecipitated material. In a variant of ChIP-chip, called methyl-DNA
immunoprecipitation (MeDIP), purified DNA is immunoprecipitated with an antibody against methylated cytosine, giving rise to genomic maps of DNA methylation.
In a ChIP-chip or MeDIP experiment, biases can be introduced at various steps that include crosslinking of the DNA to proteins, fragmentation of the chromatin, immunoprecipitation, PCR amplification, and hybridization to the array. In addition, when using two-colour arrays, the “dye-swap” experiments are needed to correct for dye-dependent biases.
Flawed array measurements can be identified by plotting log of the intensity values (log2) of pairs of biological replicates for each probe in an X-Y scatter plot. The data points on these scatter plots should lie scattered close to a straight line. A large difference in the scales of two replicates or a bend in the scatter plot regression curve would indicate problems in the underlying experimental protocol that has led to nonlinearity between the measurements. If the log intensity values for two replicates are distributed approximately along a straight line, a scale normalization (Smyth and Speed 2003) can be used to bring them onto the diagonal. In scale normalization, the log intensity values of each replicate are divided by their median absolute deviations (MAD). The MAD estimates the spread of a distribution, similar to that of a standard deviation, but it is preferable because of its much better robustness with respect to outliers. MAD is the median of the absolute deviations of all measurements from the median. If
median{x1,...,xm} denotes the median of m measurements x1,..,xm. Then, the absolute
deviation of x1 from the median is |x1-median{x1,..,xm}|. The MAD of measurements x1,...,xm is
defined as
In case of a nonlinear relationship between the replicates, quantile normalization (Bolstad, Irizarry et al. 2003) can be used to map them onto the diagonal and can be performed with several packages available from Bioconductor (e.g. RINGO, vsn, affy). This normalization will make the replicate measurements comparable and allow averaging over them. Outliers in the scatter plot indicate corrupted probes in one of the arrays. Their values should be set to the geometric average of the two neighbouring probes or to NA (“not available”). Many outliers indicate a corrupted array.
Normalisation with the genomic input DNA (called reference) is the most effective way of minimising the strong sequence-dependent probe hybridization biases, chromatin-dependent cross-linking and fragmentation, and many of the other biases. This is achieved by subtracting from each probe the averaged log reference intensity from the averaged log signal intensity. This is equivalent to taking the log of the ratio of the mean signal intensities over the mean reference intensities:
log enrichment = arithmetic mean of log (signal) – arithmetic mean of log (reference) = log(mean of signal / mean of reference)
In addition to the RINGO package that allows to perform many of the normalisation procedures, Bioconductor offers several other packages for the analysis of microarray datasets from different platforms including Affymetrix, Illumina, Nimblegen, Agilent, and other one- and two-color technologies. Major workflows in Bioconductor include pre-processing, quality assessment, differential expression, clustering and classification, gene set enrichment analysis etc.
Peak Finding
One of the important goals of high throughput ChIP techniques is to find regions in the genome where more signal or ChIP-seq reads are found than one would expect to see by chance. Such regions are usually characterised by a bell shape centred on a local maximum signal, whose height or depth is significantly greater than the background noise, and defines the DNA regions preferentially associated with the modification or transcription factor under study.
A wealth of algorithmic approaches has been developed for peak finding from high throughput datasets. These can be roughly classified into window-based, overlap-based or hidden Markov models (HMM)-based approaches. In window based methods, one first defines the boundaries of a candidate region and then counts the number of reads or enriched probes within the region. In overlap-based approaches a peak is first identified that corresponds to local maxima of read counts or probe intensity values and then the boundaries of the peak are fitted according to some distribution model. In HMM-based approaches, enrichment along the genome is modelled as a distribution of ChIP-enriched states and background states. As shown in Figure 1.3.2, different mapping strategies may identify mutually exclusive regions as peaks and therefore potential binding regions (Laajala, Raghav et al. 2009; Wilbanks and Facciotti 2010), which could lead to a change in the biological significance of the conclusions.
Figure 1.3.2: A comparison of available peak finding programs. (a) Laajala et al. used 14 peak detection programs to identify binding regions. Same region detected as binding site in all the 14 algorithms is seen to display different peak widths according to the method used. (b) Based on the physical distribution of binding sites detected as peaks, the biological conclusions may change depending upon the algorithm used. For example, in the Laajala et al. study, GeneTrack, QuEST and CisGenome suggested that only less than 40% of the binding sites reside within 10 kb of a gene or are intragenic, whereas with PeakFinderC, SISSRsC, PeakSeq and HpeakC the corresponding estimate was over 70%.
(a)
(b)
Furthermore, while the peaks detected for transcription factors tend to be sharp, peaks for histone modifications or RNA Pol II occupancy are typically broader. Thus depending upon the biological study, the choice of algorithm should be changed accordingly. However, the topmost peaks are usually consistent between different algorithms and the difference arises only when looking for marginal peaks. Thus it is always better to use a combination of algorithms and take the union if one is interested in finding all the candidate regions or intersection if only the best of the candidates are to be identified. Further, candidate binding regions can be prioritized using the peak magnitude scores or their p-values, provided by the peak detection programs.
Aims and organisation of the thesis
The main objective of this thesis was to understand the spatial and temporal dynamics of chromatin states in Arabidopsis by investigating on a genome-wide scale, patterns of DNA methylation and eleven well-characterized histone post-translational modifications. The results of the analysis is organised into three chapters. The first two result chapters (Chapter II & III) reflect a rather static view of the chromatin and provide details about DNA methylation states and indexing of chromatin by epigenomic marks. Chapter II reports DNA methylation status of transposable element sequences based on a high quality TE annotation provided by our collaborators and publicly available bisulphite single base-resolution DNA methylomes. Chapter III reports results from the analyses of 11 histone modifications along with DNA methylation and provides a combinatorial perspective of epigenoms in establishing a given chromatin state. Chapter IV on the other hand focuses on a specifically chosen histone modification (H2Bub) and uses photomorphogenesis as a biological system to provide a dynamic view of this mark and its effects on the transcriptional state of the underlying chromatin in response to light driven developmental adaptation.
Finally a last Discussion section is provided that summarises the main results and achievements of the thesis.
References
:Ahmed, I., A. Sarazin, et al. (2011). "Genome-wide evidence for local DNA methylation spreading from small RNA-targeted sequences in Arabidopsis." Nucleic Acids Res.
Allemeersch, J., S. Durinck, et al. (2005). "Benchmarking the CATMA Microarray. A Novel Tool forArabidopsis Transcriptome Analysis." Plant Physiology 137(2): 588 -601.
ALLIs CD, J. T. R. D. (2007). Overview and concepts. Epigenetics. New York, Cold Spring Harbour Laboratory Press.
Anders, S. (2009). "Visualization of genomic data with the Hilbert curve." Bioinformatics 25(10): 1231-5. Ball, M. P., J. B. Li, et al. (2009). "Targeted and genome-scale strategies reveal gene-body methylation
signatures in human cells." Nat Biotechnol 27(4): 361-8.
Bannister, A. J. and T. Kouzarides (2011). "Regulation of chromatin by histone modifications." Cell Research 21(3): 381-395.
Bao, N., K. W. Lye, et al. (2004). "MicroRNA binding sites in Arabidopsis class III HD-ZIP mRNAs are required for methylation of the template chromosome." Dev Cell 7(5): 653-62.
Belotserkovskaya, R., S. Oh, et al. (2003). "FACT facilitates transcription-dependent nucleosome alteration." Science (New York, N.Y.) 301(5636): 1090-1093.
Belyayev, A., R. Kalendar, et al. (2010). "Transposable elements in a marginal plant population: temporal fluctuations provide new insights into genome evolution of wild diploid wheat." Mobile DNA 1(1): 6.
Benhamed, M., C. Bertrand, et al. (2006). "Arabidopsis GCN5, HD1, and TAF1/HAF2 interact to regulate histone acetylation required for light-responsive gene expression." The Plant Cell 18(11): 2893-2903.
Benvenuto, G., F. Formiggini, et al. (2002). "The photomorphogenesis regulator DET1 binds the amino-terminal tail of histone H2B in a nucleosome context." Current Biology: CB 12(17): 1529-1534. Berger, S. L. (2007). "The complex language of chromatin regulation during transcription." Nature
447(7143): 407-412.
Bernatavichute, Y. V., X. Zhang, et al. (2008). "Genome-wide association of histone H3 lysine nine methylation with CHG DNA methylation in Arabidopsis thaliana." PloS One 3(9): e3156. Betz, J. L., M. Chang, et al. (2002). "Phenotypic analysis of Paf1/RNA polymerase II complex mutations
reveals connections to cell cycle regulation, protein synthesis, and lipid and nucleic acid metabolism." Molecular Genetics and Genomics: MGG 268(2): 272-285.
Bolstad, B. M., R. A. Irizarry, et al. (2003). "A comparison of normalization methods for high density oligonucleotide array data based on variance and bias." Bioinformatics 19(2): 185-93. Bratzel, F., G. López-Torrejón, et al. (2010). "Keeping cell identity in Arabidopsis requires PRC1
Bray, S., H. Musisi, et al. (2005). "Bre1 is required for Notch signaling and histone modification." Developmental Cell 8(2): 279-286.
Cano, F., D. Miranda-Saavedra, et al. (2010). "RNA-binding E3 ubiquitin ligases: novel players in nucleic acid regulation." Biochemical Society Transactions 38(6): 1621-1626.
Cao, X. and S. E. Jacobsen (2002). "Role of the arabidopsis DRM methyltransferases in de novo DNA methylation and gene silencing." Curr Biol 12(13): 1138-44.
Cao, Y., Y. Dai, et al. (2008). "Histone H2B monoubiquitination in the chromatin of FLOWERING LOCUS C regulates flowering time in Arabidopsis." The Plant Cell 20(10): 2586-2602.
Carrozza, M. J., B. Li, et al. (2005). "Histone H3 methylation by Set2 directs deacetylation of coding regions by Rpd3S to suppress spurious intragenic transcription." Cell 123(4): 581-592. Charron, J.-B. F., H. He, et al. (2009). "Dynamic landscapes of four histone modifications during
deetiolation in Arabidopsis." The Plant Cell 21(12): 3732-3748.
Chen, P. Y., S. J. Cokus, et al. (2010). "BS Seeker: precise mapping for bisulfite sequencing." BMC Bioinformatics 11: 203.
Chory, J., C. Peto, et al. (1989). "Arabidopsis thaliana mutant that develops as a light-grown plant in the absence of light." Cell 58(5): 991-999.
Cokus, S. J., S. Feng, et al. (2008). "Shotgun bisulphite sequencing of the Arabidopsis genome reveals DNA methylation patterning." Nature 452(7184): 215-9.
Crevillén, P. and C. Dean (2011). "Regulation of the floral repressor gene FLC: the complexity of transcription in a chromatin context." Current Opinion in Plant Biology 14(1): 38-44. Culhane, A. C., J. Thioulouse, et al. (2005). "MADE4: an R package for multivariate analysis of gene
expression data." Bioinformatics (Oxford, England) 21(11): 2789-2790.
Daxinger, L., T. Kanno, et al. (2009). "A stepwise pathway for biogenesis of 24-nt secondary siRNAs and spreading of DNA methylation." EMBO J 28(1): 48-57.
Deng, X. W. and P. H. Quail (1999). "Signalling in light-controlled development." Seminars in Cell & Developmental Biology 10(2): 121-129.
Durinck, S., Y. Moreau, et al. (2005). "BioMart and Bioconductor: a powerful link between biological databases and microarray data analysis." Bioinformatics 21(16): 3439-40.
Eden, E., R. Navon, et al. (2009). "GOrilla: a tool for discovery and visualization of enriched GO terms in ranked gene lists." BMC Bioinformatics 10(1): 48.
Ehrlich, M., M. A. Gama-Sosa, et al. (1982). "Amount and distribution of 5-methylcytosine in human DNA from different types of tissues of cells." Nucleic Acids Res 10(8): 2709-21.
Ernst, J. and M. Kellis (2010). "Discovery and characterization of chromatin states for systematic annotation of the human genome." Nature Biotechnology 28(8): 817-825.
Feng, S., S. J. Cokus, et al. (2010). "Conservation and divergence of methylation patterning in plants and animals." Proc Natl Acad Sci U S A 107(19): 8689-94.
Feng, S., S. E. Jacobsen, et al. (2010). "Epigenetic reprogramming in plant and animal development." Science (New York, N.Y.) 330(6004): 622-627.
Fleury, D., K. Himanen, et al. (2007). "The Arabidopsis thaliana homolog of yeast BRE1 has a function in cell cycle regulation during early leaf and root growth." The Plant Cell 19(2): 417-432.
Formosa, T. (2008). "FACT and the reorganized nucleosome." Molecular bioSystems 4(11): 1085-1093. Fransz, P., W. Soppe, et al. (2003). "Heterochromatin in interphase nuclei of Arabidopsis thaliana."
Chromosome Research: An International Journal on the Molecular, Supramolecular and Evolutionary Aspects of Chromosome Biology 11(3): 227-240.
Frappier, L. and C. P. Verrijzer (2011). "Gene expression control by protein deubiquitinases." Current Opinion in Genetics & Development 21(2): 207-213.
Fujimoto, R., Y. Kinoshita, et al. (2008). "Evolution and Control of Imprinted FWA Genes in the Genus Arabidopsis." PLoS Genet 4(4): e1000048.
Gabriel, A., J. Dapprich, et al. (2006). "Global Mapping of Transposon Location." PLoS Genet 2(12): e212. Gehring, M., K. L. Bubb, et al. (2009). "Extensive demethylation of repetitive elements during seed
development underlies gene imprinting." Science 324(5933): 1447-51.
Gerstein, M. B., Z. J. Lu, et al. (2010). "Integrative analysis of the Caenorhabditis elegans genome by the modENCODE project." Science (New York, N.Y.) 330(6012): 1775-1787.
Goll, M. G. and T. H. Bestor (2005). "Eukaryotic cytosine methyltransferases." Annu Rev Biochem 74: 481-514.
Gu, X., D. Jiang, et al. (2009). "Repression of the floral transition via histone H2B monoubiquitination." The Plant Journal: For Cell and Molecular Biology 57(3): 522-533.
He, Y. (2009). "Control of the transition to flowering by chromatin modifications." Molecular Plant 2(4): 554-564.
Henry, K. W., A. Wyce, et al. (2003). "Transcriptional activation via sequential histone H2B ubiquitylation and deubiquitylation, mediated by SAGA-associated Ubp8." Genes & Development 17(21): 2648-2663.
Hon, G., W. Wang, et al. (2009). "Discovery and annotation of functional chromatin signatures in the human genome." PLoS Computational Biology 5(11): e1000566.
Howman, E. V., K. J. Fowler, et al. (2000). "Early disruption of centromeric chromatin organization in centromere protein A (Cenpa) null mice." Proceedings of the National Academy of Sciences of the United States of America 97(3): 1148-1153.
Hsieh, T. F., C. A. Ibarra, et al. (2009). "Genome-wide demethylation of Arabidopsis endosperm." Science 324(5933): 1451-4.
Husband, B. C. (2004). "Chromosomal variation in plant evolution." American Journal of Botany 91(4): 621 -625.
Hwang, W. W., S. Venkatasubrahmanyam, et al. (2003). "A conserved RING finger protein required for histone H2B monoubiquitination and cell size control." Molecular Cell 11(1): 261-266.
Iqbal, K., S. G. Jin, et al. (2011). "Reprogramming of the paternal genome upon fertilization involves genome-wide oxidation of 5-methylcytosine." Proc Natl Acad Sci U S A 108(9): 3642-7.
Jamai, A., A. Puglisi, et al. (2009). "Histone chaperone spt16 promotes redeposition of the original h3-h4 histones evicted by elongating RNA polymerase." Molecular Cell 35(3): 377-383.
Jenuwein, T. and C. D. Allis (2001). "Translating the Histone Code." Science 293(5532): 1074 -1080. Ji, H., H. Jiang, et al. (2008). "An integrated software system for analyzing ChIP-chip and ChIP-seq data."
Nature Biotechnology 26(11): 1293-1300.
Ji, H. and W. H. Wong (2005). "TileMap: create chromosomal map of tiling array hybridizations." Bioinformatics (Oxford, England) 21(18): 3629-3636.
Jiang, D., X. Gu, et al. (2009). "Establishment of the winter-annual growth habit via FRIGIDA-mediated histone methylation at FLOWERING LOCUS C in Arabidopsis." The Plant Cell 21(6): 1733-1746. Jiang, D., N. C. Kong, et al. (2011). "Arabidopsis COMPASS-like complexes mediate histone H3 lysine-4
trimethylation to control floral transition and plant development." PLoS Genetics 7(3): e1001330.
Jiang, H. and W. H. Wong (2008). "SeqMap: mapping massive amount of oligonucleotides to the genome." Bioinformatics (Oxford, England) 24(20): 2395-2396.
Jiao, Y., L. Ma, et al. (2005). "Conservation and divergence of light-regulated genome expression patterns during seedling development in rice and Arabidopsis." The Plant Cell 17(12): 3239-3256.
Johnson, L. M., M. Bostick, et al. (2007). "The SRA methyl-cytosine-binding domain links DNA and histone methylation." Curr Biol 17(4): 379-84.
Jones, P. A. (1999). "The DNA methylation paradox." Trends Genet 15(1): 34-7.
Jones, P. A. and G. Liang (2009). "Rethinking how DNA methylation patterns are maintained." Nat Rev Genet 10(11): 805-11.
Kao, C.-F., C. Hillyer, et al. (2004). "Rad6 plays a role in transcriptional activation through ubiquitylation of histone H2B." Genes & Development 18(2): 184-195.
Kato, M., K. Takashima, et al. (2004). "Epigenetic control of CACTA transposon mobility in Arabidopsis thaliana." Genetics 168(2): 961-969.
Kent, W. J. (2002). "BLAT--the BLAST-like alignment tool." Genome Res 12(4): 656-64.
Kharchenko, P. V., A. A. Alekseyenko, et al. (2011). "Comprehensive analysis of the chromatin landscape in Drosophila melanogaster." Nature 471(7339): 480-5.