HAL Id: hal-02263107
https://hal.archives-ouvertes.fr/hal-02263107
Preprint submitted on 2 Aug 2019
HAL is a multi-disciplinary open access archive for the deposit and dissemination of sci-entific research documents, whether they are pub-lished or not. The documents may come from teaching and research institutions in France or abroad, or from public or private research centers.
L’archive ouverte pluridisciplinaire HAL, est destinée au dépôt et à la diffusion de documents scientifiques de niveau recherche, publiés ou non, émanant des établissements d’enseignement et de recherche français ou étrangers, des laboratoires publics ou privés.
Distributed under a Creative Commons Attribution - NonCommercial - NoDerivatives| 4.0 International License
In vivo phosphatidylserine variations steer Rho GTPase
signaling in a cell-context dependent manner
Matthieu Platre, Vincent Bayle, Laia Armengot, Joseph Bareille, Maria Mar
Marques-Bueno, Audrey Creff, Lilly Maneta-Peyret, Jean-Bernard Fiche,
Marcelo Nollmann, Christine Miege, et al.
To cite this version:
Matthieu Platre, Vincent Bayle, Laia Armengot, Joseph Bareille, Maria Mar Marques-Bueno, et al.. In vivo phosphatidylserine variations steer Rho GTPase signaling in a cell-context dependent manner. 2018. �hal-02263107�
1
Title:
In vivo phosphatidylserine variations steer Rho GTPase signaling in a
cell-context dependent manner
Authors: Matthieu Pierre Platre1, Vincent Bayle1, Laia Armengot1, Joseph Bareille1, Maria Mar Marques-Bueno1, Audrey Creff1, Lilly Maneta-Peyret2, Jean-Bernard Fiche3, Marcelo Nolmann3,
Christine Miège1, Patrick Moreau2,4, Alexandre Martinière5 and Yvon Jaillais1*
Affiliations:
1Laboratoire Reproduction et Développement des Plantes, Université de Lyon, ENS de Lyon,
UCB Lyon 1, CNRS, INRA, F-69342 Lyon, France.
2UMR 5200 Membrane Biogenesis Laboratory, CNRS-University of Bordeaux, Bâtiment A3 -
INRA Bordeaux Aquitaine, 71 Avenue Edouard Bourlaux- CS 20032, 33140 Villenave d’Ornon, France.
3Centre de Biochimie Structurale, CNRS UMR5048, INSERM U1054, Université de
Montpellier, 29 Rue de Navacelles, 34090, Montpellier, France
4Bordeaux Imaging Center, UMS 3420 CNRS, US4 INSERM, University of Bordeaux, 33000
Bordeaux, France.
5BPMP, CNRS, INRA, Montpellier SupAgro, Univ Montpellier, Montpellier, France
*Correspondence to: [email protected]
Abstract:
Rho GTPases are master regulators of cell signaling, but how they are regulated depending on the cellular context is unclear. Here, we show that the phospholipid phosphatidylserine acts as a developmentally-controlled lipid rheostat that tunes Rho GTPase signaling in Arabidopsis. Live super-resolution single molecule imaging revealed that RHO-OF-PLANT6 (ROP6) is stabilized by phosphatidylserine into plasma membrane (PM) nanodomains, which is required for auxin signaling. Furthermore, we uncovered that the PM phosphatidylserine content varies during plant root development and that the level of phosphatidylserine modulates the quantity of ROP6 nanoclusters induced by auxin and hence downstream signaling, including regulation of endocytosis and gravitropism. Our work reveals that variations in phosphatidylserine levels are a physiological process that may be leveraged to regulate small GTPase signaling during development.
One Sentence Summary:
Phosphatidylserine acts as a developmentally-controlled lipid rheostat that regulates cellular auxin sensitivity and plant development.
2 Main Text:
Proteins from the Rho/Ras superfamily are small GTPases that regulate fundamental eukaryotic functions, including cell signaling, cell polarity, intracellular trafficking and cytoskeleton dynamics (1, 2). Furthermore, they control the morphology and behavior of cells and organisms by integrating signaling pathways at the cell surface into various cellular outputs. The small GTPase paradigm stipulates that they are in an “inactive” form when bound to GDP, and in an “active” form when bound to GTP. However, emerging evidence suggest that this view is likely oversimplified, since their membrane environment also dictates the signaling capacity of these GTPases (2, 3). In particular, Ras/Rho signaling is intimately linked with membrane lipids in all eukaryotes. Interaction with anionic lipids is important for their plasma membrane (PM) targeting (4, 5), but also mediates the clustering of these small GTPases at the cell surface into nanometer scale membrane domains (6-8). Phosphoinositides are low abundant anionic phospholipids that can be acutely produced or metabolized by dedicated enzymes with exquisite subcellular precision, and as such often function as signaling lipids (9). Moreover, they mediate the recruitment of some Ras/Rho proteins to the cell surface and into nanoclusters (4, 7, 10). Phosphatidylserine (PS) is also involved in the nanoclustering and signaling of some GTPase, such as K-Ras in human and Cdc42 in yeast (3, 6, 8, 11-13). However, by contrast to phosphoinositides, PS is a relatively abundant anionic phospholipid, representing up to 10-20% of the total phospholipids at the PM inner leaflet (14). In addition, PS is not constantly modified by specialized metabolizing enzymes and the subcellular PS repartition is thought to be relatively stable across cell types (14). Therefore, PS appears to be a structural component of the membrane, which is required for K-Ras/Cdc42 nanoclustering. It is unknown, however, whether PS also has a regulatory role in vivo in modulating nanocluster formation and subsequent signaling. In other words, is PS function in GTPase nanoclustering rate limiting? And if yes, are PS levels regulated during development and what are the consequences of such changes on small GTPases signaling capacity? Here, we addressed these questions using the Arabidopsis thaliana root as a model system, because it is a genetically tractable multicellular organ, with a variety of cell types and cell differentiation states and amenable to live imaging, including super-resolution microscopy (15).
In plants, there is a single protein family in the Ras/Rho GTPase superclade, called ROP for RHO-OF-PLANT(16). ROPs are master regulators of cell polarity and cell morphogenesis, but they also sit at the nexus of plant hormone signaling (including auxin and abscisic acid), cell wall sensing pathways and receptor-like kinase signaling (involved in development, reproduction and immunity) (16-27). Here, we show that auxin triggers ROP6 nanoclustering within minutes, in a PS dependent manner. Furthermore, we found that PS is required for ROP6 signaling, and variations in the cellular PS content directly impact the quantity of ROP6 nanoclusters and thereby subsequent downstream auxin signaling, including the regulation of endocytosis and root gravitropism. Therefore, PS is not a mere structural component of the membrane, it is a bona fide signaling lipid that acts as a developmentally-controlled lipid rheostat to regulate small GTPases in a cell-context dependent manner.
.
CC-BY-NC-ND 4.0 International license
It is made available under a
3 Results and discussion
Plasma membrane phosphatidylserine levels vary during root cell differentiation.
Phosphatidylserine (PS) is an anionic phospholipid that partitions between the cytosolic leaflets of the PM and endosomes (28). Bulk PS measurement in Arabidopsis thaliana suggested that the relative PS concentration can vary in vivo depending on the organ (29). In order to get tissue and cellular resolution on the PS distribution, we recently validated the use of two PS reporters in Arabidopsis (28, 30), the PS-binding C2 domain of Lactadherin (C2Lact) (5) and the PH domain of
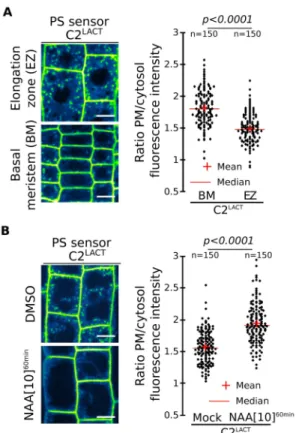
EVECTIN2 (2xPHEVCT2) (31). In both cases, the proportion of PS sensors was markedly more pronounced at the PM than endosomes in the root basal meristem compared to cells in the elongation zone (Fig. 1A, Fig. S1A-B). This developmental gradient appeared to be in part regulated by the plant hormone auxin as relatively short treatment (60min) with the synthetic auxin naphthalene-1-acetic acid (NAA) increased the level of both PS sensors at the PM at the expense of their endosomal localization in the elongation zone (Fig. 1B, Fig. S1C). Therefore, not only the overall PS level vary depending on the organ but there are also local variations of the PS content at the PM within an organ, during cell differentiation and in response to hormonal cues.
Graded phosphatidylserine levels tune ROP6 signaling.
In order to test the potential impact of PS variations during development, we experimentally manipulated the plant PS content, from no PS biosynthesis in the phosphatidylserine synthase1 (pss1) mutant (28), to mild PS levels in transgenic lines expressing artificial microRNAs against
PSS1 (amiPSS1), and high PS levels in transgenic lines overexpressing PSS1 (PSS1-OX) (Fig. S1D-E). The changes in PS content measured in amiPSS1 and PSS1-OX lines of about ±2-fold fell well into the physiological range, since PS levels in Arabidopsis vary about 5-fold between roots and leaves tissues (29). The pss1 mutant showed defects in root gravitropism (Fig. S1F-G). Quantitative analyses of root bending following gravistimulation (Fig. S1H) revealed that the
pss1-3 mutant had no gravitropic response (Fig. 2A), amiPSS1 lines had an attenuated response, while
PSS1-OX lines were hypergravitropic (Fig. 2B). These opposite gravitropic phenotypes of PSS1 loss- and gain-of-function resembled those of ROP6, a Rho-Of-Plant (ROP) GTPase, which is activated by auxin and regulates root gravitropism (21, 22). Like PSS1-OX lines, lines overexpressing either ROP6 (ROP6-OX) or constitutive active GTP-lock ROP6 (ROP6CA) showed
Figure 1. Plasma membrane phosphatidylserine levels vary during root cell differentiation. A,
Confocal images of mCIT-C2LACT root epidermis in
basal meristem (BM) and elongation zone (EZ) and related quantification. Confocal images of mCIT-C2LACT root epidermis in the absence/presence of
NAA (10µM, 60min) and related quantification. Scale bars 10µm. n represents the number of cells, letters indicate statistical differences (see methods for details on statistical tests).
4
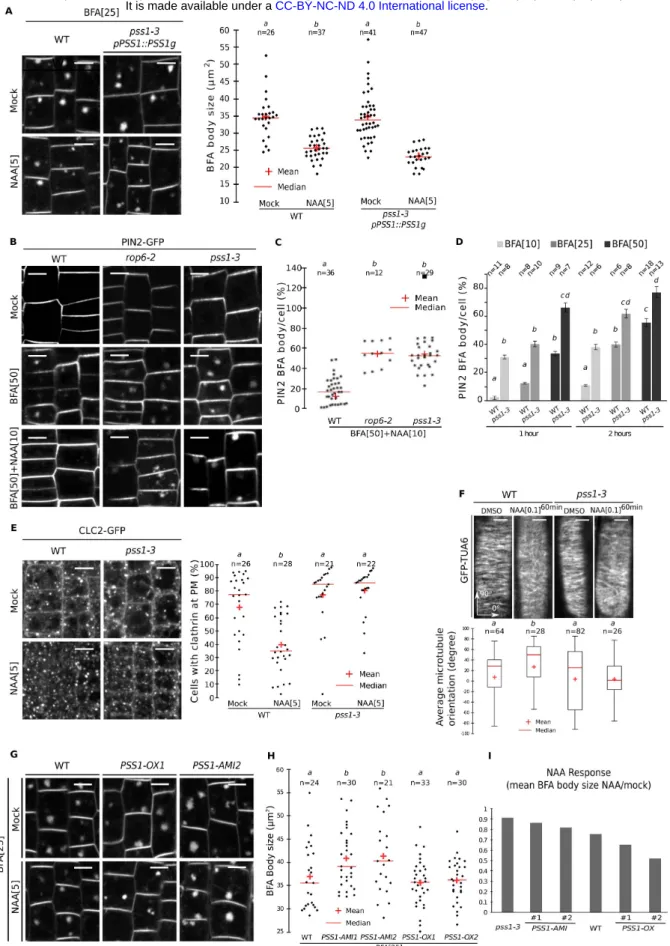
a hypergravitropic phenotypes, which were abolished in a pss1-3 background (Fig 2A). During root gravitropism, ROP6 acts downstream of auxin to inhibit endocytosis and regulate microtubule orientation (21, 22, 32, 33). Similar to rop6 (21, 22, 32), we observed that in pss1-3: i) FM4-64 and PIN2-GFP uptake in the presence of BrefeldinA (BFA) was increased (Fig. 2C, Fig. S2A-D), ii) auxin failed to inhibit FM4-64 and PIN2-GFP endocytosis (Fig. 2C, Fig. S2A-D), iii) CLATHRIN-LIGHT-CHAIN2 (CLC2)-GFP PM association was insensitive to auxin treatment (Fig. S2E), and iv) auxin-triggered microtubule reorientation was abolished (Fig. S2F). FM4-64 uptake in pss1-3xROP6CA was identical to that of pss1-3 single mutant and opposite to ROP6CA (Fig. 2C), showing that PSS1 is required for ROP6-mediated inhibition of endocytosis. Furthermore, transgenic lines with low PS content (amiPSS1) had decreased auxin-mediated inhibition of endocytosis, while lines with heightened-PS content (PSS1-OX) mimicked ROP6CA phenotypes with pronounced inhibition of endocytosis upon auxin treatment (Fig. 2D, Fig. S2G-I). Together, our analyses suggest that i) PS is required for auxin-mediated ROP6 signaling during root gravitropism and ii) PS levels impact the strength of ROP6 signaling output in a dose-dependent manner.
Figure 2. Variation in phosphatidylserine concentration tunes ROP6 signalling. A-B,
Quantification of root bending after gravistimulation (mean +/- sem). C-D, Confocal images of FM4-64 staining in root epidermis (BFA: 25µM; NAA: 5µM), and related quantification. Scale bars 10µm. n represents the number of roots analysed, letters indicate statistical differences (see methods for details on statistical tests).
.
CC-BY-NC-ND 4.0 International license
It is made available under a
5
Auxin triggers ROP6 nanoclustering at the plasma membrane.
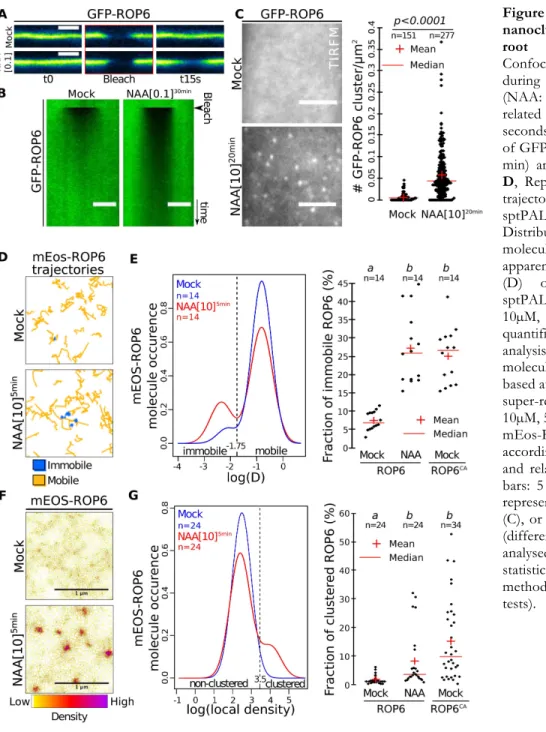
PS and ROP6 both accumulate at the PM, we therefore reasoned that PS may contribute to ROP6 localization. Surprisingly, GFP-ROP6 localization, as seen by confocal microscopy, was almost identical in pss1-3 and WT, being mainly at the PM and only faintly delocalized in intracellular compartments in pss1-3 (Fig. S3A). In leaves, ROP6CA was previously shown to be confined in membrane domains (34), raising the possibility that PS could contribute to ROP6 signaling by regulating its lateral segregation at the PM. To analyze ROP6 PM partitioning in root cells and in the context of auxin response, we developed several microscopy-based assays, including Fluorescence Recovery After Photobleaching (FRAP), Total Internal Reflection Fluorescence Microscopy (TIRFM) (35) and PhotoActivated Localization Microscopy (PALM) (15) (Fig. S4). As shown for ROP6CA in leaf (34), activation of ROP6 (here using auxin treatment) delayed GFP-ROP6 fluorescence recovery after photobleaching (Fig. 3A-B and Fig. S3B-D). TIRFM on root tip epidermal cells allowed to focus only on the plane of the PM with a 100nm axial resolution (35) (Fig. S4B) and revealed that GFP-ROP6 mostly localized uniformly at the PM (Fig. 3C). By contrast, in auxin-treated plants, GFP-ROP6 additionally resided in diffraction-limited spots present in the plane of the PM (Fig. 3C), suggesting that auxin treatment triggers the clustering of ROP6 in membrane domains. By using stochastic photoswitching on live roots, single particle tracking PALM (sptPALM) experiments provided tracks of single molecule localization through time, and therefore allowed us to analyze the diffusion behavior of single ROP6 molecule in response to auxin (Fig. S4D). While mEos-ROP6 molecules in the untreated condition were almost exclusively diffusing, ROP6 molecules in plants treated for 5 minutes with auxin (or mEos-ROP6CA molecules) existed in two states at the PM of epidermal cells: immobile or diffusing (Fig.
3D-E, Fig. S5A-C and Supplementary Video 1). Clustering analyses on live PALM images (36,
37) showed that auxin triggered the clustering of mEos-ROP6 in PM-nanodomains of about 50 to
70 nm wide (Fig. 3F-G and Fig. S6). Together, our data indicate that activation, either genetically (i.e. ROP6CA) or by an endogenous activator (i.e. auxin), triggers ROP6 recruitment, immobilization and stabilization into PM-nanodomains and that these events happen minutes following auxin treatment.
6
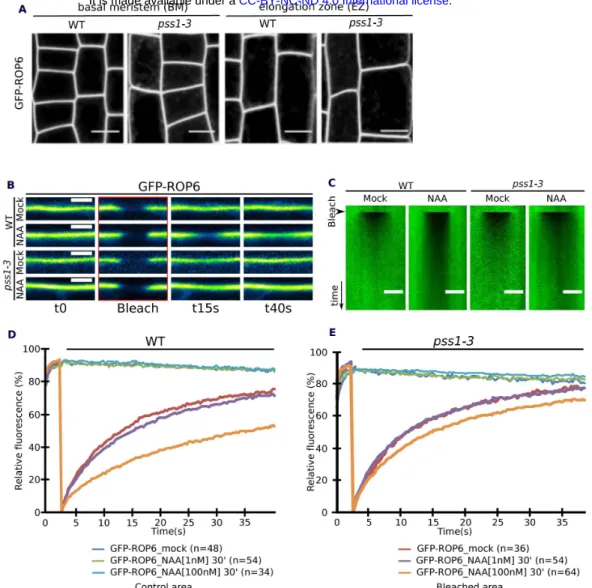
Figure 3. Auxin triggers ROP6 nanoclustering at the PM of root epidermal cells. A,
Confocal images of GFP-ROP6 during FRAP experiments (NAA: 100nM, 30 min), B, related kymograph (time scale 9 seconds). C, TIRFM micrograph of GFP-ROP6 (NAA: 10µM, 20 min) and related quantification.
D, Representative mEos-ROP6
trajectories obtained by sptPALM analyses. E,
Distribution of mEos-ROP6 molecules according to their apparent diffusion coefficient (D) obtained by analysing sptPALM trajectories (NAA: 10µM, 5 min), and related quantification. F, Live PALM analysis of mEos-ROP6 molecules density by tessellation-based automatic segmentation of super-resolution images (NAA: 10µM, 5 min). G, Distribution of mEos-ROP6 molecules according to their local density and related quantification. Scale bars: 5 µm (A-C), 1 µm (F). n represents the number of ROIs (C), or independent acquisitions (different cells) (E and G) analysed, letters indicate statistical difference (see methods for details on statistical tests).
PS regulates auxin-induced ROP6 nanoclustering in a dose-dependent manner.
Next, we tested the impact of PS on ROP6 PM dynamics. In FRAP experiments, GFP-ROP6 sensitivity to auxin was reduced in pss1-3 (Fig. 4A and Fig. S3B-E), suggesting that PS is critical for the immobilization of ROP6 by auxin. In WT plants, NAA-induced GFP-ROP6 presence in PM-nanodomains was more pronounced in the basal meristem than in the elongation zone in TIRFM experiments (Fig. 4B), which correlated with the observed differential presence of PS content at the PM in these regions (Fig. 1A). To analyze whether this differential auxin sensitivity was dependent on the amount of PS present in these cells, we performed PS loss- and gain-of-function experiments. First, auxin failed to induce GFP-ROP6 nanodomains in both region of the root in pss1-3 (Fig. 4C), suggesting that PS is indeed required for auxin-triggered ROP6
.
CC-BY-NC-ND 4.0 International license
It is made available under a
7
nanoclustering. Second, exogenous treatment with lysophosphatidylserine (lyso-PS), a more soluble lipid than PS but with an identical head group (28), boosted the number of auxin-induced GFP-ROP6 nanodomains observed in TIRFM in WT plants (Fig. 4D). Together these data suggest that the quantity of PS at the PM impacts ROP6 nanoclustering. While PS was required for auxin-triggered ROP6 nanoclustering, a certain amount of ROP6 was still found in PM domains in pss1, independent of the presence of auxin (Fig. 4C). Kymograph analyses revealed that ROP6-containing PM-nanodomains observed by TIRFM were immobile in both WT and pss1-3 (Fig. 4E). Photobleaching experiments showed that GFP-ROP6 was highly stable in these PM-nanodomains in the WT (i.e. no fluorescence recovery of GFP-ROP6 in PM-PM-nanodomains, by contrast to a fast recovery of fluorescence outside of these domains) (Fig. 4E and Supplementary Video 2). By contrast, GFP-ROP6 fluorescence in PM-nanodomains was rapidly recovered in
pss1-3, suggesting that ROP6 was not stabilized into PM-nanodomains in the absence of PS (Fig. 4E and Supplementary Video 3). Together, our results show that PS is necessary for both ROP6 stabilization into PM-nanodomains and downstream ROP6 signaling, including regulation of endocytosis and root gravitropism.
Figure 4. Phosphatidyserine is necessary for auxin-induced stabilization of ROP6 into PM-nanodomains. A,
Quantification of FRAP experiments in WT and pss1-3 root epidermal cells (NAA: 1nM and 100nM, 30 min). B-C, Quantification of TIRFM experiment in WT and pss1-3 root epidermal cells (NAA, 10µM, 20 min) in basal meristem (BM) and elongation zone (EZ) (data are the same as in Fig3C but split into its respective zone). D, Quantification of TIRFM experiment in the presence or absence of lyso-PS in the meristematic region (NAA: 10µM, 20min). E, Kymograph of GFP-ROP6 localization obtained by TIRFM, (time scale 12 seconds) with images of a single GFP-ROP6 nanocluster (9s interval) and related quantification. Scale bars: 5µm. n represents the number of ROIs (A-D), or GFP-ROP6 nanodomains (E) analysed, letters indicates statistical difference (see methods for details on statistical tests).
8
Immobile phosphatidylserine molecules accumulate in PM-nanodomains together with ROP6.
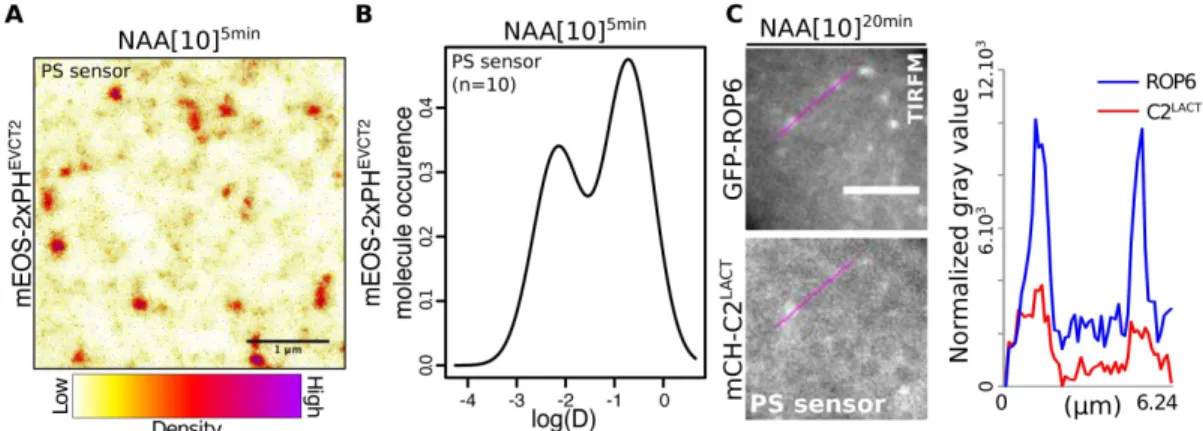
Next, we addressed whether the regulation of ROP6 clustering and signaling by PS was direct. If so, we should expect PS, like ROP6, to also localize in PM-nanodomains. Using sptPALM and clustering analyses, we found that i) the PS reporter mEos-2xPHEVCT2 segregated into nanodomains at the PM of root epidermal cells (Fig. 5A) and ii) about 35% of mEos-2xPHEVCT2 molecules were present as a slow-diffusible population (Fig. 5B and Fig S5D), showing an apparent diffusion coefficient similar to that of immobile mEos-ROP6 (Fig. 3E) and suggesting that PS and ROP6 may co-exist in the same PM-nanodomains. Accordingly, co-visualization of GFP-ROP6 and the PS sensor 2xmCHERRY-C2Lact in TIRFM confirmed that they at least partially reside in the same PM-nanodomains in response to auxin (Fig. 5C).
Figure 5. Phosphatidylserine concentrates in nanoclusters at the PM. A, live PALM analysis of mEos-2xPHEVCT2
localization (NAA, 10µM, 5 min) in root epidermal cells and B, distribution of mEos-2xPHEVCT2 molecules according to
their diffusion. C, TIRFM micrograph of root cells co-expressing GFP-ROP6 with the PS marker 2xmCH-C2LACT (NAA:
10µM, 20 min) and line scan of fluorescence intensities. Scale bars 1µm (A), 5µm (C). n represents the number of acquisitions (independent cells) (B), letter indicates statistical difference (see methods for details on statistical tests).
ROP6 interaction with anionic phospholipids is required for nanoclustering and downstream signaling.
ROP6 possess in its C-terminus a polybasic region adjacent to a prenylation site (Fig. S7A). Such polybasic region is anticipated to bind to anionic phospholipids, including PS, via non-specific electrostatic interactions (4, 5), which we confirmed in protein-lipid overlay experiments (Fig. S7B). Substitution of seven lysines into neutral glutamines in ROP6 C-terminus (ROP67Q) abolished in vitro interactions with all anionic lipids (Fig. S7B). In planta, diminishing the net positive charges of ROP6 C-terminus (ROP67Q) or the net negative charge of the PM gradually
induced ROP6 mislocalization into intracellular compartments (Fig. S7C-D). To test the functionality of ROP67Q at the PM, we selected transgenic lines that had strong expression level to compensate for their intracellular localization and therefore have comparable levels of ROP67Q and ROP6WT at the PM (Fig. S8A and D-F).ROP67Q mutants were not functional in planta (Fig. 6A-B, Fig. S8B-C), even though the 7Q mutations had no impact on ROP6 intrinsic GTPase activity in vitro and ROP6-GTP conformation in vivo (Fig. S9). We next analyzed the dynamics of mEos-ROP67Q at the PM of wild-type roots by sptPALM experiments and found that it had the
same proportion of immobile molecules than mEos-ROP6WT in pss1-3, and that in both cases they were insensitive to auxin (Fig. 6C, Fig. S5E-H). Therefore, impairing PS/ROP6 interaction by
.
CC-BY-NC-ND 4.0 International license
It is made available under a
9
either removing PS from the membranes (pss1 mutant), or by mutating the anionic lipid-binding site on ROP6 (ROP67Q) similarly impacted ROP6 signaling and its auxin-induced nanoclustering.
Figure 6. ROP6 nanoclustering in response to auxin requires direct interaction with anionic phospholipids. A-B, Quantification of (A) root bending after gravistimulation and (B) the size of FM4-64-stained BFA bodies (data in WT
are the same as in Figure 2C). C, Distribution of mEos-ROP6 molecules in pss1-3 (left) and mEos-ROP67Q molecules in
WT (right) roots according to their apparent diffusion coefficient obtained by analysing sptPALM trajectories (NAA: 10µM, 5 min), and related quantification. n represents the number of roots (A, B) or acquisitions (independent cells) (C) analysed, letter indicates statistical difference (see methods for details on statistical tests).
Conclusions.
Here, we showed that in root tip epidermal cells: i) ROP6 is immobilized in PM-nanodomains upon activation by auxin, ii) PS is necessary for both ROP6 stabilization into PM-nanodomains and signaling, iii) ROP6 directly interacts with anionic lipids, including PS, and iv) PS itself is present and immobile in these PM-nanodomains, suggesting that stabilized ROP6 in PS-containing nanoclusters constitutes the functional signaling unit of this GTPase. Our imaging pipeline revealed that ROP6 nano-organization is rapidly remodeled by auxin and as such will provide a quantitative in vivo read-out to re-evaluate how auxin may be perceived upstream of ROP6 activation. Given that plants have 11 ROPs, which can respond to a wide range of signals (16), it will be intriguing to address whether nanoclustering is specific to auxin response or common to other signals and to various ROPs, and to what extent it may contribute to signal integration by plant Rho GTPases. All ROP proteins have polybasic clusters at their C-terminus (Fig. S10A), and PS could therefore potentially regulate additional member of this family. Interestingly, in addition to root gravitropic defects, pss1 had many developmental phenotypes that may be linked to altered
10
ROP function (e.g. pavement cell and root hair morphology, planar polarity defects, see Fig. S10B-F) but that are not found in rop6 single mutant and could therefore involve additional ROP proteins. Furthermore, nanoclustering seems to be a shared feature of several yeast and animal small GTPases, including K-Ras, Rac1 and Cdc42 (6-8), and both K-Ras and Cdc42 require PS for nanoclustering (3, 6, 8, 11, 13). Here, we found that in vivo variations of the PS concentration at the PM act like a rheostat to adjust the sensitivity of ROP6-nanoclustering and hence auxin signaling in a cell-context dependent manner. Our results open the possibility that variations of the PS concentration at the PM in animal systems could also control the signaling capacity of these small GTPases during either normal or pathological development.
References:
1. S. Etienne-Manneville, A. Hall, Rho GTPases in cell biology. Nature 420, 629-635 (2002).
2. J. F. Hancock, Ras proteins: different signals from different locations. Nature reviews.
Molecular cell biology 4, 373-384 (2003).
3. Y. Zhou, J. F. Hancock, Deciphering lipid codes: K-Ras as a paradigm. Traffic 19, 157-165 (2018).
4. W. D. Heo et al., PI(3,4,5)P3 and PI(4,5)P2 lipids target proteins with polybasic clusters to the plasma membrane. Science 314, 1458-1461 (2006).
5. T. Yeung et al., Membrane phosphatidylserine regulates surface charge and protein localization. Science 319, 210-213 (2008).
6. Y. Zhou et al., Lipid-Sorting Specificity Encoded in K-Ras Membrane Anchor Regulates Signal Output. Cell 168, 239-251 e216 (2017).
7. A. Remorino et al., Gradients of Rac1 Nanoclusters Support Spatial Patterns of Rac1 Signaling. Cell reports 21, 1922-1935 (2017).
8. E. Sartorel et al., Phosphatidylserine and GTPase activation control Cdc42 nanoclustering to counter dissipative diffusion. Molecular biology of the cell, mbcE18010051 (2018).
9. L. C. Noack, Y. Jaillais, Precision targeting by phosphoinoistides: how PIs direct endomembrane trafficking in plants. . Current opinion in plant biology 40, (2017). 10. G. van den Bogaart et al., Membrane protein sequestering by ionic protein-lipid
interactions. Nature 479, 552-555 (2011).
11. Y. Zhou et al., SIGNAL TRANSDUCTION. Membrane potential modulates plasma membrane phospholipid dynamics and K-Ras signaling. Science 349, 873-876 (2015). 12. K. J. Cho et al., Inhibition of Acid Sphingomyelinase Depletes Cellular
Phosphatidylserine and Mislocalizes K-Ras from the Plasma Membrane. Molecular and
cellular biology 36, 363-374 (2015).
13. D. van der Hoeven et al., Fendiline inhibits K-Ras plasma membrane localization and blocks K-Ras signal transmission. Molecular and cellular biology 33, 237-251 (2013). 14. P. A. Leventis, S. Grinstein, The distribution and function of phosphatidylserine in
cellular membranes. Annual review of biophysics 39, 407-427 (2010).
15. E. Hosy, A. Martiniere, D. Choquet, C. Maurel, D. T. Luu, Super-resolved and dynamic imaging of membrane proteins in plant cells reveal contrasting kinetic profiles and multiple confinement mechanisms. Molecular plant 8, 339-342 (2015).
16. K. N. Miyawaki, Z. Yang, Extracellular signals and receptor-like kinases regulating ROP GTPases in plants. Frontiers in plant science 5, 449 (2014).
.
CC-BY-NC-ND 4.0 International license
It is made available under a
11
17. H. M. Wu, O. Hazak, A. Y. Cheung, S. Yalovsky, RAC/ROP GTPases and auxin signaling. The Plant cell 23, 1208-1218 (2011).
18. L. Z. Tao, A. Y. Cheung, H. M. Wu, Plant Rac-like GTPases are activated by auxin and mediate auxin-responsive gene expression. The Plant cell 14, 2745-2760 (2002).
19. T. Xu et al., Cell surface- and rho GTPase-based auxin signaling controls cellular interdigitation in Arabidopsis. Cell 143, 99-110 (2010).
20. Q. Duan, D. Kita, C. Li, A. Y. Cheung, H. M. Wu, FERONIA receptor-like kinase regulates RHO GTPase signaling of root hair development. Proceedings of the National
Academy of Sciences of the United States of America 107, 17821-17826 (2010).
21. X. Chen et al., ABP1 and ROP6 GTPase signaling regulate clathrin-mediated endocytosis in Arabidopsis roots. Current biology : CB 22, 1326-1332 (2012).
22. D. Lin et al., A ROP GTPase-dependent auxin signaling pathway regulates the subcellular distribution of PIN2 in Arabidopsis roots. Current biology : CB 22, 1319-1325 (2012).
23. A. Akamatsu et al., An OsCEBiP/OsCERK1-OsRacGEF1-OsRac1 module is an essential early component of chitin-induced rice immunity. Cell host & microbe 13, 465-476 (2013).
24. M. Sassi et al., An auxin-mediated shift toward growth isotropy promotes organ formation at the shoot meristem in Arabidopsis. Current biology : CB 24, 2335-2342 (2014).
25. T. Xu et al., Cell surface ABP1-TMK auxin-sensing complex activates ROP GTPase signaling. Science 343, 1025-1028 (2014).
26. Z. Li, R. Waadt, J. I. Schroeder, Release of GTP Exchange Factor Mediated Down-Regulation of Abscisic Acid Signal Transduction through ABA-Induced Rapid Degradation of RopGEFs. PLoS biology 14, e1002461 (2016).
27. L. Poraty-Gavra et al., The Arabidopsis Rho of plants GTPase AtROP6 functions in developmental and pathogen response pathways. Plant physiology 161, 1172-1188 (2013).
28. M. P. Platre et al., A Combinatorial Lipid Code Shapes the Electrostatic Landscape of Plant Endomembranes. Developmental cell 45, 465-480 e411 (2018).
29. Y. Yamaoka et al., PHOSPHATIDYLSERINE SYNTHASE1 is required for microspore development in Arabidopsis thaliana. The Plant journal : for cell and molecular biology
67, 648-661 (2011).
30. M. L. Simon et al., A PtdIns(4)P-driven electrostatic field controls cell membrane identity and signalling in plants. Nat Plants 2, 16089 (2016).
31. Y. Uchida et al., Intracellular phosphatidylserine is essential for retrograde membrane traffic through endosomes. Proceedings of the National Academy of Sciences of the
United States of America 108, 15846-15851 (2011).
32. X. Chen et al., Inhibition of cell expansion by rapid ABP1-mediated auxin effect on microtubules. Nature 516, 90-93 (2014).
33. T. Paciorek et al., Auxin inhibits endocytosis and promotes its own efflux from cells.
Nature 435, 1251-1256 (2005).
34. N. Sorek et al., An S-acylation switch of conserved G domain cysteines is required for polarity signaling by ROP GTPases. Current biology : CB 20, 914-920 (2010).
35. A. Johnson, G. Vert, Single Event Resolution of Plant Plasma Membrane Protein Endocytosis by TIRF Microscopy. Frontiers in plant science 8, 612 (2017).
12
36. J. Gronnier et al., Structural basis for plant plasma membrane protein dynamics and organization into functional nanodomains. eLife 6, (2017).
37. F. Levet et al., SR-Tesseler: a method to segment and quantify localization-based super-resolution microscopy data. Nature methods 12, 1065-1071 (2015).
Acknowledgments: We thank M. Dreux, E. Bayer, O. Hamant, S. Mongrand, Y. Boutté, J.
Gronnier, J. Reed, T. Vernoux and the SiCE group for discussions and comments, T. Stanislas for help with root hair phenotyping, S. Bednarek, S. Yalovsky, B. Scheres and the NASC collection for providing transgenic Arabidopsis lines, A. Lacroix, J. Berger and P. Bolland for plant care, J.C. Mulatier for help in preparing lipids. We acknowledge the contribution of SFR Biosciences (UMS3444/CNRS, US8/Inserm, ENS de Lyon, UCBL) facilities: C. Lionet, E. Chattre, and C. Chamot at the LBI-PLATIM-MICROSCOPY for assistance with imaging and V. Guegen-Chaignon at the Protein Science Facility for assistance with protein purification. We thank the PHIV and MRI platform for access to microscopes. Funding: Y.J. is funded by ERC no. 3363360-APPL under FP/2007-2013; Y.J and A.M. by an INRA innovative project (iRhobot). Author
contributions: M.P.P. generated all transgenic material, and was responsible for all experiments.
V.B., M.P.P. and A.M. conceived, performed and analyzed super-resolution imaging. V.B. performed and analyzed TIRFM and FRAP imaging. L.M-P and P.M. performed lipid measurements. A.M. imaged Raichu-ROP6 sensors. J.B. produced recombinant ROP6 and performed GTPase assays. M.P.P and L.A. performed lipid overlay experiments. M.M.M-B., and C.M. assisted with phenotyping and cloning, A.C. performed qRT-PCR analyses, J-B.F. and M.N. designed the sptPALM analyses pipeline, M.P.P., V.B. and Y.J. conceived the study, designed experiments and wrote the manuscript and all the authors discussed the results and commented on the manuscript. Correspondence and requests for materials should be addressed to Y.J. Competing
interests: Authors declare no competing interests.
.
CC-BY-NC-ND 4.0 International license
It is made available under a
Figure S1. Localization of PS sensor along the root and characterization of lines with graded PS concentration. A. Schematic representation of Arabidopsis root with the position of the respective zone of the
root. Root picture by Benjamin Peret: https://figshare.com/articles/Primary_and_lateral_root_ai/5143987. B-C, Confocal images of mCIT-C2LACT root epidermis in basal meristem (BM) and elongation elongation (EZ) in the absence/presence of NAA (10µM, 60min) and related quantification. D, qRT-PCR analysis of PSS1 expression in
WT, PSS1-AMI1, PSS1-AMI2, PSS1-OX1 and PSS1-OX2 (AMI1/2 are two independent transgenic lines each
expressing a different artificial microRNA constructs targeting PSS1; PSS1-OX1/2 are two independent transgenic lines each overexpression PSS1). Grey and black dots represent results obtained with different primers used to amplify the PSS1 cDNA (see Methods). E, Quantification of the PS content by HP-TLC in WT, AMI1,
al., 2018 Dev Cell). F, Picture showing the wavy root phenotype of pss1-3-/-, pss1-4-/- and pss1-5-/-, compared to the WT at 12 days after germination (DAG). G, Quantification of the horizontal growth index (HGI) and vertical growth index (VGI) in WT, pss1-3-/-, pss1-4-/- and pss1-5-/- at 12 DAG. HGI and VGI were calculated as shown
on the cartoon on the right (see Grabov et al., 2005 and methods for details). H, Schematic representation of the phenotypic pipeline used to analyse the gravitropic response. A time zero, plants were turned by 135° and root bending at the gravitropic point was analysed using the RootTrace software (see methods for details). n represents the number of cells (B-C) or roots (G) analysed. Scale bars 10µm, letters indicate statistical differences (see methods for details on statistical tests)
.
CC-BY-NC-ND 4.0 International license
It is made available under a
Figure S2. Variations in PS impacts ROP6-mediated auxin responses. A, Confocal images of epidermal root
cells stained by FM4-64 and treated with BFA (25µM) or BFA/NAA (5µM), and related quantification of the size of FM4-64-stained BFA bodies in WT and complemented pss1-3/PSS1::PSS1g line (BFA: 25µM, 60 min; NAA: 5µM, 30min pre-treatment and 60 min co-treatment with BFA) (image and data in WT are the same as in Fig. 2C).
panel) and treated with either BFA (50µM, 60 min) or BFA and NAA (10µM, 30 min pre-treatment + 60 min concomitant treatment). C, Quantification of the number of PIN2-GFP-positive BFA body number per cell in WT,
rop6-2-/- and pss1-3-/- concomitantly treated with BFA (50µM, 60 min) and NAA (10µM, 30 min pre-treatment +
60 min concomitant treatment). D, Quantification of the number of PIN2-GFP-positive BFA body number per cell in WT and pss1-3-/- treated with increasing concentration of BFA for one or two hours. E, Confocal picture of root epidermal cells expressing CLC2-GFP in the WT and pss1-3 mutant in the presence or absence of NAA (5µM, 30min) and related quantification of the percentage of cell with visible CLC2-GFP labelling at PM (not considering CLC2-GFP in intracellular compartments). Note that in WT non-treated cells, CLC2-GFP localize at both the PM and intracellular compartments but that auxin selectively depletes the PM pool of CLC2-GFP. F, Confocal images of 12-day-old epidermal root cells expressing TUA6-GFP in WT and pss1-3-/- in presence and absence of NAA
(100nM, 60min) and related quantification of the average microtubule orientation. The average orientation was calculated using FibriTool software (see Boudaoud et al., 2014 and methods). G, Representative images of confocal micrograph of FM4-64 staining in root epidermis treated with BFA (25µM, 60min, top) or pre-treated with NAA (5µM, 60min) and then co-treated with BFA+NAA (BFA: 25µM, 30min, NAA: 5µM, 60min). Note that the images for the WT are the same as in Fig. 2D. H, quantification of the size of FM4-64-stained BFA bodies.
I, Ratio of the mean size of FM4-64-stained BFA bodies in the NAA and mock conditions (allow to represent the
respective NAA response of each line). Scale bars 10µm. n represents the number of roots analysed, letters indicate statistical difference (see methods for details on statistical tests).
.
CC-BY-NC-ND 4.0 International license
It is made available under a
Figure S3. PS is dispensable to efficiently target ROP6 at the PM but is involved in NAA-induced changes in ROP6 lateral diffusion at the PM. A, Confocal images of GFP-ROP6 in root epidermis in WT and pss1-3
mutant in the basal meristem (BM) and elongation zone (EZ). Note that GFP-ROP6 is still efficiently targeted to the PM in pss1-3, although we noticed a faint delocalization of GFP-ROP6 in intracellular compartments. Scale bars 10µm. B, Confocal images of GFP-ROP6 during FRAP experiment in WT and pss1-3 in the mock and auxin-treated condition (NAA, 100nM, 30 min), and C, related kymograph (time scale 9 seconds). D-E, Traces of GFP-ROP6 fluorescence intensity at the PM during FRAP analyses in mock and NAA (30min at 1nm or 100nm) treated conditions in WT and pss1-3 roots. For each trace in D and E, “n” are similar as in Fig. 4A. Images for the WT are the same as in Fig. 3A and B. Scale bars: 5 µm.
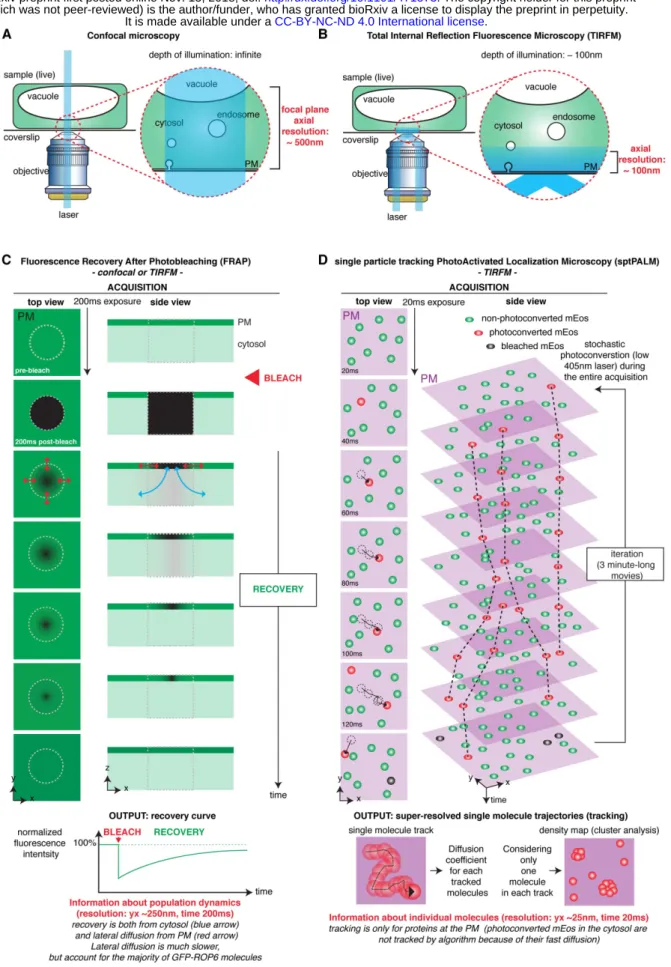
Figure S4: Principle underlying the TIRFM, FRAP and sptPALM analyses. A, In confocal microscopy (both
laser scanning and spinning-disk confocal microscopy), the illumination beam of the laser is perpendicular to the coverslip and passes through the entire sample, exciting all the fluorophores. The focal plane is determined by the pinhole(s) of the confocal microscope and provides an axial resolution (z position) of about 500nm. B, In Total
.
CC-BY-NC-ND 4.0 International license
It is made available under a
the depth of the evanescent wave (~100nm). TIRFM is therefore particularly well suited to study events happening at or in the close vicinity of the PM in contact with the coverslip. Because fluorophores outside of the evanescent wave are not excited, this technique dramatically increases the signal-to-noise ratio during imaging, which allows faster imaging (and/or single molecule imaging). While the xy resolution is still limited (~250nm), the fact that TIRFM largely deplete out-of-focus fluorescence allows to visualise structures, which are in the plane of the PM, and that are not easily identifiable by confocal microscopy. Schematic representation was inspired by Johnson and Vert, 2017. C, Fluorescence Recovery After Photobleaching (FRAP) is a technique to study the kinetics of diffusion of fluorescent molecules. It is based on the fact that a focused high intensity illumination will selectively photobleach the fluorophore (i.e. permanently unable to fluoresce) on a determined region of the sample (here, a small portion of the plasma membrane). Through time, the still-fluorescing GFP-ROP6 molecules will diffuse and replace the dark molecules in the bleached region. FRAP provides information about the diffusion dynamics of the population of GFP-ROP6 molecules (i.e. it provides an averaged value of diffusion, but cannot distinguished whether some proteins are diffusing slowly and some others rapidly, or whether their diffusion is uniform). In addition, fluorescence may be recovered from GFP-ROP6 diffusing in the membrane or arriving from the cytosol. Finally, FRAP can be recorded either in confocal microscopy (see Fig. 3A-B and 4A) or TIRFM acquisition (see Fig. 4E). D, single particle tracking PhotoActivated Localization Microscopy (sptPALM) is a super-resolution microscopy method, which is a derivative of the PALM technique. PALM uses the stochastic activation of photoactivable (or photoswitchable in the case of mEos) fluorescent proteins to perform single molecule imaging. Photoactivation is performed with low light intensity, so that only a small fraction of the molecules is activated, and therefore photoactivated proteins are well separated from each other during imaging. In order to image single molecules, a microscopy setup with a high signal-to-noise ratio, such as TIRFM, is required. In the framework of our study on ROP6 and PS, TIRFM is an ideal technique since it allowed us to preferentially focus on the pool of ROP6/PS at the PM. Each single molecule is recorded as a diffraction limited spot that can be fitted and thereby positioned with high accuracy (xy resolution of about 25nm). PALM is usually performed on fixed samples and the photoactivated proteins are immediately photobleached during the acquisition (excitation with high laser intensity), so that the position of each molecule is recorded only once. The super-resolved image is built through successive cycle of photoactivation followed by acquisition of the single molecules position and its concomitant photobleaching. The main difference between PALM and sptPALM is that sptPALM is performed on live samples (i.e. with molecules diffusing during the time lapse acquisition) and photoactivated molecules are not immediately photobleached during acquisition (excitation with mild laser intensity). This allows to track the positions of single molecules through time before the photoactivated fluorescent protein is bleached (or detached from the PM). This technique thereby allows to obtain the trajectories of single molecules with a xy resolution of roughly 25nm and time resolution of 20ms. It is then possible to obtain a range of quantitative parameters from these tracks, including a spatial map of the trajectories (as shown on Fig. 3D), or their diffusion coefficient (as shown on Fig. 3E, 5B and 6C). By considering only the position of one molecule per track, we can build “livePALM” images, which shows the average position of each mEos-ROP6 molecule imaged during the acquisition (3-minute-long movies). This provides a density map of mEos-ROP6 and allows us to perform cluster analyses (in our case using Voronoï tessellation, see Fig. 3F-G and 5A). By contrast to FRAP analysis, which provides a global analysis of diffusion at the scale of the bleached fluorescent protein population, sptPALM gives access to single molecules information. Furthermore, sptPALM/TIRFM has also increased resolution in all dimensions (z ~100nm, xy ~25nm, t=20ms vs z ~500nm, xy ~250nm, t=200ms in FRAP/confocal).
Figure S5. Raw data of sptPALM experiments presented in the paper. A-H, Left panel represents the
frequency of mEos-ROP6, mEos-ROP6CA, mEos-2xPHEVCT2, mEos-ROP67Q, mEos-ROP6/pss1-3 molecules
according to their apparent diffusion coefficient (log(D)) obtained by analysing sptPALM trajectories in mock and auxin-treated condition (NAA, 10µM, 5min) in WT or pss1-3. Right panel represents the distribution of mEos-ROP6, mEos-ROP6CA, mEos-2xPHEVCT2, mEos-ROP67Q, mEos-ROP6/pss1-3 molecules according to their apparent diffusion coefficient (log(D)) obtained by analysing the frequency plot (left panel) using the R mClust package. The percentage of immobile and mobile molecules in each graph represents the percentage of molecules with a trajectory below and above the log(D) of -1.75, respectively. Note that the percentage in left and right panels for each condition are similar (i.e. they vary only from few percent), confirming the existence of two populations with a normal distribution. Note that the right plots in B and C are similar to the plot in Fig. 3E, the right plot in D is similar to the plot in Fig. 5B and the right plots in E-F are similar to the plots in Fig. 6C. “n” corresponds to the number of trajectories analysed
.
CC-BY-NC-ND 4.0 International license
It is made available under a
Figure S6. Raw data of live PALM experiments presented in the paper. A-C, Left panels represents the
frequency of mEos-ROP6 and mEos-ROP6CA molecules according to their local density (log(local density))
obtained by analysing tessellation-based automatic segmentation of super-resolution images in mock and auxin-treated condition (NAA, 10µM, 5min) in WT. Right panel represents the distribution of ROP6 and mEos-ROP6CA according to their local density (log(local density)) obtained by analysing the frequency plot (left panel)
using the R mClust package. The percentage of low and high local density in each graph represents the percentage of molecules below and above the log(local density) of 3.5, respectively. Note that the percentage in left and right panels for each condition are similar (i.e. they vary only from few percent), confirming the existence of two populations with a normal distribution. Note that the right plots in B and C are similar to the plot in Fig. 3G. “n” corresponds to the number of molecules analysed. D, Example of Voronoï images obtained after extracting local density from tessellation-based automatic segmentation of super-resolution images (left image), cluster detection and filtering of local density (middle image, zoom in right image) in the Voronoï image and E, quantification of the respective size of the cluster in (from left to right), mEos-ROP6 mock-treated, mEos-ROP6 NAA-treated (5min, 10µM), mEosROP6CA mock-treated, mEos-ROP6 mock-treated in pss1-3 and mEos-ROP6 NAA-treated
Figure S7. ROP6 polybasic region interacts with anionic phospholipids and is involved in PM targeting. A,
Structure of ROP9 (PDB: 2J0V) and homology model of ROP6 based on ROP9 structure. The position of ROP6 C-terminal tail (polybasic region + geranylgeranyl) is indicated as well as the sequence of ROP6, ROP63Q, ROP67Q
C-terminal tail. The asterisk indicates the cysteine required for geranylgeranylation. B, Western blot (top) showing expression of recombinant HA-ROP6 and HA-ROP67Q and mock (empty vector) and their corresponding lipid
overlay assays (bottom left). Bottom right, scheme showing the position of the different lipid species spotted on the membrane. Anionic lipids are highlighted in blue. The red arrowhead indicates the interaction between HA-ROP6 but not HA-HA-ROP67Q with PS. C, Confocal images of mCIT-tagged ROP6, ROP63Q, ROP67Q, ROP6Cter, ROP63Q-Cter, ROP67Q-Cter and related quantification of the number of intracellular compartments per cells. n represents the number of roots analysed, letters indicate statistical differences (see methods for details on statistical tests). D, Confocal images of 35Sprom::GFP-ROP6, ROP6prom::mCIT-ROP6 and UBQ10-mCIT-ROP6 in the mock, PAO (30µM, 30min, PI4-Kinase inhibitor) and R599022 (12.5µM, 60min, DAG-Kinase inhibitor) treated condition.
Consistent with ROP6 polybasic region being able to interact with anionic phospholipids via non-specific electrostatic interactions, ROP6 interacted with all anionic phospholipids. In addition, in this in vitro assay, ROP6
.
CC-BY-NC-ND 4.0 International license
It is made available under a
in plants (Simon, Platre et al., 2016; Platre et al., 2018). ROP6, like MSC sensors, possess in its C-terminus a polybasic region (PBR) adjacent to a prenylation site (i.e. geranylgeranylation). Substitution of seven lysine residues into neutral glutamine in ROP6-PBR (ROP67Q) abolished in vitro interaction with all anionic lipids,
showing that interaction with anionic phospholipids was fully dependent on the positive charges in ROP6 C-terminal tail. In planta, diminishing the net positive charges of ROP6-Cter gradually increased its mislocalization into intracellular compartments. This effect was charge dependent as mutating 3 lysine residues in the polybasic region (ROP63Q) had an intermediate effect on ROP6 PM targeting. Again, the graded delocalization of mutant
ROP6 into intracellular compartments depending on their charges closely resembled the behavior of MCS reporters (Simon, Platre et al., 2016; Platre et al., 2018). This suggested that ROP6 PM targeting was dependent on the electrostatic potential of this membrane. Furthermore, we obtained similar results when we expressed only the C-terminal tail of ROP6 (PBR + geranylgeranylation site). Therefore, ROP6 C-terminal tail is necessary and sufficient for ROP6 PM targeting. As shown in Figure S3A, PS has only a minor role in ROP6 PM targeting, with most of GFP-ROP6 remaining at the PM in the pss1 mutant and only a small proportion being delocalized in intracellular compartments. This was in stark contrast with the extensive delocalization of mCIT-ROP67Q in
intracellular compartments. As ROP67Q impaired interaction with all anionic lipids, these results suggested that
interaction with additional anionic lipids are required for efficient PM targeting of ROP6. We previously demonstrated that three anionic lipids are involved in the plant PM high electrostatic signature, with PI4P playing a major role, followed by PA and then PS (Simon, Platre et al., 2016; Platre et al., 2018). To test whether PI4P and/or PA could be involved in ROP6 PM targeting, we inhibited their synthesis using inhibitors of PI4Kinases (i.e. PAO) and DAG Kinases (i.e. R59022). Again, we found that ROP6 localization (either full length or C-terminal tail only) behaved like MSC reporters, with inhibition of PI4P synthesis having the strongest effect on ROP6 PM targeting followed by inhibition of PA synthesis. Together, these results suggest that ROP6 is targeted to the PM via direct electrostatic interactions between the polybasic region present in ROP6 C-terminal tail and the inner electrostatic potential of the PM. Together, these results also confirm that ROP6/PS interaction main functions are not PM targeting but rather suggest a specific role for this interaction in regulating ROP6 lateral segregation within the PM.
Figure S8. The ROP6 polybasic region is required to complement rop6-2 loss-of-function allele and to induce
ROP6-OX gain-of-function phenotype. Because ROP67Q is delocalized in intracellular compartments (a property
that is largely regulated by PI4P and PA, rather than PS, see Fig. S7), we selected transgenic lines with high expression level so that they had similar (or even higher) accumulation at the PM. As expected, we had to select transgenic lines that expressed overall higher amount of proteins than mEos-ROP6 (as seen using anti-mEos western blot analyses) to have similar amount or mEos-ROP67Q at the PM. This strategy allowed us to perform
complementation analyses and to analyse whether PM-localized ROP67Q is functional or not.
A, Quantification of the mCITRINE signal at the PM in 7 day-old root meristem expressing
ROP6prom::mCITRINE-ROP6 and ROP6prom::mCITRINE-ROP67Q in rop6-2-/- background (n=60 plasma
membrane). B, Images of 12 day-old seedlings expressing ROP6prom::mCITRINE-ROP6 and
ROP6prom::mCITRINE-ROP67Q in rop6-2-/- background showing lateral root formation, and related quantification of the lateral root density. Lateral root formation was used as a sensitive phenotypic read-out for the complementation of rop6-2 (Lin et al., 2012). C, Quantification of BFA body size in
ROP6prom::mCITRINE-ROP6 and ROP6prom::mCITRINE-ROP6prom::mCITRINE-ROP6prom::mCITRINE-ROP67Q in rop6-2-/- background. D, Confocal images of 7 day-old root cells
overexpressing 2x35S::mEos-ROP6 and 2x35S::mEos-ROP67Q. E, Quantification of the mEos signal at the plasma
membrane (integrated intensity) in 7 day-old root meristem overexpressing ROP6 and
2x35S::mEos-ROP67Q. F, Western blot showing mEos-tagged protein accumulation in the following transgenic lines (from left
to right): PIP2a::PIP2a-mEos, 2x35S::mEos-ROP6 (line 13) and 2x35S::mEos-ROP67Q (line 2). In the top panel,
the blot was probed with an anti-mEos antibody and in the bottom panel with anti-Histone H3 antibody as loading control. n represents the number of roots analysed, letters indicate statistical differences (see methods for details on statistical tests).
.
CC-BY-NC-ND 4.0 International license
It is made available under a
Figure S9. ROP6 polybasic region is not required for its GTPase activity or for interaction with effectors. A, SDS-PAGE of purified recombinant 6His-ROP6 (full length) and 6His-ROP67Q. B, Measurement of ROP6 and ROP67Q intrinsic GTPase activity. C, Schematic representation of the construct architecture and principle of the
FRET-based sensor of ROP6 activation (RaichuROP6). D, Ratiometric images of Raichu-ROP6, Raichu-ROP6CA,
and Raichu-ROP6CA-7Q transiently expressed in Nicotiana tabacum (colour scale shown on the left) and e, related quantification. n represents the number of cell analysed, letters indicate statistical differences (see methods for details on statistical tests).
After having established that PM-localized ROP67Q are not functional, we verified that mutating the polybasic
region did not impacted ROP6 GTPase activity and/or its ability to bind downstream effectors when in a GTP-bound conformation. For this purpose, we purified full length ROP6 (including the entire C-terminal tail with or without the 7Q mutation) and tested its intrinsic GTPase activity (i.e. ability to hydrolyse GTP in solution). This assay showed that the 7Q mutation in ROP6 C-terminal tail did not impacted the enzymatic activity of the GTPase domain. We also developed a ratiometric FRET-based sensor of ROP6 activity based on the design of the Rho GTPase biosensors for Rac/Cdc42 named Raichu-Rac1 and Raichu-Cdc42 (Itoh et al., 2002; Yoshizaki et al., 2003). In Raichu-Rac1/Cdc42 sensors, the CRIB domain of human PAK1 is cloned in tandem with Rac1 or Cdc42 (interspaced by an appropriate linker) and flanked by two fluorescent protein FRET pairs (Venus and ECFP). The CRIB domain interacts specifically with activated Rac1/Cdc42 (i.e. GTP-bound Rac1 or Cdc42), which induces a conformational change in the sensor and enhances the FRET efficiency between the two fluorescent proteins. We used a similar design for the Raichu-ROP6 sensor. Because the CRIB domain of human PAK1 is known to also interact with plants GTP-bound ROPs (Tao et al., 2002; Akamatsi et al., 2013), we used this domain as a generic probe for ROP6-GTP conformation. Transient expression in Nicotiana tabacum leaves confirmed that Raichu-ROP6CA had a higher FRET ratio than Raichu-ROP6. We next analysed Raichu-ROP6CA-7Q and found that it has a similar (or even slightly higher) FRET ratio than Raichu-ROP6CA. This assay showed that even when the
polybasic region in ROP6 C-terminal tail is mutated, ROP6 is still able to interact with a downstream generic effector such as the CRIB domain of PAK. Although it is impossible to test the effect of the 7Q mutations on all the possible effectors of ROP6, this analysis suggests that the 7Q mutations do not impact the overall conformation of ROP6-GTP. Together with the fact that ROP67Q is still an active GTPase in vitro and that the polybasic region
is outside of the GTPase domain of ROP6, our analyses strongly suggest that the 7Q mutations do not impact the folding/conformation of ROP6 and rather specifically affects the interaction between ROP6 and anionic phospholipids.
Figure S10. PS-less mutants share ROPs-associated phenotypes. A, Sequence alignment of the C-terminal tail
of the 11 Arabidopsis ROPs. Note that they all have a polybasic region with net positive charges ranging from +7 to +9. B, Pictures of WT, pss1-3-/-, pss1-4-/- and pss1-5-/- rosettes at 21 days after germination (DAG). C, Quantification of the pavement cells circularity of WT, pss1-3-/-, pss1-4-/-, pss1-5-/-, pss1-3-/-xpPSS1::PSS1g, rop6-2-/-, ROP6-OX (35S::GFP-ROP6) and ROP6-CA (35S::GFP-ROP6CA). D, Picture showing pavement cells shape
of WT, pss1-3-/-, pss1-4-/-, pss1-5-/-, pss1-3-/-xpPSS1::PSS1g, rop6-2-/-, ROP6-OX and ROP6-CA. E, Picture of
representative root hair shape phenotypes observed in pss1 mutants (classified as straight, wavy, bulged and branched), and related quantification. F, Representation of root hair initiation site ratio calculation and picture of WT, pss1-3-/- and pss1-4-/- root hair initiation site, and related quantification. Arrows indicate the root hair initiation
site. n represents the number of cells (C), and root hairs (E and F) analysed, letters indicate statistical differences (see methods for details on statistical tests).
.
CC-BY-NC-ND 4.0 International license
It is made available under a
used for sptPALM and livePALM analysis.
Supplementary Video 2: Video showing GFP-ROP6 localization (10µM NAA, 20 min) in
TIRFM before and after bleaching a region of interest containing GFP-ROP6 nanoclusters. Note that GFP-ROP6 nanoclusters are immobile and that they do not recover fluorescence after photobleaching (by contrast to surrounding “non-clustered” GFP-ROP6 signal at the PM, for which recovery of fluorescence is fast)
Supplementary Video 3: Video showing GFP-ROP6 localization (10µM NAA, 20 min) in
pss1-3 mutant in TIRFM before and after bleaching a region of interest containing
GFP-ROP6 nanoclusters. Note that, like in the WT, GFP-GFP-ROP6 nanoclusters are immobile. However, by contrast to the WT, GFP-ROP6 nanoclusters rapidly recover fluorescence after photobleaching.
Supplementary materials: Materials and methods
Growth condition and plant materials. Arabidopsis thaliana Col-0 accession was used as
wild type (WT) reference background throughout this study. Plants were grown in soil under long-day conditions at 21°C and 70% humidity and in vitro on Murashige and Skoog (MS) Basal Medium supplemented with 0.8% plant agar (pH 5.7) in continuous light conditions at 21°C. Every plant used for experiments are homozygous lines or F2 crosses. Nicotiana tabacum cv. Petit Havana plants were grown and used in transient transformation experiments as described (38). The following lines were published before: 3, 4, 5,
pss1-3xPSS1prom::PSS1genomic; UBQ10prom::mCHERRY-C2Lact (NASC# N2107778), UBQ10prom::mCITRINE-2xPHEVCT2 (NASC# N2107779)
(28);UBQ10prom::mCITRINE-C2Lact (NASC# N2107347) (30);35Sprom::GFP-ROP6, 35Sprom::GFP-ROP6CA (34);rop6-2
(22);CLC2prom::CLC2-GFP (39);35S::GFP-TUA6 (NASC# N6551) ;PIN2prom::PIN2-GFP (40);UBQ10prom::PIP2a-mEos (15).
Microscopy setup. All imaging experiments were performed with the following spinning disk
confocal microscope set up, except when indicated otherwise (see bellow): inverted Zeiss microscope (AxioObserver Z1, Carl Zeiss Group, http://www.zeiss.com/) equipped with a spinning disk module (CSU-W1-T3, Yokogawa, www.yokogawa.com) and a ProEM+ 1024B camera (Princeton Instrument, http://www.princetoninstruments.com/) using a 63x Plan- Apochromat objective (numerical aperture 1.4, oil immersion). GFP was excited with a 488nm laser (150mW) and fluorescence emission was filtered by a 525/50 nm BrightLine® single-band single-bandpass filter (Semrock, http://www.semrock.com/). YFP/mCITRINE were excited with a 515nm laser (60mW) and fluorescence emission was filtered by a 578/105nm BrightLine® single-band bandpass filter (Semrock, http://www.semrock.com/). mCHERRY and FM4-64 were excited with a 561 nm laser (80 mW) and fluorescence emission was filtered by a 609/54 nm BrightLine® single-band bandpass filter (Semrock, http://www.semrock.com/). 488 or 515 nm lasers were used to excite GFP or YFP/mCITRINE. For quantitative imaging, pictures of epidermal root meristem cells were taken with detector settings optimized for low background and no pixel saturation. Care was taken to use similar confocal settings when comparing fluorescence intensity or for quantification.
Tabaco leaves expressing raichu FRET sensors were observed with an inverted Leica SP8 laser scanning microscope using a 40x Plan-Apochromat objective (numerical aperture 1.1, water immersion). Fluorescent proteins were excited with 458 nm line of a Ne-Ag laser and light were collected simultaneously from 467 to 493 nm for CFP channel and from 538 to 573 for YFP channel. The HyD spectral detector was set to avoid bleed through of CFP fluorescence in the YFPFRET channel. A pinhole of 1 Airy unit was defined. Pixel size and dwell time was respectively 0.143µm and 1.2µs. Those settings were defined to record no signal on non-transformed leaves and kept similar for Raichu constructs tested.
FRAP experiments. Fluorescence in a rectangle ROI (50 µm2, 15 µm long) was bleached in
the plasma membrane optical section by four successive scans at full laser power (150 W) using the iLas2 FRAP module (Roper scientific, http://www.biovis.com/ilas.htm) of our spinning disc microscope (cf description of the system above). Fluorescence recovery was subsequently analysed in the bleached ROIs and in controlled ROIs (rectangle with the same dimension in unbleached area). FRAP was recorded continuously during 90 s with a delay of 0.3 s between frames. Fluorescence intensity data were normalized as previously described (41).
.
CC-BY-NC-ND 4.0 International license
It is made available under a
microscope previously described (AxioObserver Z1) equipped with azimuthal-TIRF iLas2 system (Roper Scientific) and a 100x Plan-Apochromat objective (numerical aperture 1.46, oil immersion). Pixel size was 0.13µm. The azimuth calibration was performed using the manufacturer recommendation and the iLas2 module in Metamorph software. The optimum critical angle was determined as giving the best signal-to-noise ratio. Images were acquired with 200ms exposure time, and 300ms between frames in time-lapse experiments. The photobleaching of ROP6 microdomains was achieved on circular ROIs (15µm diameter) by two successive scans at full laser power (150 W) using the iLas2 FRAP module. Pre- and post-acquisitions were recorded in TIRF during 5 minutes with a delay of 0.3 s between frames. In graphs, relative to domain recovery after photobleaching, “n” represents the number of region of interest (ROI) used for quantification.
sptPALM. Imaging was performed on a Zeiss Elyra PS1 system with a 100x Apo (numerical
aperture 1.46 Oil objective), in TIRF mode. The optimum critical angle was determined as giving the best signal-to-noise ratio. Pixel size was 0.107µm. mEOS was photoconverted using 405nm UV laser power and resulting photoconverted fluorophores were excited using 561nm laser. UV laser power was adjusted to have significant number of tracks without too high density to facilitate further analyses (0.01 to 0.08%). 10,000 images time series were recorded at 50 frames per second (20ms exposure time) on a 256 x 256 pixels region of interest. Single molecule detection and tracks reconstruction were made using MTT algorithm (42) and further computational analyses of tracks were made using CBS sptPALM analyser (Martinière et al., unpublished).
FM4-64, BFA, NAA, PAO, R59022 and Lyso-PS treatments. For BFA body size quantification, the plasma membrane and endosomes of 7 to 10-day old transgenic lines were stained by incubating roots with 1 µM FM4-64 (thermofisher scientific, https://www.thermofisher.com) concomitantly with Brefeldin A at 25 µM (BFA, Sigma, www.sigmaaldrich.com, BFA stock solution at 50 mM in DMSO) in liquid MS solution for 60 min. For the auxin analog, Naphthaleneacetic acid (NAA) effect on BFA body size, plants were pretreated with NAA for 30 minutes at 5 µM (Sigma, http://www.sigmaaldrich.com/, NAA stock at 10 mM in DMSO) and then the plasma membrane and endosomes of 5 to 10-day old transgenic lines were stained by incubating roots with 1 µM FM4-64 concomitantly with BFA at 25 µM and NAA at 5 µM in liquid MS solution for 60 min. For NAA effect on microtubule orientation, 10-12-day old seedlings expressing GFP-TUA6 were treated with NAA at 100 nM for 60 minutes. NAA at 5 µM for 30 minutes was applied on 10 to 12-day old seedlings to quantify the percentage of cell showing CLC2 at the plasma membrane. For PIN2 endocytosis, transgenic lines expressing PIN2-GFP (10 to 12 day-old seedlings), were treated with BFA at the indicated time (60 min or 120 min) and concentration (10µM, 25µM or 50µM) in 12-well plates. For NAA effect on endocytosis, PIN2-GFP expressing lines were pretreated with NAA at 10 µM for 30 minutes and then concomitantly treated with NAA at 10 µM and BFA at 50 µM for 60 min in 12-well plates. For NAA effect on PS biosensors mCITRINE-C2LACT and mCITRINE-2xPHEVCT2, 5 to 7-day old seedlings were treated with 10 µM NAA for 60 min. 5 to 7 day old seedlings expressing 35Sprom::GFP-ROP6 (GFP-ROP6), ROP6prom::mCITRINE-ROP6 (mCit-ROP6) and UBQ10prom::mCITRINE-ROP6-c-term
(mCit-ROP6Cter) were incubated in wells containing 12.5 µM R59022 for 60 min or PAO at
30µM for 30 minutes. Plants observed in TIRFM were treated with NAA at 10µM for 20 minutes. For sptPALM experiment, plants were incubated in DMSO for 20 minutes in 12-well
plates and then NAA treatment was performed at 10µM (stock solution 100mM in DMSO) for 5 minutes. For FRAP experiment, NAA was applied at 1nm and 100nm for 30 min. For each treatment, the mock condition corresponds to incubation of plants in well supplemented with a volume of DMSO equivalent to the highest drug concentration used and for the same time as the actual treatment. Roots were imaged within a 5-minute time frame window around the indicated time. Lyso-PS treatment were performed as described (28).
CLONING
Preparation of gateway compatible entry clones (entry vector):
Published gateway compatible entry vectors are listed below.
The ROP6 promoter (ROP6prom) was amplified from Col genomic DNA. Gateway compatible PCR products were introduced into pDONRP4R-P1 vectors (Thermofisher,
www.thermofisher.com, cat# 12537023) by BP recombination using the following primers:
ROP6prom_F (ttttttgtacaaacttgcctttctctccttcttcaaacttc) and ROP6prom_R
(gtatagaaaagttgctaacaagctttcagaaaagaggatg) to give ROP6prom/pDONRP4RP1.
The ROP6 genomic sequence (ROP6g – At4g35020) from the ATG to its 3’UTR was amplified from Col0 genomic DNA. Gateway compatible PCR products were introduced into
pDONRP2R-P3 (Thermofisher, www.thermofisher.com, cat# 12537023) vectors by BP
recombination using the following primers: ROP6-B2R
(ggggacagctttcttgtacaaagtggctatgagtgcttcaaggtttatcaagtg) and ROP6-B3w3'UTR
(ggggacaactttgtataataaagttgccttaagacaattggtgtgaatctagg) to give ROP6g/pDONRP2RP3. Mutation in ROP6 were obtained by successive site directed mutagenesis using the following partially overlapping forward and reverse primers:
ROP6-CA-fw (gtcggcgacgttgctgttggaaagacttgtc) and ROP6-CA-Rev (tccaacagcaacgtcgccgacagtgacacacttgataaacc) using ROP6g/pDONRP2RP3 as template to
give ROP6g-CA/pDONRP2RP3.
Mutations in ROP6g-PBR were obtained by ligation using the following 5’-phosphorylated primers:
ROP6g-7Q_F (gctgctgctggttttttggtggctggagaacgac) and ROP6g-7Q_R
(agcagcaacaatctcagaaaggttgttctatactc) using ROP6g/pDONRP2RP3 as template to give
ROP6g7Q/pDONRP2RP3.
ROP6g-3Q_F (ccaaaaaacaagcagaagcagaagcagaaatctcagaaaggttgttc) and ROP6g-3Q_R
(gagatttctgcttctgcttctgcttgttttttggtggctggagaacgacc) using ROP6g/pDONRP2RP3 as template to give ROP6g3Q/pDONRP2RP3.
The ROP6 coding sequence (CDS) was amplified from Col0 cDNA. Gateway compatible PCR products were introduced into pDONRP221 (Thermofisher, www.thermofisher.com, cat# 12536017) vectors by BP recombination using the following primers: ROP6-B1 (ggggacaagtttgtacaaaaaagcaggcttaatgagtgcttcaaggtttatcaagtg) and ROP6-B2wSTOP
(ggggaccactttgtacaagaaagctgggtatcagagtatagaacaacctttctgag) to give
ROP6cDNA/pDONRP221.
Mutations in ROP6cDNA-PBR were obtained by ligation using the 7Q_F and
ROP6g-7Q_R 5’ phosphorylated primers and ROP6cDNA/pDONRP221 as template to give ROP67QcDNA/pDONRP221.
.
CC-BY-NC-ND 4.0 International license
It is made available under a