HAL Id: hal-01709900
https://hal-amu.archives-ouvertes.fr/hal-01709900
Submitted on 18 May 2018
HAL is a multi-disciplinary open access
archive for the deposit and dissemination of
sci-entific research documents, whether they are
pub-lished or not. The documents may come from
teaching and research institutions in France or
abroad, or from public or private research centers.
L’archive ouverte pluridisciplinaire HAL, est
destinée au dépôt et à la diffusion de documents
scientifiques de niveau recherche, publiés ou non,
émanant des établissements d’enseignement et de
recherche français ou étrangers, des laboratoires
publics ou privés.
Data Processing
Ivan Madjarov, Juš Kocijan, Alexandra Grancharova, Bogdan Shishedjiev
To cite this version:
Ivan Madjarov, Juš Kocijan, Alexandra Grancharova, Bogdan Shishedjiev.
Towards a
Service-Based Framework for Environmental Data Processing.
International journal of advanced
com-puter science and applications (IJACSA), The Science and Information Organization, 2014, 5 (4),
�10.14569/IJACSA.2014.050408�. �hal-01709900�
Towards a Service-based Framework for
Environmental Data Processing
Ivan Madjarov
Aix Marseille Université, CNRS, ENSAM, Université de Toulon, LSIS UMR 7296,
13397, Marseille, France, [email protected]
Alexandra Grancharova
Bulgarian Academy of Sciences, Institute of System Engineering and Robotics,P.O.Box 79, Sofia 1113, Bulgaria [email protected]
Juš Kocijan
Jozef Stefan Institute, Department of Systems and Control, Jamova 39, 1000 Ljubljana, SloveniaUniversity of Nova Gorica, School of Engineering and Management, Vipavska 13, 5000 Nova Gorica, Slovenia
Bogdan Shishedjiev
Technical University of Sofia,Department Programming and Computer Technologies, 1000 Sofia Bulgaria
Abstract — Scientists are confronted with significant data
management problems due to the huge volume and high complexity of environmental data. An important aspect of environmental data management is that data, needed for a process, are not always in the adequate format. In this contribution, we analyze environmental data structure, and model this data using a semantic-based method. Using this model, we design and implement a framework based on Web services for transformation between massive environmental text-based data and relational databases. We present a mapping model for environmental data transformation to be used in the scenario devoted to the methodology for development of stochastic models for prediction of environmental parameters by application of Gaussian processes.
Keywords— Scientific data, Environmental data, Web services, Data integration, Stochastic model, Gaussian process, Metadata
I. INTRODUCTION
Nowadays, a significant part of a scientist's work is dedicated to accessing, visualizing, integrating and analyzing data from a wide range of heterogeneous sources because science is more and more data-driven. On the other hand, scientist's activities, scientific instruments and computer simulations produce more and more data from different domain, e.g. physics, astronomy, meteorology, air pollution and so on. Scientists process these data and generate new data based on the results of the processes. Editing and updating of data also generates data. Produced data are schema-less, semi or fully structured persisting in different repositories [5]. According to some sources [2], the data volumes are approximately doubling each year. Furthermore, scientists need to know based on which collection of data they have produced a specific result. An important problem that arises here is the
data provenance and the data versioning that can be expressed by the question: What data in which version a specific result was obtained. So, data require new methods of organization for scientific analysis. It is obvious that scientists need a data structuring and a storing organization for data management and processing. The existing scientific tools are mostly focused on data processing and visualization, and data management is largely left to the user [3].
Many of scientific data are traditionally stored in ASCII format, i.e. text file. The ASCII text is a recognized standard for data exchange (e.g. input/output) supported by scientific instruments and simulation devices. It is recognized that ASCII-based data are platform independent, so they can be analyzed in different operating systems and they can be imported to whatever information system or scientific workflow. However, this form presents some drawbacks:
Low readability: data can be presented in different units without any context-based explanation and they become somewhere ambiguous.
Hard to integrate: scientific data are natively heterogeneous, unstructured and they are usually stored in different files and/or in different locations. This makes it difficult to integrate all the data into one place without a common sematic schema.
Data searching: content discovery is a difficult task in a large datasets or in thousands of distributed files. An important aspect of environmental data management is that data, needed for a process, are not always in the adequate format. Scientists use different tools in different stages of their research; they develop some tools for their work by themselves and spend time to retrofitting data into acceptable formats for these tools [4].
So, the main problem to address here is how to provide an efficient way to implement massive data transformation between texts and databases. This is a common problem for both computer science researchers and environmental science researchers, as we consider environmental data as a subset of scientific data.
In semi-structured data, the information that is normally associated with a schema is contained within the data [3]. The meaning and logic structure of semi-structured data can be expressed and identified by semantic tags. For instance, XML is a standardized extended markup semi-structured data.
In this paper, we present our work in progress. We analyze environmental data structure, and model this data using a semantic-based method. Using this method, we design and implement a Web service-based framework for transformation between massive environmental text-based data and relational databases. As main contribution, we present a mapping model for environmental data transformation. We apply this model in a scenario devoted to the methodology for development of stochastic models for prediction of environmental parameters. We envision a schema for prediction of environmental parameters by application of Gaussian processes, e.g. the ozone concentration in the air based on data collected on-line by automatic measurement stations. As well, we can easy apply the developed methodology to predict the concentrations of other air pollutants e.g. sulfur dioxide and nitrogen dioxide.
The paper is organized as follows: first in section 2 we present the background with some related work. In section 3, we present our motivation and concept for an environmental Web services-based workflow. In sections 4 and 5 we present our scenario for environmental data processing based on Gaussian processes. Finally, in section 6 we conclude and discuss some future work.
II. BACKGROUND AND RELATED WORK
As presented in [3] scientific utilities can fall into three categories: (1) scientific software; (2) scientific languages and (3) scientific workflows. In this study we present a non-exhaustive list of mature scientific utilities i.e., scientific software, scientific languages, workflows software and systems to justify the choice that we will do in our research project.
A. Scientific Software
Scientific software tools in general, load data in memory. Usually scientists need to perform some extra steps in order to prepare data for processes. To use different tools, scientists must learn different sets of commands, scripting or programming languages for different framework and operating systems.
B. Scientific Languages
The Apache Hadoop [9] is an open-source software library for storage and large-scale processing of data-sets on clusters. It is a framework that allows distributed processing of large data sets across single servers or thousands of machines by using simple programming models. As presented in [8], the Java open source library is designed to detect and handle failures at the application layer, so delivering a highly-available service on top of a cluster.
Google Open Refine (GOR) [6] is a standalone open source
desktop application for data cleanup and transformation to other formats. It is similar to spreadsheet applications; however, it behaves more like a database. GOR opens a Web interface powered by a Web server. It operates on rows of data which have cells under columns, which is similar to relational database tables. Transformation expressions are written in the GOR Expression Language. It is able to work with CSV, TSV, XML, JSON, Excel and RDF formats.
Matlab [7] is a numerical computing environment and
allows matrix manipulations, plotting of functions and data, implementation of algorithms, creation of user interfaces. It imports data from CSV files, excel spreadsheets and databases. Import functions read the data in memory and reorganize them in vectors or matrices, then all functions work on these data structures and possible interfacing with programs written in other languages, including C, C++, Java, and FORTRAN.
C. Scientific Workflows
Workflow composition represents the conceptual model of a scientific analysis which implies the flow of data within a system. Every step of workflows acts on the data. The required data are obtained from previous steps, from local files, from relational databases, from remote services or another source.
Kepler [10] is a free scientific workflow management
system. It is able to acquire data from different sources, process them by prepared or user defined components. Optionally, an external data processing facility can be applied. This software provides process and data monitoring, provenance information, and data movement solutions. Its architecture is directed graphs where the nodes represent discrete computational components and the edges represent paths along which data and results can flow between components. In Kepler obtaining data from external sources like CSV files, spreadsheets, relational DBMSs and remote data sources are done by specific actors as metaphors to model the steps of workflows. The system includes a graphical user interface for composing workflows.
VisTrails [11] is an open-source scientific workflow and
provenance management system that provides support for simulations, data exploration and visualization [3]. The provenance information is presented as XML files or as tables in a relational database. It allows users to navigate workflow versions, to undo changes, to visually compare workflows and their results, and to examine the actions that led to a result. It allows the combination of loosely-coupled resources, specialized libraries, grid and Web services.
Taverna [12] is an open source scientific Workflow
management tool suite to design and execute workflows. It is able to fetch data from CSV and spreadsheet files, local and remote resources through provided or custom services. It provides provenance functionalities and a common model for workflows and means for sharing and reusing them across the borders of individual working groups. To leverage the existing infrastructure, the computational model strongly focuses on Web-services. It provides an API and a Web interface to access data about various Web services.
III. MOTIVATION AND CONCEPT FOR AN ENVIRONMENTAL
WORKFLOW
Scientific Workflows present a managed combination of activities and computations in order to resolve scientific problems. In contrast to business Workflows that implement business processes involving different actors and systems, scientific workflows are used to realize computational experiments, possibly confirming or invalidating scientific hypotheses. Scientific Workflow systems maintain the execution of repetitive tasks such as data access, transformation and analysis [1, 24] data from heterogeneous sources, e.g. sensor systems, measuring instruments, text files, spreadsheets, databases, simulation devices, etc.
The creation and exchange of scientific and environmental information increase the amount of data that should be processed, from one hand, as well as the possibilities for their interpretation, on the other hand. This motivates many researchers and specialists to reconsider the existing engineering and network architectures, the database schemas, the algorithms and rules for data interpretation. Beside the hug size, the data are represented in a way, which does not allow processing by the traditional DBMS, because of their heterogeneity and specific characteristics.
Sensor systems are usually used to monitor the state of the environment in the urban areas. The obtained measurements need to be stored in a database, which is very important for the development of schema-based data models. So, the data collected by the sensors are used in real time by different applications through procedures for control of large amount of data in spatiotemporal databases. The problem which arises is related to the information control, because of the specific characteristics of the collected data. The space-time character of data requires the development of new approaches for structuring, exploitation and visualization of these data. Sensor networks and associated databases are used for monitoring and registration of various environmental phenomena, e.g. for the accurate prediction of the future values of these phenomena and for all stochastic-based data processing for environmental norm evaluation.
Specific languages for scientific data description already exist. CDF and HDF are languages, which are used in the physics of thermonuclear synthesis, the geology and the astronomy. They represent data models, API, and file formats for storage and control of scientific data. These formats allow storing data as a simple table that is difficult to apply with a large amount of data that have a complex structure. In our work we process environmental data as a subset of scientific data. However, a specific language for description of environmental data doesn't really exist. Moreover, there is a large diversity of characteristics proprietary of environmental data, i.e. different scales of measurement expressed in different units. We suggest the use or the extension of a scientific Workflow with adapted semantics for presentation and storage of large amount of data, related to the monitoring system that analyzes environmental parameters. We argue for a semantic and Web service-based approach for processing environmental data from multiple and heterogeneous sources.
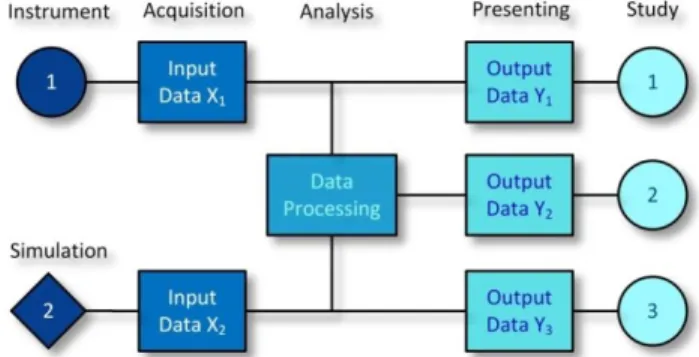
Fig. 1. General structure diagram of a scientific workflow for environmental data processing.
The study of environmental data requires the use of protocols, mathematical models and procedures, which need to be validated. In order to accomplish this, we rely on a Workflow scientific process through integration and control of the components, defining the air quality in the environment.
The scientific goal of our research work in progress is to study the complexity of the systems for environmental monitoring, which use large amount of data. We develop solutions in terms of semantic languages, models and methods for access, storage and use of scientific and environmental data, implemented mainly as Web interfaces and services. Our focus in this area is geared towards the design and implementation of service oriented systems that allow a pay-as-to-go generation of composite cloud-based services according to the users’ requirements.
In this paper, we aim at the development and integration of technologies and expertise, necessary to resolve the problem with the huge amount of environmental data applied to stochastic models for environmental parameter prediction by application of Gaussian processes. In order to achieve this goal, we rely on a Workflow-based scientific process, directed towards the control of data flow (Fig. 1).
The main goal includes the following sub-goals:
1) Development of a data control strategy. We study the
algorithms and the efficiency of the Cloud-XaaS platform (Anything-as-a-Service) with an emphasis on the semantic structuring of acquired data from the instruments in order to facilitate the data integration when heterogeneous sources are used. We develop services for remote data control, associated with the data processing, i.e. acquisition, analysis, requests, actualization, computations and visualization as shown in Fig. 1.
2) Data storage. We develop a multi-layer model with an
automatic indexing of data by using the existing services within the Cloud-based platforms. We propose a native data storage architecture (NXD), which is adapted to various functions allowing the connection with other platforms.
3) Distribution of the environmental data. We develop a
model for digital visualization of environmental data through a transformation process for Web-based presentation in terms of tables and/or vector graphics. The environmental data are transformed into SVG, as an XML document, which allows building applications for immediate graphical representation of
the prognosis on the user side. The digital visualization is associated with the latest advances in responsive design that takes into account all particularities of desktop and mobile devices based on media queries.
4) Development of mathematical models for prediction of environmental parameters. This includes the system
integration via Web services of the modeling approach based on Gaussian processes with data about the concentrations of ozone, sulfur dioxide and nitrogen dioxide in the air, collected at the automatic measurement stations.
5) Metadata descriptions. Scientific Workflow systems
typically describe data processing via a Workflow definition language. However, current specific Workflow definition languages, even adopted by current mature scientific Workflow systems, are too complex and excessive for non-professionals. We design an XML-based environmental data definition language using schema descriptions to suit a lightweight workflow system in a specific domain such as air quality.
6) Data integration. Notable characteristics of scientific
computing are data integration, data manipulations during calculation, scientific analysis, data migration and the data store on distributed machines according to guidelines and logical relations [8]. We assert that Web Services can be used to unlock heterogeneous scientific systems to extract and integrate environmental data.
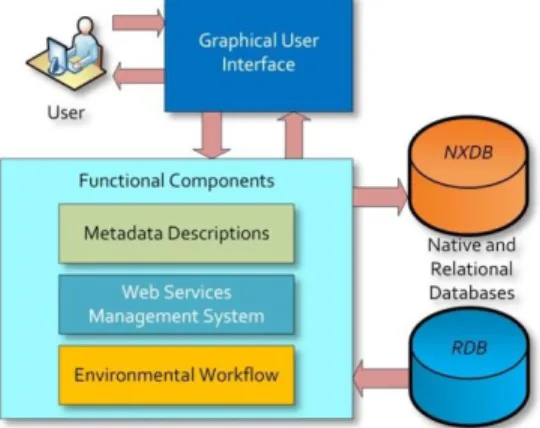
There are two issues in using a scientific Workflow approach to prediction modeling: The first one is the choice of a Workflow composition and execution environment. The second issue adapts the process steps in an environmental data management suite. We recommend the second issue because it can be associated to Web Service technology. It is necessary to recall that the Web Service paradigm enables the aggregation of multiple data sources. In this approach, each process step is implemented as a Web Service and Web Services are chained together to form a modeling task as shown in Fig. 2. In the core of Web Service technology is the Web Services Description Language (WSDL) [13]. WSDL provides a XML-based framework and language for defining interfaces e.g. input and output, SOAP access specification (Simple Object Access Protocol) [14] and the location of the service. This approach can achieve greater system interoperability with existing scientific Workflows.
Fig. 2. Integrated platform for environmental data processing with environmental metadata description, Web Services Management for data and application integration with an environmental Workflow.
IV. ENVIRONMENTAL DATA METADATA DESCRIPTION AND
PROCESSING
A. Environmental Data Need a Metadata Description
In general, to be able to process scientific and environmental data it is important to know their meaning, e.g. what it is about, how they was obtained, how they are formatted and so on. This information is coded and stored as data about the real data, i.e. an underlying definition or description. The formal descriptions are useful to record meaningful information about the data, their provenance and their coding in order to be understood by other users. So, we generate metadata as data that describe other data with some common characteristics:
The metadata summarize basic information about data, which can make finding and working with particular instances of data easier, or to locate a specific set of data by filtering through metadata. Metadata for scientific and environmental data contain
descriptions of the content, as well as keywords linked to the content. These are usually expressed in the form of meta-tags.
The meta-tags are the vocabulary of metadata and they are often evaluated by search engines to help decide of data relevance.
The metadata information is to be used in automated data processing by standard procedures, i.e. the procedures have to understand metadata and to process data according to metadata description. Metadata can be created manually, or by automated
information processing.
There are a lot of research works in the metadata domain as described in [24]. Some of them try to define a formal language able to describe a widest set of data. Organization such as OMG [23] developed standard models and languages such as CWM and UML. On the basis of CWM several metadata models for business application were developed in [22]. The main difficulty to address here is the data heterogeneity, the variety of their applications and the wide range of specialized languages used for their description. The native heterogeneity specific to environmental data requires a meta-description that takes into account the difference in size, the difference in measurement scale, the difference in context or provenance. In this study, we find that languages mentioned so far do not appear to be entirely satisfactory. Therefore we recommend more appropriate environmental data semantics to be defined.
B. Metadata Types and Models
In our research work for the description of environmental data we define different types (levels) of metadata:
1) Origin: this data describe the ownership of each piece
of data, the place where it is stored, the organization and/or the person responsible for its maintenance.
2) Access right: this data describe rights to read, write or
process data by someone.
3) Processing: the data about special routines or/and
Fig. 3. Environmental data model presented in three sections with two reference classes that tell the mapping between both models presented as XML schema, i.e. (1) General; (2) Semantics; (3) Layout.
4) Formatting: this data describe how data are recorded
and stored; are they numerical and in what unit of measurement are they written.
5) Naming and Meaning: this data describe data about the
namespace of every piece of data, their meaning described by the language of the knowledge domain and the data provenance.
Fig. 3 shows our concept of XML schema for metadata description. This choice is argued by the differences between business data and scientific data as described below:
Most scientific data is numerical and float especially in domains with strong mathematical background as physics, chemistry and engineering.
The datasets concerning one source are huge.
The origin and access metadata values are identical for whole datasets. They do not differ from value to value as in the case of business data.
Most of scientific data are multidimensional tables.
Fig. 4. Canonical form of our environmental data processing model
C. Relational Model of Scientific Data
In our work we propose a scientific-environmental dataset as a simple relational database. So, the metadata was devised in three parts (sections).
1) General: metadata about the origin and access rights.
This part contains also a general description of the data and references to specific procedures used to process them.
2) Semantics: contains elements describing the meaning of
the data file. The main hypothesis was that most environmental data can be presented as one or as few tables containing two types of quantities: (1) independent and (2) dependent quantities. This way they can be examined as a relational table with a primary key consisting of independent quantities and the dependent quantities as non-key attributes. There are other data named parameters that are common for the whole dataset and characterize the environment of the experiment or the assumptions of the simulation as shown in Fig. 3.
3) Layout: describes the formatting and the structure of
the raw data.
In Fig. 4 our environmental data processing model is presented. The idea behind is to convert environmental data to the structure of the developed semantics model named canonical or standard form. By this approach it becomes easier to develop associated Web services for environmental data processing. Instead developing
M
N
different Web services processingM
different data structures toN
results we can produceM
transformations (automatic) to standard form andN
Web services. The conversion is done according the meta-description of data and Web services defined in the canonical description shown in Fig. 3.The proposed solution serves as a modeling language for experimental and measured data from different environmental sources and captures, especially applied to predict the concentrations of air pollutants in an inspected region.
V. ENVIRONMENTAL DATA PROCESSING BASED ON
GAUSSIAN PROCESSES
This section is devoted to the methodology for development of stochastic models for prediction of environmental parameters by application of Gaussian processes. It represents the core of the data processing block in the structural diagram, shown in Fig. 1. The Gaussian process (GP) model is a probabilistic, non-parametric black-box model based on the principles of Bayesian probability. The output of the GP model is a random variable with normal distribution, expressed in terms of the mean and the variance. The mean value represents the most likely output and the variance can be interpreted as a measure of its confidence. The obtained variance, which depends on the amount and the quality of the available identification data, is important information when it comes to distinguishing the GP models from other computational intelligence methods. Because of their properties GP models are especially suitable for uncertain processes modelling or when modelling data are unreliable, noisy or missing. In this respect, GP models fit well for environmental system modelling. Its use and properties for
modelling are reviewed in [15]. The use of Gaussian processes for dynamic system modelling is a relatively recent development [16, 17, 18]. A retrospective review of dynamic system modeling with Gaussian process models can be found in [19].
A Gaussian process is a collection of random variables which have a joint multivariate Gaussian distribution (Fig. 5). Assuming a relationship of the form y f( )x between an input
X
R
D and outputY
R
, we havey
(1), (2), ... , ( )~ (0, )
y
y M
N
Σ
, where pq Cov( ( ), ( ))y p y q C( ( ), ( ))x p xq gives the covariance between the output points y p( ) and y q( ) corresponding to the input pointsx
( )
p
andx
( )
q
. Thus, the mean
( )
x
(usually assumed to be zero) and the covariance function( ( ), ( ))
C
x
p
x
q
fully specify the Gaussian process. Note that the covariance function ( ( ), ( ))C x p xq can be any function with the property that it generates a positive definite covariance matrix. A common choice is:2 1 0 1 1 ( ( ), ( )) exp ( ( ) ( )) 2 D i i i pq i C p q v w x p x q v
x x where Θ[w1, ... ,w v vD, 0, ]1 are the "hyper-parameters" of the
covariance function, xi denotes the i-th component of the D-dimensional input vector X, and
pq
is the Kronecker operator. The covariance function (1) is composed of two parts: the Gaussian covariance function for the modeling of system function and the covariance function for the modelling of noise. The noise is usually presumed to be white. Other forms of covariance functions suitable for different applications can be found in [15]. For a given problem, the hyper-parameters are learned (identified) using the data at hand. After the learning, one can use the
w
parameters as indicators of ‘how important’ the corresponding input components (dimensions) are: if wi is zero or near zero it means that the inputs in dimension i contain little information and could possibly be removed.Consider a set of M D-dimensional input vectors
1 2
[ , ,..., M]T
X x x x and a vector of output data
1 2
[ , , ... , ]T M y y y
y . Based on the data
( , )
X y
, and given a new input vectorx
*, we wish to estimate the probability distribution of the corresponding outputy
*. Unlike other models, there is no model parameter determination as such, within a fixed model structure. With this model, most of the effort consists in tuning the parameters of the covariance function. This is done by maximizing the log-likelihood of the parameters, which is computationally relatively demanding since the inverse of the data covariance matrix (M×M) has to be calculated at every iteration.The described approach can be easily utilized for regression calculation. Based on a training set
X
, a covariance matrixK
of size M×M is determined. As already mentioned before, the aim is to estimate the probability distribution of thecorresponding output
y
* at some new input vectorx
*. For a new test inputx
* , the predictive distribution of the corresponding output is * *| , ( , )
y x X y and is Gaussian, with mean and variance:
* * 1 2 * * * 1 * 0 ( ) ( ) ( ) ( ) ( ) ( ) T T k
x k x K y x x k x K k x where * * * 1 ( ) [ ( , ), ..., ( , )]T M C C k x x x x x is the M×1 vector ofcovariance between the test and training cases and
* * *
0( ) ( , )
k x C x x is the covariance between the test input and itself.
The identified model, in addition to mean value, also provides information about the confidence in prediction by the variance. Usually, the prediction confidence is depicted with
2
interval which is about 95% confidence interval.Fig. 5. Modelling with GP - Gaussian distribution of predictions at new points x1, x2 and x3, conditioned on the training points (.).
Fig. 6. Using GP models - in addition to the prediction mean value (full line), we obtain a 95% confidence region (dotted lines) for the underlying function
f
.This confidence region can be seen in the example in Fig. 6 as band bounded by dotted lines. It highlights areas of the input space where the prediction quality is poor, due to the lack of data or noisy data, by indicating a wider confidence band around the predicted mean.
Gaussian processes can, like neural networks, be used to model static non-linearities and can therefore be used for modeling dynamic systems [16, 18] as well as time series if lagged samples of output signals are fed back and used as regressors. For the environmental parameter dynamics modelling we consider representation where the output at the step k depends on the delayed outputs y:
( )
( (
1), (
2), ... , (
))
( )
y k
f y k
y k
y k
n
k
where
( )
k
is white noise and the outputy k
( )
depends on the vector [ ( 1), ( 2), ... , ( )]Ty k y k y kn . Assuming the signal is known up to the step k, we wish to predict the system output h steps ahead, i.e., we need to find the predictive distribution of
y k
(
h
)
corresponding tox(kh). Multiple-step-ahead predictions of a system modeled by eq. (3) can be achieved by iteratively making repeated one-step-ahead predictions, up to the desired horizon [16, 18].The quality of the mean values predicted by a Gaussian process model can be assessed by computing the average squared error (ASE) [15]:
2 1 1 ˆ [ ] M i i i ASE y y M
where yˆi and
y
i are the output prediction and the output measurement at the i-th step. Additionally, the quality of the prediction variance can be assessed with the logarithm of the predictive density error (LD) [15]:2 2 2 1 ˆ [ ] 1 1 log(2 ) log( ) 2 2 M i i i i i y y LD M
where 2 i
are the prediction at the i-th step.The described methodology for development of GP models for environmental parameter prediction has been already applied to predict the ozone concentration in the air of Bourgas city, based on data collected on-line by the automatic measurement stations [20, 21]. This methodology can be easily applied to predict the concentrations of other air pollutants like sulfur dioxide and nitrogen dioxide in some of the most air polluted industrial cities in Bulgaria (Plovdiv, Stara Zagora, Varna, Bourgas).
VI. CONCLUSION
In this paper we proposed a concept of the framework for environmental data processing and stochastic models for prediction of environmental parameters. We analyzed environmental data structure, and modeled this data using a semantic-based method. Using this model, we designed and
implemented a framework based on Web services for transformation between massive environmental text-based data and relational databases. We presented a mapping model for environmental data transformation to be used by application of Gaussian processes.
For future work we emphasize for environmental risk management and data provenance linked to gas emissions and pollution of air in industrialized cities.
REFERENCES
[1] Joost N. Kok, Anna-Lena Lamprecht, and Mark D. Wilkinson, Tools in Scientific Workflow Composition, T. Margaria and B. Steffen (Eds.): ISoLA 2010, Part I, LNCS 6415, pp. 258–260, Springer, 2010. [2] Shi Feng, Jie Song, Xuhui Bai, Daling Wang, and Ge Yu, A Web-Based
Transformation System for Massive Scientific Data, L. Feng et al. (Eds.): WISE Workshops, LNCS 4256, pp. 104 – 114, Springer, 2006. [3] Javad Chamanara, Birgitta König-Ries, SciQL: A Query Language for
Unified Scientific Data Processing and Management, In: PIKM’12, Maui, Hawaii, USA, 2012.
[4] P. Prabhu, T. B. Jablin, A. Raman, Y. Zhang, J. Huang, H. Kim, N. P. Johnson, F. Liu, S. Ghosh, S. Beard, T. Oh, M. Zoufaly, D. Walker, D. I. August. A Survey of the Practice of Computational Science. In ACM, editor, State of the Practice Reports, pp. 19:1–19:12, ACM Press, 2011. [5] A. Ailamaki, V. Kantere, and D. Dash. Managing scientific data.
Commun. ACM, 53(6):68–78, 2010.
[6] Google Refine. http://code.google.com/p/google-refine/. [7] Matlab: The Language of Technical Computing.
http://www.mathworks.com/products/ matlab/.
[8] Gaozhao Chen, Shaochun Wu, Rongrong Gu, Yongquan Xu, Lingyu Xu, Yunwen Ge, Cuicui Song, Data Prefetching for Scientific Workflow Based on Hadoop, Computer and Information Science 2012, Studies in Computational Intelligence Volume 429, pp 81-92, Springer, 2012. [9] Apache Hadoop , http://hadoop.apache.org/
[10] The Kepler Project. https://kepler-project.org.
[11] VisTrails. http://www.vistrails.org/index.php/Main_Page.
[12] Taverna Workflow Management System. http://www.taverna.org.uk. [13] W3C, WSDL, http://www.w3.org/TR/wsdl.
[14] W3C, SOAP, http://www.w3.org/TR/soap/.
[15] C. E. Rasmussen and C. K. I. Williams. Gaussian processes for machine learning, MIT Press, Cambridge, MA, London, 2006.
[16] K. Ažman, J. Kocijan. Application of Gaussian processes for black-box modelling of biosystems. ISA Transactions, Vol. 46, No 4, pp. 443-457, 2007.
[17] A. Grancharova, J. Kocijan, and T. A. Johansen. Explicit stochastic predictive control of combustion plants based on Gaussian process models. Automatica, vol. 44, No. 6, pp. 1621-1631, 2008.
[18] J. Kocijan, A. Girard, B. Banko, R. Murray-Smith. Dynamic systems identification with Gaussian processes. Mathematical and Computer Modelling of Dynamic Systems, vol. 11, No. 4, pp. 411-424, 2005. [19] J. Kocijan, Dynamic GP models: an overview and recent developments,
ASM'12 Proceedings of the 6th international conference on Applied Mathematics, Simulation, Modelling, Pages 38-43, 2012.
[20] D. Petelin, J. Kocijan, and A. Grancharova. On-line Gaussian process model for the prediction of the ozone concentration in the air. Proceedings of BAS, vol.64, No.1, pp.117-124, 2011.
[21] D. Petelin, A. Grancharova, and J. Kocijan. Evolving Gaussian process models for prediction of ozone concentration in the air. Simulation Modelling Practice and Theory, vol.33, pp.68-80, 2013.
[22] David Marco, Michael Jennings, Universal Meta Data Models, ISBN 0-471-08177-9, Wiley 2004.
[23] OMG Specifications, http://www.omg.org/spec/.
[24] A. Ailamaki, V. Kantere, D. Dash, Managing Scientific Data, Communications of the ACM, vol. 53, 6, pp.68-78, 2010.