HAL Id: hal-02917734
https://hal.archives-ouvertes.fr/hal-02917734
Submitted on 19 Aug 2020HAL is a multi-disciplinary open access archive for the deposit and dissemination of sci-entific research documents, whether they are pub-lished or not. The documents may come from teaching and research institutions in France or
L’archive ouverte pluridisciplinaire HAL, est destinée au dépôt et à la diffusion de documents scientifiques de niveau recherche, publiés ou non, émanant des établissements d’enseignement et de recherche français ou étrangers, des laboratoires
Elucidating the role of electrochemical polarization on
the selectivity of the CO2 hydrogenation reaction over
Ru
Christopher Panaritis, Carine Michel, Martin Couillard, Elena Baranova,
Stephan Steinmann
To cite this version:
Christopher Panaritis, Carine Michel, Martin Couillard, Elena Baranova, Stephan Steinmann. Eluci-dating the role of electrochemical polarization on the selectivity of the CO2 hydrogenation reaction over Ru. Electrochimica Acta, Elsevier, 2020, 350, pp.136405. �10.1016/j.electacta.2020.136405�. �hal-02917734�
Elucidating the role of electrochemical polarization on the selectivity of the CO2
hydrogenation reaction over Ru
Christopher Panaritisa, Carine Michelb
, Martin Couillardc, Elena A. Baranovaa, Stephan N.
Steinmannb*
a Department of Chemical and Biological Engineering, Centre for Catalysis Research and
Innovation (CCRI), University of Ottawa, 161 Louis-Pasteur, Ottawa ON, K1N 6N5, Canada
b Univ Lyon, Ens de Lyon, CNRS UMR 5182, Université Claude Bernard Lyon 1, Laboratoire de
Chimie, F69342, Lyon, France
c National Research Council of Canada, 1200 Montreal Road, Ottawa, Ontario K1A 0R6,
Canada
Abstract
The hydrogenation of CO2 into high-value fuels is a potentially effective approach to reduce
anthropogenic dependence on fossil fuels and effects of climate change. In this study, we evaluated the hydrogenation of CO2 into CO and CH4 under the electrochemical promotion of catalysis
(EPOC) effect through experimental and computational studies using Ru nanoparticles. Ru nanoparticles (1-2 nm) supported on yttria-stabilized zirconia (YSZ) solid electrolyte were evaluated at 250 °C at atmospheric pressure. Under positive polarization, the methanation reaction was promoted and the competitive reverse water gas shift (RWGS) reaction was impeded. On the other hand, negative polarization resulted in suppressing permanently the methanation reaction and minimally affecting the RWGS reaction. To qualitatively rationalize the tuning of selectivity via EPOC, Density Functional Theory (DFT) computations were used to model the EPOC effect induced on the Ru(0001) surface. DFT computations uncovered that electric field effects together with a change in surface electrochemical potential between intermediates are responsible for the contrasting influence of EPOC on the CH4 and CO formation over Ru catalysts.
Keywords
Electrochemical promotion of catalysis, methanation, reverse water gas shift, density functional theory
1. Introduction
Due to the importance of carbon dioxide (CO2) in the greenhouse gas effect, the heterogeneous
catalytic reduction of CO2 with hydrogen (H2) to base chemicals has been extensively studied
[1,2]. Depending on the catalyst and relative partial pressures, the Reverse Water Gas Shift (RWGS) or the methanation reaction is dominant, yielding carbon monoxide (CO) and methane (CH4), respectively [2]. Ruthenium (Ru) has been used extensively due to its dual ability of
activating CO2 and H2, and it is the most economical noble metal [3]. Based on experimental
Fourier transform infrared (FTIR) spectroscopy and Density Functional Theory (DFT) studies, the main reaction pathways of CO2 reduction over Ru catalysts is summarized in Scheme 1 [3–6]. The
is crucial for the selectivity: either CO desorbs or it hydrogenates further to CHO and ultimately to CH4. This competition depends on the morphology and the presence of promoters as well as on
the reaction conditions (temperature and H2/CO2 pressure ratio). Typically, CH4 selectivity is
favoured by temperatures of 200-300 °C. Above 250 °C the temperature is high enough to enable the endothermic formation of CO on Ru nanoparticles, although only at about 500 °C a high selectivity was reached in earlier reports [7].
Scheme 1. Schematic mechanism of the CO2 hydrogenation pathway under standard conditions
on the Ru(0001) surface.
The activity and selectivity of metal supported catalysts can be tuned by metal-support interactions (MSI) [7,8], metal alloying [9,10], addition of alkali promoters [6,11] etc. Another strategy is to apply external electrochemical stimuli and exploit the Non-Faradaic Electrochemical Modification of Catalytic Activity (NEMCA), also named Electrochemical Promotion of Catalysis (EPOC) phenomenon. The setup is schematically represented in Scheme 2.
Scheme 2. Schematic representation of the EPOC phenomenon.
In EPOC, the catalyst is deposited on a solid electrolyte and submitted to a small current or potential. Applying an electrochemical potential to the catalyst surface results in an alteration of catalytic activity and in some cases reaction selectivity. EPOC refers to the change in reaction rate that is not affiliated to an electrochemical reaction. Hence, it does not abide by Faraday’s Law [12]. EPOC has been observed for over 100 reactions and catalytic systems [13–15]. When the applied potential is switched off, the modification decays and the system typically returns to its original catalytic activity, i.e., EPOC allows to reversibly tune the activity and selectivity. Many studies were dedicated to rationalize EPOC, leading to general empirical rules [16–18]. According to these studies, EPOC allows for the in-situ control of the spillover/backspillover of promotional
application of a potential difference between the inert counter electrode and the working-catalyst electrode [13,19]. The (back-)spillover effect results in the modification of catalyst work function and was evaluated using several surface-sensitive techniques and catalytic reactions [20,21]. Nevertheless, a precise atomistic understanding of the origin of the promotional activity is lacking. Comprehending the atomistic origin of this process clarifies the role of promotional species, i.e., if they act as spectator species or directly participate in the bond formation/scission processes. This detailed insight will also improve our understanding of metal-support interactions and chemical promotion effects since these phenomena are functionally equivalent [18].
Previous EPOC studies of CO2 hydrogenation over Ru films of 2 µm thickness, have
demonstrated that the electrochemical polarization alters the CO to CH4 ratio [22,23],
independently from the promoting species used, such as O2-, Na+, K+ and H+, associated with
yttria-stabilized zirconia (YSZ), Na-β”-Al2O3, K-β”-Al2O3, and BaZrO0.85Y0.15O3-α (BZY) solid
electrolytes, respectively [22,23]. This suggests a universal promoting mechanism, which is not primarily related to surface coverages of active species such as H and O but rather due to the polarization of the electrode and work function modification.
To elucidate the origin of the contrasting impact of the electrochemical potential of the catalyst surface on CH4 and CO production rates, we investigate the competition between CO and CH4
production over Ru catalysts at moderate temperatures of 250 °C, where EPOC allows to tune the competition between the two pathways. We aim at providing qualitative but robust understanding of the EPOC effect. Our model of EPOC that includes the polarization at the interface without specifying the promoting species predicts trends in the competition that are in line with the experimental observations regarding the selectivity of the CO2 reduction. It confirms that when
using Ru-based catalysts, the selectivity of the reaction is not driven by the nature of the migrating species but by the induced polarization. The combination of periodic DFT and experiments shows that the relative adsorption energy of CO and CHO as a function of the electrochemical potential at the catalyst surface is key for determining the selectivity between CO and CH4 production. 2. Experimental
2.1 Catalyst preparation
The ruthenium (Ru) nanoparticles were synthesized using the polyol synthesis method [9]. The method incorporates metal precursors, ethylene glycol (EG) and tetramethylammonium hydroxide (TMAOH). The addition of TMAOH serves to stabilize and increase the pH to govern the size of the nanoparticles. The Ru colloid was prepared using 0.105 g of ruthenium chloride (RuCl3) (anhydrous, Sigma Aldrich) mixed in 15 mL ethylene glycol (Fischer-Scientific certified
grade) containing 0.15 M TMAOH (Sigma Aldrich, pentahydrate). The solution was then heated up until it reached 160 °C and immediately turned off and cooled to room temperature. Initial pH of the solution was 12 and dropped to 7 after reflux. The final colloidal solution was black in color and stored at room temperature.
2.2 Physicochemical characterization
The size of the free-standing Ru nanoparticles was evaluated using scanning transmission electron microscopy (STEM) performed on a FEI Titan3 80-300 TEM operated at 300 keV,
equipped with a CEOS aberration corrector for the probe-forming lens. Annular Dark Field (ADF) images were taken using a Fishione detector to provide a contrast between the nanoparticles and support at convergence and collection angles of 17 and 60 mrad, respectively. The Ru colloidal sample was sonicated in ethanol and then one-drop was deposited onto a 200 mesh TEM copper grid coated with a lacey carbon support film (Ted Pella). The Image J software was used to measure the average size of the nanoparticles. X-Ray Diffraction (XRD) patterns did not show peaks for the free-standing Ru nanoparticles because they were amorphous.
2.3 Electrochemical cell and reactor setup
The electrochemical cell consisted of the ionically conductive support 8 mol% Y2O3
-stabilized ZrO2 (YSZ) (Tosoh) as the solid electrolyte in the form of a disc (diameter = 19 mm and
thickness = 1 mm) prepared as described elsewhere [24]. Gold (Au) counter and reference electrodes were painted using Au paste (C2090428D4, Gwent Group, CAS: 98- 55-5) next to each other with a surface area of 1 cm2 and 0.2 cm2, respectively. The Au counter and reference
electrodes were annealed in air at 500 °C for 1 h. Directly opposing the counter electrode, the working catalyst-electrode was deposited in a surface area of 1 cm2. The Ru catalyst was deposited
as a colloid solution enclosed in a tape mask mold. It was deposited 10 µL at a time with subsequent heating at 130 °C for 10 min in between deposits to dry the solution until the desired catalyst loading (0.2 mg of Ru free-standing nanoparticles) was achieved. A gold mesh was mechanically pressed on the catalyst-working electrode to act as a current collector, as previously shown [8].
The total flow rate of 100 mL.min-1 consisted of CO2 (Linde, 99.999%), H2 (Linde, 100%)
and He (Linde, 100%) balance at 1.5 kPa, 9 kPa and 89.5 kPa, respectively. These were fed to the reactor through three independent mass flow controllers (MFC, MKS Instruments). The catalyst was pre-treated in 20 kPa of O2 for 2 h at 200 °C to remove any residue ethylene glycol and
TMAOH from the surface. The pre-treatment was then followed by He purging for 15 min and then H2 (30% in He) for 3 h at 200 °C to reduce the RuO2 surface to Ru. The CO2:H2 ratio of 1:7
was used since it was observed in all previous EPOC reactions that the this ratio displayed the highest selectivity to CH4 with Ru films and additionally allows for CO and CH4 end-products to
be produced [23]. The high concentration of H2 during reaction conditions ensures a complete
reduction at 200 °C. These conditions are chosen in order to conveniently determine the influence of the electrochemical potential at the catalyst surface on product selectivity. The product gases were analyzed using a quadrupole mass spectrometer (QMS, Ametek Proline DM 100), with values for CO2, CO, H2O, CH4, He and H2 corresponding to the m/z (mass-to-charge) ratios 44,
28, 18, 15, 4 and 2, respectively. The electrochemical cell is a modified version of the reactor described in Ref. [25]. Three gold wires were used to connect the working, counter and reference electrodes to the potentiostat-galvanostat (Arbin Instruments, MSTAT) that supplied the application of potential and constant current to the electrochemical cell.
The EPOC effect was evaluated through the enhancement ratio (ρ) (eq. 1) and apparent Faradaic efficiency (Λ) (eq. 2) defined through the following equations.
𝜌 = 𝑟 𝑟$ (1) |𝛬| = 𝛥𝑟
𝐼/𝑧𝐹 (2)
Where ro represents the open circuit catalytic rate (i.e. no polarization) and r represents the
catalytic rate when potential is applied. The numerator (Dr) in eq. 2, is the difference between r
and ro. The denominator represents the rate at which the migration species Oδ- travels through the
triple-phase boundary to the Ru gas exposed surface, where z is the number of electrons transferred (2e- for CO and 8e- for CH4), F is Faraday’s constant and I is the applied current.
2.4 Computational details
The VASP code (Vienna Ab-initio Simulation Package) was used to perform all DFT computations [26]. The dispersion corrected density functional approximation PBE-dDsC was applied. This method has been shown to reproduce experimental adsorption energies [26,27]. In the absence of experimental insight on the most representative surface sites, the most stable Ru(0001) surface was chosen [3,4]. A symmetric p(3x3) unit cell with of 5 metallic layers was used. A large (45.2 Å) vacuum layer separates the two surfaces to prevent interactions and provides the necessary space of the description of the double layer. [28] The Brillouin zone was integrated with a Monkhorst–pack k-point of 5x5x1. The basis-set cutoff was set to 400 eV. All geometries have been optimized to forces below 0.02 eV/Å with wave functions converged to 10-6 eV.
Frequencies were computed with the harmonic approximation to determine the vibrational contribution to the enthalpy and entropy. The translational and rotational contributions for the gas molecules were computed within the ideal gas approximation and the rigid rotator approximation. The linearized Poisson-Boltzmann equation with default parameters as implemented in VASPsol module [29] has been used to model the influence of the electrochemical potential at the catalyst surface [28,30]. For detailed explanations on the computational model, we refer the reader to ref [31], where we have also demonstrated that the precise technical parameters do not considerably influence the EPOC results. The investigated reaction pathway follows the proposal by Avanesian
et al. [3].
The Gibbs Free Energy (Gads) values for each reactant, intermediate and product adsorbed
on Ru(0001) were calculated using equation 3.
𝐺234 =
1
2[𝐺467829:;<$=:96=: − ?𝐺467829:+ 2 𝐺<$=:96=:A] (3)
where Gsurface+molecule is the Gibbs Free Energy of the optimized configuration of the species on the
Gibbs Free energy of the molecule optimized in the gas phase. The factor ½ accounts for the use of a symmetric slab, which is also the reason for the use of two gas-phase molecules in the reference.
3. Results & Discussion
3.1 Characterization of Ru Nanoparticles
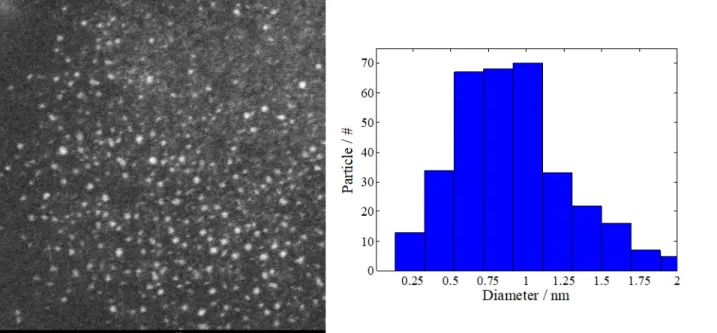
The STEM image displayed in Fig. 1 confirms that the Ru nanoparticles were between 0.5-1 nm in diameter, in accordance with the modified polyol method. Additionally, the free-standing (i.e. unsupported) nanoparticles were well dispersed and did not display significant agglomeration prior to reaction. Supported STEM images were not possible due to the presence of the solid electrolyte, which blocks the transmission and SEM does not provide enough resolutions to view the nanoparticles. The contrast provided by the ADF image represents the nanoparticles as bright spots on the darker background. Here, RuOx (x ≤ 2) are displayed since they are exposed to air; however,
they were reduced back to metallic Ru during the hydrogenation pre-treatment step.
Fig. 1. STEM image of free-standing Ru nanoparticles and corresponding particle size distribution
histogram.
3.2 EPOC performance for Ru nanoparticles
To evaluate the EPOC phenomenon for the methanation and RWGS reaction on Ru nanoparticles deposited on YSZ, 250 °C was chosen as reaction temperature, since simultaneous production of CO and CH4 is observed at this temperature. We show in Fig. 2a a representative
transient rate response for application of a positive current of 50 µA at 250 °C, which corresponds to a potential difference between the catalyst-working and reference electrode (UWR) of about 1 V.
The open-circuit (O.C.) conditions were maintained for 1 h after reaching a steady-state, followed by 3 h polarization and return to open-circuit for 3 h. The duration of each time window was chosen to let the system reach a steady-state.
At open-circuit conditions, the production rate for CO is greater than for CH4. When a
positive current of 50 µA is applied, the methanation reaction is promoted, with ρ > 1 and Λ = 34 (Fig. 2a). Conversely, the RWGS reaction is impeded, with ρ < 1 and a low Faradic efficiency (Λ
= 15). When the system is switched back to O.C. conditions, it requires over 2 h to return, in line with the slow increase in rate upon positive application. During positive polarization there is a continuous supply of oxygen ionic species to the gas-exposed catalyst surface that act as promoters for CH4 and inhibitors for CO production. The slow return of CO production rate to O.C. upon
current interruption indicates that supplied oxygen ions remain on the surface of the catalyst and continue acting as inhibitors for CO formation for over 2 h. A Λ>1 signifies non-Faradaic behavior, which improves as the Λ value increases [12]. However, for hydrogenation reactions with O2- solid electrolyte as active support, since O2-is not a reactant, the process is non-Faradaic
when ρ ≠ 1. The kinetic study performed by Theleritis et al. [22], and Kalaitzidou et al.[23], have shown that the selectivity to CH4 can be influenced by three factors: H2 partial pressure (7:1
H2:CO2) in the feed, reaction temperature (< 300 °C) and catalyst loading (>2 mg) under
open-circuit conditions. Since the methanation reaction is positive order in the electron donor (i.e. H2)
and the application of polarization is equivalent to increasing the partial pressure of H2 in the
reaction, the CH4 rate is favored. The underlying hypothesis is that the positive surface charge,
increases the coverage of H and thus the hydrogenation to CH4. Therefore, positive potentials
induce reducing conditions (i.e. high hydrogen coverage) without having to increase the amount of H2.
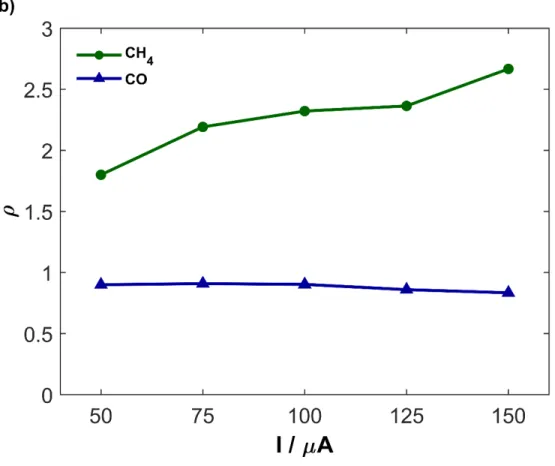
Fig. 2b summarizes the EPOC response when varying the current from 50 to 150 µA and the corresponding enhancement ratio (ρ). As the current is increased, the CH4 rate increases and
the CO rate decreases. It is a rather robust behavior since it was also observed on much thicker Ru films also deposited on YSZ and on other solid electrolytes (i.e. K-β”-Al2O3, Na- β”-Al2O3, and
Fig. 2. (a) Transient effect for application of 50 µA, and (b) Summary of ρ values under various
currents at 250 °C for the production of CO and CH4. 0.2 mg catalyst, H2:CO2 7:1 and total flow
rate 100 mL min-1.
The effect of negative polarization was investigated with application of a constant current of -25 µA (UWR = ~-1 V) for 3 h, displayed in Fig. S1a and b (Electronic Supplementary
Information) for CH4 and CO rate, respectively. The production rate of CO is barely affected (ρ
~1) while the one of methane is reduced (ρ = 0.46). Upon current interruption, the open-circuit CH4 production rate did not return to its initial values, suggesting that the induced modification
(reduction) of the surface state under a negative current and a negative potential difference is irreversible being maintained when the catalyst is left under open-circuit conditions. This is in line with the work by Theleritis et al., [32], where Ru was in a reduced state inhibiting the formation of CH4 which is favored by the oxidation state. Additionally, once the CH4 rate reached a new
steady-state (not shown), negative potential was applied again, which resulted in further decrease in CH4 production and minimally affected CO. This provides a way to permanently suppress
unwanted CH4 production and produce only CO at a temperature as low as 250°C. Producing CO
clean from CH4 is important when aiming at the production of longer hydrocarbon chains in a
Given the above reported EPOC effect on the methanation reaction, which is also in line with previous experiments, [23,32] let us now turn to the atomistic modeling. Computational studies to rationalize the EPOC effect are not very numerous and can be divided into two categories: (i) adsorbates are included explicitly [33,34] which results in a significant computational complexity, especially when investigating an entire reaction pathway (ii) the EPOC phenomenon is modelled by including a uniform electric field [35]. Herein, we rely on our recently proposed a third approach, which is to directly model the electrochemical potential at the catalyst surface instead of an electric field [31]. This method was successfully employed to highlight the influence of the electrode polarisation on chemical steps involved in electrochemical processes, such as the rotation of adsorbed formate in the electro-oxidation of formic acid to CO2 [36]. In
short, the potential dependence is determined treating the electrons in a grand-canonical ensemble. Grand-canonical DFT allows to keep the potential constant from one elementary step to the next by varying the number of electrons [37–39]. The linearized Poisson-Boltzmann equation is used to model a thermodynamic average for the effective double layer, necessary to neutralize the surface charge. The resulting surface polarization is associated with a varying number of electrons as a function of the reaction coordinate in order to keep the potential constant and in agreement with the experimental setup [31,37,38,40,41]. This approach does not require specifying the chemical nature of the promotional species. Note, however, that we have chosen a model Ru(0001) surface at a intermediate coverage and in the absence of co-adsorption to qualitatively understand the EPOC effect. This approximation prohibits quantitative comparisons to experiments, especially ones that assess the influence of the nanoparticle size or differences in promoting species. Furthermore, in contrast to simulations with an explicit electrostatic field, the potential dependent simulations facilitate the comparison with experiment where the potential is the measurable quantity. All computational details follow closely the one of ref [31], where interested readers can find details on the approach..
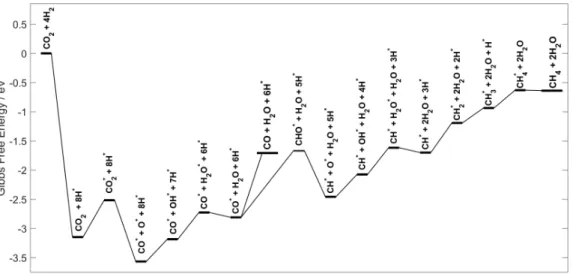
Fig. 3. Computed Gibbs Free Energy profile at 250 °C and atmospheric pressure of the CO2
hydrogenation into CO and CH4 on Ru(0001) in open-circuit conditions.
To begin with, we considered the hydrogenation pathway in open-circuit conditions over Ru(0001), theoretically modeled by steady-state, equilibrium thermodynamics. The formation of methane is the thermodynamic product (computed ΔG250°C = -0.74 eV) while CO is the kinetic
product (computed ΔG250°C = 0.2 eV). A catalytic cycle beginning with the adsorption of CO2 and
4 H2 was calculated to allow for the formation of CH4. Avanesian et al. proposed that the formation
of CO and CH4 over Ru(0001) begins with the direct dissociation of H2 into H*, followed by the
adsorption of CO2 and its dissociation into CO* and O* [3,4]. Then, to yield CH4, CO* is
hydrogenated either to CHO* or to COH*. The CHO* pathway was selected since transition states conducted by Avanesian et al., show that CHO* is more favorable, even though COH* is thermodynamically more stable [3]. The C-O bond can break in the CHO* intermediate, yielding CH* that undergoes successive hydrogenations to reach CH4. In parallel, O* is hydrogenated to
OH* and then H2O. Following this pathway, the open-circuit Gibbs Free energy profile was
evaluated at 250°C and at standard pressure conditions and displayed in Fig. 3. Desorption of close-shell molecules was systematically included when feasible (typically, desorption of water as soon as generated along the path). Competitive pathways were also considered, as shown in Figure S2. For instance, the hydrogenation of CO2, yielding COOH*, results in an intermediate that is
less stable than the CO*+O* by at least 1 eV. The dissociation of CO* into C*+O* has been shown by Zhang et al., to require a high energy transition state (2.63 eV) when compared to its desorption or its hydrogenation into CHO* or COH* and thus was not included in this study [4].
CO* is a critical intermediate for the overall selectivity of the hydrogenation of CO2. It can
either desorb or be further reduced into CHO* and then to CH4 through the sequence shown in
Fig. 3. With a slightly smaller desorption energy of CO (∆Gdes= 1.10 eV), desorption of CO is
more likely than its hydrogenation into CHO* (∆G= 1.15 eV). This is in line with our experimental results in open circuit (O.C.) conditions, displaying a higher selectivity in CO over CH4 (shown in
Let us now turn to the influence of an applied electrochemical potential at the catalyst surface on the selectivity. The reduction of CO into the CHO* was identified to be the selectivity determining step. We selected a maximum range of ±1 V since it is the typical experimental range evaluated in EPOC reactions [22,23]. The Gibbs free energy values at 250°C are summarized in Table S1 for open-circuit and ±1 V and the full profiles are shown in Fig. S3. Additionally, geometries are provided in the VASP format.
The CO2 chemisorption is improved by the application of a negative potential (from ∆Gads=
0.63 eV in O.C. conditions to 0.21 eV at -1V). In agreement with previous studies, the CO chemisorption is not very much affected at constant potential [42] or constant fields [43], but it is still stronger under a negative polarization that favors stronger back-bonding (from ∆Gdes= 1.10
eV in O.C. conditions to 1.18 eV at -1V). This is in agreement with EPOC rules [19], where CO is an electron acceptor and its chemisorption increases upon negative polarization (decrease of work function). Because this effect is less pronounced in the present case, where CO is a reaction intermediate or product, it may indicate that the effect of polarization on CO adsorption depends on the presence of other adsorbed species (electron donor or acceptor) on the Ru surface during the RWGS reaction. However, our DFT calculations do not explicitly include co-adsorption; therefore, this requires further investigation. H2O is the most impacted, with an opposite behavior:
the chemisorption is strengthened by a positive polarization, switching from exergonic desorption under a negative polarization (∆Gdes= -0.25 eV at -1V) to endergonic desorption (∆Gdes= +0.61
eV) under a positive polarization while it was athermic under O.C. conditions (∆Gdes= -0.08 eV).
These general trends are in agreement with empirically established rules of electrochemical promotion where the chemisorption of electron acceptor (i.e. CO2) is favored by a negative
polarization and electron donor (i.e. H2O) by positive polarization [19,22]. The resulting overall
profiles (shown in Fig. S3 a and b) are hence modulated by the polarization.
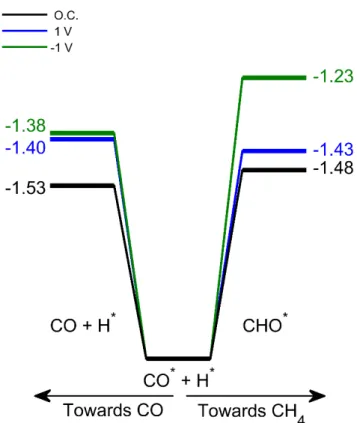
The influence of polarization on the CO/CH4 selectivity is illustrated in Fig. 4 focusing on
the branching from CO* to CO and CHO*. As already mentioned, the influence on CO chemisorption is rather weak (less than 0.1 eV). The CO*+H* à CHO* is more sensitive with variations up to 0.23 eV in the reaction Gibbs energy. As previously seen, under O.C. the difference is small between these two competing reactions (0.05 eV), in favor of CO desorption. This difference in favor of CO desorption increases under negative polarization (0.15 eV), due to a destabilization of the CHO intermediate. This is in line with the decrease in CH4 production
under a negative polarization which was observed experimentally. Under a positive polarization, this branching turns slightly, by 0.03 eV, in favor of the hydrogenation of CO* into CHO*. In addition, the steps that follow are less endothermic, overall facilitating CH4 production as seen in
our experiments (see Fig. 2). However, inferring a quantitative picture on the overall production rates of CO and CH4 would require more advanced modeling, including transition states but also
likely an improved description of the active sites of the Ru nanoparticles and perhaps even the effect of co-adsorbed species.
Fig. 4. Branching from the CO*+H* intermediate to CO and to CHO* in function of the
polarization. Energies are provided in eV.
4. Conclusion
Our computational model of EPOC that includes the polarization at the interface without specifying the promoting species predicts selectivity trends that are qualitatively in line with the experimental observations. It confirms that the selectivity of this reaction is not sensitive to the type of migrating species but to the change of surface electrochemical potential and the associated surface polarization. Hence, we can safely assume that the main EPOC effect stems from the electric field in the effective double layer and the varying number of electrons during the reaction which keep the potential constant as a function of the reaction coordinate. The combination of periodic DFT and experiments shows that the relative energy of CHO as a function of the electrochemical potential of the catalyst surface is key for determining the selectivity between CO and CH4 production. The computational simplicity of our model allows it to be used in future
studies to depict the polarization effect for various reactions and catalysts, as well as MSI and other promotional phenomena in catalysis.
Conflicts of interest
There are no conflicts to declare.
Acknowledgements
The authors thank University of Ottawa, CNRS, and ENS Lyon for support of research conducted within the context of the International Associated Laboratory ‘Fundamental catalysis for green chemistry: From well defined active sites to mechanistic explorations – FUNCAT.’ and Natural Sciences and Engineering Research Council of Canada (NSERC) for financial support. The authors thank the SYSPROD project and AXELERA Pôle de Compétitivité for financial support (PSMN Data Center).
References
[1] M.D. Porosoff, B. Yan, J.G. Chen, Catalytic reduction of CO2 by H2 for synthesis of CO, methanol and hydrocarbons: challenges and opportunities, Energy Environ. Sci. 2 (2015) 303. doi:10.1039/C5EE02657A.
[2] S. Saeidi, S. Najari, F. Fazlollahi, M.K. Nikoo, F. Sefidkon, J.J. Klemeš, L.L. Baxter, Mechanisms and kinetics of CO 2 hydrogenation to value-added products: A detailed review on current status and future trends, Renew. Sustain. Energy Rev. 80 (2017) 1292– 1311. doi:10.1016/j.rser.2017.05.204.
[3] T. Avanesian, G.S. Gusmão, P. Christopher, Mechanism of CO2 reduction by H2 on Ru(0 0 0 1) and general selectivity descriptors for late-transition metal catalysts, J. Catal. 343 (2016) 86–96. doi:10.1016/j.jcat.2016.03.016.
[4] S.-T. Zhang, H. Yan, M. Wei, D.G. Evans, X. Duan, Hydrogenation mechanism of carbon dioxide and carbon monoxide on Ru(0001) surface: a density functional theory study, RSC Adv. 4 (2014) 30241. doi:10.1039/C4RA01655F.
[5] X. Wang, H. Shi, J. Szanyi, Controlling selectivities in CO2 reduction through
mechanistic understanding, Nat. Commun. 8 (2017) 513. doi:10.1038/s41467-017-00558-9.
[6] K. Yaccato, R. Carhart, A. Hagemeyer, A. Lesik, P. Strasser, A.F. Volpe, H. Turner, H. Weinberg, R.K. Grasselli, C. Brooks, Competitive CO and CO2 methanation over supported noble metal catalysts in high throughput scanning mass spectrometer, Appl. Catal. A Gen. 296 (2005) 30–48. doi:10.1016/j.apcata.2005.07.052.
[7] C. Panaritis, M. Edake, M. Couillard, R. Einakchi, E.A. Baranova, Insight towards the role of ceria-based supports for reverse water gas shift reaction over RuFe nanoparticles, J. CO2 Util. 26 (2018) 350–358.
[8] H.A.E. Dole, A.C.G.S.A. Costa, M. Couillard, E.A. Baranova, Quantifying metal support interaction in ceria-supported Pt, PtSn and Ru nanoparticles using electrochemical
technique, J. Catal. 333 (2016) 40–50. doi:10.1016/j.jcat.2015.10.015.
[9] E.A. Baranova, C. Bock, D. Ilin, D. Wang, B. MacDougall, Infrared spectroscopy on size-controlled synthesized Pt-based nano-catalysts, Surf. Sci. 600 (2006) 3502–3511.
doi:10.1016/j.susc.2006.07.005.
[10] Y. Daza, J.N. Kuhn, CO2 conversion by reverse water gas shift catalysis: Comparison of catalysts and mechanisms and their consequences for CO2 conversion to liquid fuels, RSC Adv. 6 (2016) 49675–49691. doi:10.1039/C6RA05414E.
[11] X. Su, J. Xu, B. Liang, H. Duan, B. Hou, Y. Huang, Catalytic carbon dioxide
hydrogenation to methane: A review of recent studies, J. Energy Chem. 25 (2016) 553– 565. doi:10.1016/j.jechem.2016.03.009.
[12] C.G. Vayenas, S. Bebelis, C. Pliangos, S. Brosda, D. Tsiplakides, Electrochemical Activation of Catalysis, Springer US, 2001.
[13] C.G. Vayenas, S. Ladas, S. Bebelis, I. V. Yentekakis, S. Neophytides, J. Yi, C. Karavasilis, C. Pliangos, Electrochemical promotion in catalysis: non-faradaic
electrochemical modification of catalytic activity, Electrochim. Acta. 39 (1994) 1849– 1855. doi:10.1016/0013-4686(94)85174-3.
[14] G.G. Vayenas, S. Bebelis, S. Ladas, Dependence of catalytic rates on catalyst work function, Nature. 343 (1990) 118–143. doi:10.1016/0021-9797(80)90501-9.
[15] C. Wagner, Adsorbed Atomic Species as Intermediates in Heterogeneous Catalysis, Adv. Catal. 21 (1970) 323–381. doi:10.1016/S0360-0564(08)60567-2.
[16] A. Katsaounis, Recent developments and trends in the electrochemical promotion of catalysis (EPOC), J. Appl. Electrochem. 40 (2010) 885–902. doi:10.1007/s10800-009-9938-7.
[17] C.G. Vayenas, Bridging electrochemistry and heterogeneous catalysis, J. Solid State Electrochem. 15 (2011) 1425–1435. doi:10.1007/s10008-011-1336-5.
[18] P. Vernoux, L. Lizarraga, M.N. Tsampas, F.M. Sapountzi, A. De Lucas-Consuegra, J.L. Valverde, S. Souentie, C.G. Vayenas, D. Tsiplakides, S. Balomenou, E.A. Baranova, Ionically conducting ceramics as active catalyst supports, Chem. Rev. 113 (2013) 8192– 8260. doi:10.1021/cr4000336.
[19] S. Brosda, C.G. Vayenas, J. Wei, Rules of chemical promotion, Appl. Catal. B Environ. 68 (2006) 109–124. doi:10.1016/j.apcatb.2006.07.021.
[20] M.N. Tsampas, F.M. Sapountzi, A. Boréave, P. Vernoux, Investigation of the
Electrochemical Promotion of Catalysis origins on electrochemical catalysts with oxygen ion conductive supports: Isotopic labeling mechanistic studies, Solid State Ionics. 262 (2014) 257–261. doi:10.1016/j.ssi.2014.01.008.
[21] M. Makri, G.G. Vayenas, S. Bebelis, K.H. Besocke, C. Cavalca, Atomic resolution STM imaging of electrochemically controlled reversible promoter dosing of catalysts, Surf. Sci. 369 (1996) 351–359. doi:10.1016/S0039-6028(96)00911-9.
[22] D. Theleritis, M. Makri, S. Souentie, A. Caravaca, A. Katsaounis, C.G. Vayenas, Comparative study of the electrochemical promotion of CO2 hydrogenation over Ru-supported catalysts using electronegative and electropositive promoters,
[23] I. Kalaitzidou, M. Makri, D. Theleritis, A. Katsaounis, C.G. Vayenas, Comparative study of the electrochemical promotion of CO2 hydrogenation on Ru using Na+, K+, H+ and O2- conducting solid electrolytes, Surf. Sci. 646 (2016) 194–203.
doi:10.1016/j.susc.2015.09.011.
[24] I.R. Gibson, G.P. Dransfield, J.T.S. Irvine, Sinterability of commercial 8 mol% yttria-stabilized zirconia powders and the effect of sintered density on the ionic conductivity, J. Mater. Sci. 33 (1998) 4297–4305. doi:10.1023/A:1004435504482.
[25] Y.M. Hajar, H.A. Dole, M. Couillard, E.A. Baranova, Investigation of heterogeneous catalysts by electrochemical method: Ceria and titania supported iridium for ethylene oxidation, ECS Trans. 72 (2016) 161–172. doi:10.1149/07207.0161ecst.
[26] G. Kresse, J. Furthmiiller, Efficiency of ab-initio total energy calculations for metals and semiconductors using a plane-wave basis set, Comput. Mater. Sci. 6 (1996) 15–50. doi:10.1016/0927-0256(96)00008-0.
[27] G. Kresse, J. Hafner, Ab initio molecular dynamcis for liquid metals, Phys. Rev. B. 47 (1993) 558. doi:10.1103/PhysRevB.47.558.
[28] S.N. Steinmann, P. Sautet, Assessing a First-Principles Model of an Electrochemical Interface by Comparison with Experiment, J. Phys. Chem. C. 120 (2016) 5619–5623. doi:10.1021/acs.jpcc.6b01938.
[29] VASPsol, (n.d.). https://github.com/henniggroup/VASPsol/blob/ master/docs/USAGE.md. [30] K. Mathew, V.S.C. Kolluru, S. Mula, S.N. Steinmann, R.G. Hennig, Implicit
self-consistent electrolyte model in plane-wave density-functional theory, J. Chem. Phys. 151 (2019) 234101. doi:10.1063/1.5132354.
[31] Y.M. Hajar, L. Treps, C. Michel, E.A. Baranova, S.N. Steinmann, Theoretical insight into the origin of the electrochemical promotion of ethylene oxidation on ruthenium oxide, Catal. Sci. Technol. 9 (2019) 5915–5926. doi:10.1039/c9cy01421g.
[32] D. Theleritis, S. Souentie, A. Katsaounis, C.G. Vayenas, Hydrogenation of CO2 over Ru electropromoted catalysts, ACS Catal. 2 (2012) 770–780.
[33] G. Pacchioni, F. Illas, S. Neophytides, C.G. Vayenas, Quantum-chemical study of electrochemical promotion in catalysis, J. Phys. Chem. 100 (1996) 16653–16661. doi:10.1021/jp9612386.
[34] E.P.M. Leiva, C. Vázquez, M.I. Rojas, M.M. Mariscal, Computer simulation of the effective double layer occurring on a catalyst surface under electro-chemical promotion conditions, J. Appl. Electrochem. 38 (2008) 1065–1073. doi:10.1007/s10800-008-9539-x. [35] G. Pacchioni, J.R. Lomas, F. Illas, Electric field effects in heterogeneous catalysis, J. Mol.
Catal. A Chem. 119 (1997) 263–273. doi:10.1016/S1381-1169(96)00490-6. [36] S.N. Steinmann, C. Michel, R. Schwiedernoch, J.S. Filhol, P. Sautet, Modeling the
HCOOH/CO2 Electrocatalytic Reaction: When Details Are Key, ChemPhysChem. 16 (2015) 2307–2311. doi:10.1002/cphc.201500187.
[37] N.G. Hörmann, O. Andreussi, N. Marzari, Grand canonical simulations of electrochemical interfaces in implicit solvation models, J. Chem. Phys. 150 (2019).
doi:10.1063/1.5054580.
[38] M.M. Melander, M.J. Kuisma, T.E.K. Christensen, K. Honkala, Grand-canonical approach to density functional theory of electrocatalytic systems: Thermodynamics of solid-liquid interfaces at constant ion and electrode potentials, J. Chem. Phys. 150 (2019). doi:10.1063/1.5047829.
[39] R. Sundararaman, W.A. Goddard, T.A. Arias, Grand canonical electronic density-functional theory: Algorithms and applications to electrochemistry, J. Chem. Phys. 146 (2017). doi:10.1063/1.4978411.
[40] S.N. Steinmann, P. Sautet, C. Michel, Solvation free energies for periodic surfaces:
comparison of implicit and explicit solvation models, Phys. Chem. Chem. Phys. 18 (2016) 31850–31861. doi:10.1039/c6cp04094b.
[41] H. Zhang, W.A. Goddard, Q. Lu, M.J. Cheng, The importance of grand-canonical quantum mechanical methods to describe the effect of electrode potential on the stability of intermediates involved in both electrochemical CO2 reduction and hydrogen
evolution†, Phys. Chem. Chem. Phys. 20 (2018) 2549–2557. doi:10.1039/c7cp08153g. [42] M. Mamatkulov, J.S. Filhol, An ab initio study of electrochemical vs. electromechanical
properties: The case of CO adsorbed on a Pt(111) surface, Phys. Chem. Chem. Phys. 13 (2011) 7675–7684. doi:10.1039/c0cp01444c.
[43] S. González, C. Sousa, F. Illas, Electric field effects in the chemisorption of CO on bimetallic RhCu surface models, Surf. Sci. 548 (2004) 209–219.