HAL Id: hal-01196908
https://hal.inria.fr/hal-01196908
Submitted on 10 Sep 2015
HAL is a multi-disciplinary open access
archive for the deposit and dissemination of
sci-entific research documents, whether they are
pub-lished or not. The documents may come from
teaching and research institutions in France or
abroad, or from public or private research centers.
L’archive ouverte pluridisciplinaire HAL, est
destinée au dépôt et à la diffusion de documents
scientifiques de niveau recherche, publiés ou non,
émanant des établissements d’enseignement et de
recherche français ou étrangers, des laboratoires
publics ou privés.
Energy-Aware Server Provisioning by Introducing
Middleware-Level Dynamic Green Scheduling
Daniel Balouek-Thomert, Eddy Caron, Laurent Lefèvre
To cite this version:
Daniel Balouek-Thomert, Eddy Caron, Laurent Lefèvre. Energy-Aware Server Provisioning by
In-troducing Middleware-Level Dynamic Green Scheduling. HPPAC’2015, May 2015, Hyderabad, India.
�10.1109/IPDPSW.2015.121�. �hal-01196908�
Energy-Aware Server Provisioning by Introducing
Middleware-Level Dynamic Green Scheduling
Daniel Balouek-Thomert
∗†, Eddy Caron
†and Laurent Lef`evre
†∗NewGeneration-SR, Paris, France
†LIP Laboratory, UMR CNRS - ENS de Lyon - INRIA - UCB Lyon 5668
University of Lyon, France
{daniel.balouek-thomert, eddy.caron}@ens-lyon.fr, [email protected]
Abstract—Several approaches to reduce the power consump-tion of datacenters have been described in the literature, most of which aim to improve energy efficiency by trading off performance for reducing power consumption. However, these approaches do not always provide means for administrators and users to specify how they want to explore such trade-offs. This work provides techniques for assigning jobs to distributed resources, exploring energy efficient resource provisioning. We use middleware-level mechanisms to adapt resource allocation according to energy-related events and user-defined rules. A proposed framework enables developers, users and system ad-ministrators to specify and explore energy efficiency and perfor-mance trade-offs without detailed knowledge of the underlying hardware platform. Evaluation of the proposed solution under three scheduling policies shows gains of 25% in energy-efficiency with minimal impact on the overall application performance. We also evaluate reactivity in the adaptive resource provisioning.
Keywords: Distributed computing, energy-efficiency, work-load placement, resource provisioning
I. INTRODUCTION
IT systems have been relying on distributed computing to provide customers with the resources they need [1]. Many of the services that organizations utilize nowadays, depend on large computing infrastructures that are hosted either locally or at remote datacenters. A popular business model for renting out resources of a datacenter is provided by cloud computing, which enables customers to allocate computing, storage and network capacity over the Internet and pay by the hour of use. Though clouds benefit from savings derived from economies of scale, they often consume large amounts of energy to power and cool the datacenter on which they rely [2].
Although users of these centers are driven by factors such as cost and reliability, concerns about energy consumption have increasingly become common. In certain domains such as High Performance Computing (HPC), where efforts have tra-ditionally been made towards improving performance1, energy
consumption has become a key factor as it limits the growth and the ability of these systems to achieve the exascale [3].
This work tackles the challenges of specifying trade-offs in order to improve the energy efficiency of server provisioning and workload management. It introduces a metric allowing in-frastructure administrators to specify their preferences between performance and energy savings. We describe a framework for
1Within 20 years, the performance of the top supercomputer improved by
a factor of 100, http://www.top500.org.
resource management which provides control for informed and automated provisioning at the scheduler level while providing developers (administrator or end-user) with an abstract layer to implement aggregation and resource ranking based on contextual information such as infrastructure status, users’ preferences and energy-related external events occurring over time. We integrate our solution in the DIET [4] project which allows for managing heterogeneous nodes at the middleware layer. The evaluation is performed by means of simulations and real-life experiments on the GRID’5000 testbed. Results show improvements in energy efficiency with minimal impact on application and system performance.
II. BACKGROUND ANDRELATEDWORK
In this section we provide an overview of the DIET mid-dleware, used to validate the techniques proposed in this work, and discuss related work on energy efficiency and scheduling. A. The DIET Middleware
DIET is an open-source middleware that enables scalable the execution of applications via tasks that are scheduled on distributed resources using a hierarchy of agents. DIET
comprises several elements, including:
• Client application that uses theDIETinfrastructure for remote problem solving.
• Server Daemon (SED), which acts as a service provider exposing functionality through a standardized computational service interface. A single SED can offer any number of computational services.
• Agents, deployed alone or in a hierarchy, facilitate service location and invocation interactions between clients and SEDs. Collectively, a hierarchy of agents provides high-level and scalable services such as scheduling and data management. The head of a hierarchy is termed as Master Agent (MA) whereas the others are Local Agents (LA).
Applications are given a degree of control over the schedul-ing subsystem usschedul-ing plug-in schedulers (available in each agent) that use information gathered from resources via esti-mation functions (filled by each SED). When a SED receives a user request, by default it uses a pre-defined function to populate an estimation vector with system related information. A developer can create his own performance estimation
function and include it into a SED so that when the SED receives a user request, the custom function is called to populate an estimation vector.
These estimation vectors are used by agents to locate and invoke services required to execute a user application. Typically, a client request is made to a MA, which in turn broadcasts it to its agent hierarchy. This work describes the design of a newDIETplug-in scheduler to express information about servers performance and power consumption, which is then taken into account when servers are provisioned to applications. Estimation vectors are used to determine the suitability of different SEDs for executing the application while considering energy efficiency.
B. Related Work
Cloud computing infrastructures are seldom fully utilized [5], mostly as result of overprovisioning to handle peak de-mands. Workloads with large variations in demand can lead to periods of low resource utilization. As resources are generally not energy proportional [8], the energy efficiency of an infras-tructure is reduced during periods of low utilization [6]. Power saving techniques proposed to circumvent such problems con-sist in slowing down certain server components [7] during periods of light load — techniques that according to Le Sueur et al.are becoming less attractive on modern hardware [8] — or using software schemes to put idle servers into low power consumption modes [9]. These techniques are well suited to Clouds where virtualization is mainstream.
In more traditional infrastructures such as Grids [10] and clusters, shutting servers down is generally more difficult as management tools interpret powered-off resources as failures that can compromise the execution of services and applica-tions. Existing work in this domain used load concentration [11] and consolidation [12] when the nature of running tasks (or virtual machines) allows.
Moreover, existing work [13] commonly assume that nodes from a homogeneous cluster consume the same amount of power, which is not always true in practice. Due to their different uses, nodes from a cluster can present different ranges of performance and power consumption. Causes of such differences include external environment factors, such as temperature and node location in a rack, aging of hardware components due to intensive use and leakage power that varies over time [14] [15].
From a resource management perspective, Grids use meta schedulers to schedule jobs across multiple sites and local re-source managers that control compute rere-sources at a site level. Users commonly submit batch jobs to request resources over a period [16]. Cloud aggregators such as RightScale2 provide application-specific Cloud management and load balancing. At an application level, distributed OS such as [17] offer programming models that allow OS services to scale to match demand. Most of these systems, however, neither take energy efficiency into account nor offer means for users to specify how they want to schedule their applications while exploring trade-offs between energy efficiency and performance [18].
2Rightscale: http://www.rightscale.com/
Hsu et al. compared several metrics in [19] and concluded that the performance-power ratio was appropriate to represent energy efficiency. A metric to aggregate the energy efficiency of all components of a system in a single number has been proposed in [20], using benchmarks which produces different metric as output.
III. FRAMEWORK FORMIDDLEWARE-LEVEL
GREENSCHEDULING
We aim to provide a framework for resource management that provides control for informed and automated provisioning at the scheduler level. The framework provides developers (administrator or end-user) with an abstract layer to implement aggregation and resource ranking based on contextual infor-mation such as infrastructure status, users preferences, and the energy-related external events that can occur over time.
The proposed framework establishes relationships between the physical infrastructure and its logical behavior. We consider that the sizing and selection of computing nodes must balance the user’s requirements expressed in requests and the provider’s (who manages the physical machines). We aim to offer the ability for users and providers to express levels of preference between energy consumption and performance when allocating resources. This section describes the metric used to rank resources, how it is incorporated into DIET, and how the proposed framework handles energy related events (e.g. energy price changes and overheating) and server selection.
A. Metric and Infrastructure for Workload Placement The overall energy that a system consumes is highly influenced by how resources are assigned to task execution. Administrators can control the level of performance required and prioritize energy-efficient resources under certain scenar-ios. Factors such as idle consumption of nodes [15], use rate [21] or power specifications [22] can be taken into account to select nodes for performing tasks. We consider the node’s efficiency during active periods, propose a metric termed as GreenPerfto sort available computing nodes according to their power consumption, and use a secondary parameter, hereafter considered to be the node’s performance.
GreenPerf metric seeks to optimize power consumption while maintaining throughput requirements imposed by the application. We evaluate the trade-offs between reducing en-ergy consumption and matching performance objectives. We consider a problem with independent tasks on heterogeneous computing nodes whose power consumption is monitored and assume that tasks are not assigned priorities. Using the ratio:
Power Consumption Performance
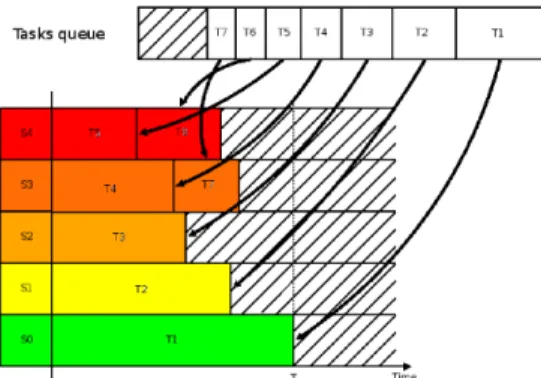
of each computing server, a ranking of available nodes is defined. Figure 1 depicts a simple example with 5 servers and 7 tasks, where the most energy-efficient servers are given priority; S0 being the “best” server under the GreenPerf metric. To compute GreenPerf, information on power consumption and performance of each server must be obtained. Two ap-proaches are possible to determine the power consumption of servers when executing a type of service/task. The first, a static method, would require benchmarking nodes by computing a
Fig. 1. Example of task placement using the GreenPerf metric.
job on each node, measuring the energy spent to complete it, and then dividing the amount of energy by time. This method may not be accurate over long periods since the power a machine consumes may vary according to recent load and its physical location in a rack. We hence favor a second, more dynamic approach, where the energy consumed by a server while computing a number of past requests is used to compute its average power consumption. It hence results on a value based on recent activity rather than on an initial benchmark.
These metrics are incorporated intoDIET SED to populate its estimation vector using new tags. Every time a client submits a request for a specific application, each server retrieves its energy consumption over the execution of all past requests. Once this information is collected, servers are advised to populate and forward an estimation vector to the distributed scheduler (a scheduler tree in the case ofDIET for scalability reasons), which in turn uses an aggregation method to sort server responses according to the GreenPerf metric (i.e. an instance of a DIET’s plug-in scheduler) and select the appropriate resource to execute the client request. Each DIET
agent of the hierarchy performs the selection following the plug-in scheduler.
The steps of the scheduling process are detailed as follows: 1) Problem submission:a client issues a request describ-ing a problem. If no server is able to solve it, an error message is returned.
2) Request propagation: the Master Agent communi-cates with all agents to forward the request to ap-propriate SEDs.
3) Collection of estimation vectors: each server com-putes and gathers its performance and power con-sumption metrics. A reply containing an estimation vector is sent back to one agent at the upper layer (and so on until a list of candidates is received at the master agent).
4) Sorting of candidates:at each level of the hierarchy, agents retrieves estimation vectors and proceeds to sort servers according to a specific criterion. Selected servers along with their estimation vector are gathered by the Master Agent. At the end (at the Master Agent level), the first SED from the resulting list is then
elected and notified.
5) Problem solving:the client contacts the elected SED, which starts computing the problem.
B. Expressing Provider and User Preferences
Providers indicate their preference about the energy effi-ciency of the infrastructure according to specific periods of time or events. It enables the management of budget limits and can be used to take advantage of fluctuations in energy price or prevent intensive use of specific machines.
We model a provider’s preference according to:
• Resource usage forecast: using historical data to iden-tify patterns and ensure the responsiveness of the platform during peak periods.
• Electricity costs: minimizing the cost of computation by using low cost periods.
We define the provider preference as a weighted average between resource usage and electricity cost. Let c be the cost of electricity defined as a ratio between the cost over a given period and the theoretical maximum cost, and u be the resource utilization defined as a ratio between the energy consumption over a given period and the total consumed energy.
Let c, u ∈ [0, 1] for each time period:
P ref erenceprovider(u, c) → α(1 − c) + βu (1)
We obtain a P ref erenceprovider(u, c) ∈ [0, 1]. By
ad-justing the multiplying factors α, β, one can favor a specific metric. The higher the value of P ref erenceprovider(u, c), the
larger the number of available servers for a time period. A user interest to take energy efficiency into account when executing an application is defined by P ref erenceuser, which
is set during request submission as
P ref erenceuser
−1 : maximize performance 0 : no preference
1 : maximize energy efficiency (2) Under P ref erenceuser = 1, a user favors the
maximiza-tion of energy efficiency. In practice, however, it is better to restrict the value to [−0.9, 0.9] because if all users choose 1, it would result in waiting queues on the most energy-efficient nodes. The user preference is then weighted by the administrator’s as follows:
(Pprovider, Puser) ⇔ Pprovider(Puser− 1) (3)
C. Management of Power Events and Server Selection The proposed framework aims to adapt resource provision-ing accordprovision-ing to energy-related events, such as fluctuations of energy cost or heat peaks. We propose to use provisioning planning as a mechanism to facilitate monitoring of utilization metrics over time. This enables the scheduler to perform operations in an autonomic fashion before executing placement and/or provisioning decisions with consideration of thresholds. This information can be obtained by predicting future usage from historical data, checking schedules provided by the energy provider or using the infrastructure monitoring system.
We consider that administrators set limits to the number of active nodes in case of out-of-range values according to the following variables:
• Cost of energy for a given time period • Temperature conditions.
Using these variables, the scheduler forecasts the future resource usage to adapt the number of available nodes for computation. We call these resources candidate nodes.
When handling energy events, the scheduling process de-scribed in Section III-A is adjusted as follows:
1) Master Agent receives a request describing a task and a value for P ref erenceuser.
2) A request is propagated and estimation vectors are retrieved.
3) The scheduler checks the temperature and energy costs thresholds defined by the administrator and adjusts the number of candidate nodes according to P ref erenceprovider(u, c).
4) The list of candidates is sorted according to the scheduling criteria (at each level of hierarchy of agents).
5) When the Master Agent is reached, the candidates remaining is returned to the client.
To select the appropriate node based on a client request, we consider the ability to estimate the duration of pending tasks. The following information is assumed to be known for each server at any time:
fs Number of FLoating-point Operations Per Second
(FLOPS) for the server s
cs Average power consumption when the server s is
fully loaded (Watts).
bcs Consumption during the boot process of server s
(Watts).
bts Boot time for server s (seconds).
ws Estimation of tasks waiting queue on server s
(seconds). P P ref erenceuser
ni Number of FLOPS to perform the task i.
The knowledge of these variables enables the scheduler to consider inactive nodes in the decision process and thus evaluate the costs of turning servers on if necessary. The execution time of a task i is defined by the number of operations and the performance of server s is (nif
s). Both the
total computation time and the energy consumed to perform a task depend on the state of the assigned server at the moment of the scheduling decision. The computation time (4) and energy consumption (5) of a task i on a server s can be divided into two cases, depending on the state of the server.
computation time = ( ws+nfsi active server bts+nfsi inactive server (4) energy consumption= ( cs×nif s active server bts× bcs+ cs×nfss inactive server (5)
Using these two functions, the scheduler can assign a score Sc to each server and establish a sorting (6).
Sc : P → (computation time )
2
P +1−1× (consumptionenergy ) (6)
This score is coherent with our expectations re-garding the previous definitions of P ref erenceuser and
P ref erenceprovider (7):
Sc : P → −0.9 ⇒ Sc ∼computation time P → 0 ⇒ Sc ∼ (computation time ) × ( energy consumption) P → 0.9 ⇒ Sc ∼energy consumption (7) When creating a list of candidate nodes, we aim to min-imize the total energy consumed by the active servers by maximizing the use of the most energy efficient servers. We do not consider any bound for makespan and assume that servers have steady performance. We use a greedy algorithm for selecting candidate servers with the objective of minimizing the power consumed by servers (Algorithm 1).
Let T be the list of servers sorted according to GreenPerf, RES be the result set of servers, PT otal be the accumulated
power of each server and Prequired be the required power
among the candidate nodes.
Algorithm 1: Selection of candidate servers considering a power consumption cap.
1 PT otal← 0 2 for server ∈ T do
3 PT otal+ = server.get power() 4 end
5 Prequired← P ref erenceprovider× PT otal 6 P ← 0
7 RES ← []
8 while P < Prequireddo
9 P + = T .get f irst element().get power() 10 RES.add(T .get f irst element())) 11 T .remove f irst element() 12 end
13 return RES
IV. EXPERIMENTALSETUP ANDRESULTS
Experiments used resources from GRID’5000, a testbed designed to support experiment-driven research in parallel and distributed systems. Located in France, GRID’5000 comprises 29 heterogeneous clusters, with 1,100 nodes, 7,400 CPU cores with various generations of technology spanning 10 physical sites interconnected by a dedicated 10 Gbps backbone network. By providing bare-metal resource deployment, GRID’5000 enables users to experiment on all layers of the software stack of distributed infrastructures, including high-performance com-puting, grids, peer-to-peer, and cloud computing architectures. The power measurement in the studied clusters is per-formed with an energy-sensing infrastructure composed of external wattmeters produced by the SME Omegawatt. This energy-sensing infrastructure, also used in previous work [23], collects at every second the power consumption in watts of each monitored node [24]. A node’s consumption is deter-mined by averaging past consumption over more than 6,000
measurements, whereas its performance is given by the number of FLOPS achieved when using all CPU cores to execute benchmarks are using ATLAS3,HPL4 and Open MPI5. A. Workload Placement
The first evaluation aims to compare the distribution of tasks among nodes on GRID’5000 considering three different policies, namely PERFORMANCE, POWER and RANDOM. PERFORMANCE and POWER correspond, respectively, to giving priority to the fastest and to most energy-efficient nodes to hence establishing the bounds of the GreenPerf metric. The RANDOM policy selects servers at random.
A client submits a set of tasks, wherein a single task is a CPU-bound problem which consists in 1e8 successive additions, enabling the distinction of nodes in terms of per-formance. As each task uses a single core, a server cannot execute a number of tasks greater than its number of cores.
TABLE I. EXPERIMENTALINFRASTRUCTURE.
Cluster Nodes CPU Memory Role Orion 4 2x6cores @2.30Ghz 32GB SED Sagittaire 4 2x1core @2.40Ghz 2GB SED Taurus 4 2x6cores @2.30Ghz 32GB SED Sagittaire 1 2x1core @2.40Ghz 2GB MA Sagittaire 1 2x1core @2.40Ghz 2GB Client
The total number of client requests depends on the number of available cores. We consider a number of 10 client requests per available core in this experiment.
The temporal distribution of jobs contains a burst phase, when the client submits r simultaneous requests and a con-tinuous phase when the client submits requests at an arbitrary rate of two requests/second.
We deploy the DIET middleware on 14 physical nodes as follows: 12 dedicated nodes for SED’s, 1 dedicated node for the Master Agent and 1 dedicated node for the Client. The machines are picked among three different clusters as presented in Table I. The nodes are connected to a switch with a bandwidth of 1Gbit/s and run the Debian Wheezy operating system.
Considering that the scheduler does not have specific information on the nodes and does not make assumptions about the hardware, the dynamic information is gathered as tasks are computed by the servers. Figures 2, 3 and 4 show the results of this experiment. The x-axis presents the different nodes available to solve the problem; the y-axis shows the number of tasks executed by the node.
Figure 2 shows the distribution according to energy con-sumption. We observe that most jobs are computed by Taurus nodes, which appear to be the most energy-efficient. Execution
3Automatically Tuned Linear Algebra Software: http://sourceforge.net/
projects/math-atlas/
4Portable Implementation of the High-Performance Linpack Benchmark for
Distributed-Memory Computers: http://www.netlib.org/benchmark/hpl/
5High Performance Message Passing Library: http://www.open-mpi.org/
Fig. 2. Tasks distribution using power consumption as placement criterion.
on Orion and Sagittaire occurs during the “learning” phase or when Taurus nodes are overloaded.
Fig. 3. Tasks distribution using performance as placement criterion.
Figure 3 shows the distribution of tasks when performance is the criterion for selecting a node. The load balancing of jobs is similar to Figure 2, with the majority of tasks executed on Orion nodes. In Figure 4, despite a random distribution of jobs, Sagittaire nodes compute less tasks than other nodes. That is explained by the fact that a single task is computed slower on those nodes, thus, they are less frequently available when decisions are made.
Fig. 4. Tasks distribution with random placement.
Figure 5 presents the energy consumption of the whole infrastructure grouped by clusters. The energy consumption measured on the DIET agents was constant when executing
Fig. 5. Energy consumption per cluster.
the three algorithms and does not present any influence on the comparison. We can observe that distributing the workload using the RANDOM policy is not particularly energy efficient as it guarantees that all the resources are in use during the experiment.
TABLE II. EXPERIMENTALRESULTS
RANDOM POWER PERFORMANCE Makespan (s) 2,336 2,321 2,228
Energy (J) 6,041,436 4,528,547 5,618,175
Table II compares makespan and energy consumption met-rics among the scheduling policies. Considering performance, the best case is giving priority to nodes with higher number of FLOPS (PERFORMANCE). Comparing that value with the POWER makespan, we noticed a loss of performance of up to 6%. In terms of energy consumption, POWER presents a gain of 25% when compared to RANDOM, and up to 19% compared to PERFORMANCE.
RANDOM appears to be the worst case because it ensures that all the nodes are in use, resulting in higher energy consumption. The use of slow nodes is also impacting the performance, but this effect is hidden by the fact that fast nodes will compute more tasks in parallel.
B. GreenPerf evaluation
We evaluate the GreenPerf metric as a means to establish the relevancy of the ratio Power ConsumptionPerformance in high and low het-erogeneity environments. We use a simulation to manage the level of heterogeneity. After performing an initial benchmark on the physical nodes of GRID’5000, we obtained for each server its mean computation time for a single task along with its peak and idle power consumptions. These values are used to compute the energy consumed by the whole infrastructure dur-ing the simulations. Each task is computed with the maximal performance and power of the servers. During the simulation, each server is limited to the computation of one task.
Figure 6 shows the comparison of metrics for a low hetero-geneity environment. In this scenario, we use 2 different types of servers with similar specifications (Table I). The coordinates of G, GP and P represent the average values obtained of,
Fig. 6. Comparison of metrics with 2 different types of servers and 2 clients submitting requests.
respectively, the POWER, GreenPerf and PERFORMANCE metrics. The shadings represent the area of RANDOM values. In a second scenario, we consider two other types of clusters (Table III) to increase the heterogeneity of the plat-form. Figure 7 shows a better tradeoff between POWER and PERFORMANCE, highlighting the need for a sufficient diversity of hardware to efficiently use GreenPerf.
Fig. 7. Comparison of metrics with 4 different types of servers and 2 clients submitting requests.
TABLE III. ENERGY CONSUMPTION OF SIMULATED CLUSTERS
Cluster Idle consumption Peak consumption
Sim1 190 230
Sim2 160 190
C. Adaptive Resource Provisioning
The third experiment intends to demonstrate the reactivity of the scheduler by considering fluctuations of two metrics over time, namely the cost of electricity and temperature. We inject energy-related events at the scheduler level while a client, aware of the number of available nodes, submits a continuous flow of requests intending to reach the capacity of the infrastructure. Requests are scheduled as they arrive to ensure dynamicity.
For the sake of simplicity, the cost of energy is defined as a ratio between the cost over a given period and the theoretical
maximum cost. Related to the cost of energy, we defined three states:
• Regular time, when the electricity cost is the highest (1.0).
• Off-peak time 1, when the electricity cost is less expensive than during regular time (0.8).
• Off-peak time 2, when the electricity cost is the least expensive (0.5).
Heat measurements are defined through two states, de-pending of the temperature of utilization: in-range temperature (< 25 degrees) and out-of-range temperature (> 25 degrees).
The status of the platform corresponds to the value of the exploited metrics at t time. The master agent checks the status of the platform every 10 minutes, with the ability to get information about the scheduled events occurring at t + 20. Figure 8 presents a sample of provisioning planning, which is a shared XML file using a readers-writers lock that refers to a specific time-stamp. For each sample, we defined three tags, namely temperature, candidates and electricity cost. At each time interval, the scheduler performs decisions according to the value of the tags. Thus, future information, such as forecasts, can be added to the provisioning planning, ensuring a dynamic behavior regarding to the various contexts. The tags and time interval are customizable variables that can be adjusted to fit specific contexts. <timestamp value="1385896446"> <temperature>23.5</temperature> <candidates>8</candidates> <electricity_cost>0.6</electricity_cost> </timestamp>
Fig. 8. Sample of the server status.
We set thresholds whose values trigger the execution of actions. Actions can be defined through scripts or commands to be called by the scheduler. In this example, we implemented five behaviors associated with the experiment metrics. Let c be the cost of energy for a given period and T the temperature measured at t.
• if T > 25 then candidate nodes = 20% of all nodes • if 1.0 ≥ c > 0.8 then candidate nodes = 40% of all
nodes
• if 0.8 ≥ c > 0.5 then candidate nodes = 70% of all nodes
• if c < 0.5 then candidate nodes = 100% of all nodes Four different types of events are injected in the provision-ing plannprovision-ing made by the scheduler. These events, in turn, fall into two categories, namely scheduled and unexpected. Figure 9 presents how the number of candidate nodes and the energy consumption evolve over time. The left y-axis shows the total number of nodes in the infrastructure; The plain line presents the number of candidates during the experiment; The line with crosses is the evolution of the energy consumption, using the right y-axis. Each cross describes an average value of energy consumption measured during the previous 10 minutes. The x-axis represents the time with a total of 260 minutes.
Fig. 9. Evolution of candidate nodes and power consumption.
The infrastructure is deployed on GRID’5000, on the nodes defined in Table I. The experiment starts with an energy cost of 1.0 and a P ref erenceprovider(u, c) giving priority
to energy-efficient nodes. The P ref erenceuser is not having
any influence in the current scenario as the client dynamically adjusts its flow of request to reach the capacity of available nodes.
Event 1 (scheduled) is a decrease of the electricity cost occurring at t + 60 min. The Master Agent becomes aware of the information at t + 40 min. Observing a future cost of 0.8, the agent plans ahead to provide 8 candidates nodes at t + 60 min. The set of candidates is incremented slowly to obtain a progressive start, at t + 50 min and t + 60 min. (It avoids heat peaks due to side effect of simultaneous starts.) We observe a linear increase of electric consumption through the infrastructure. After each request completion, the client is notified of the current amount of candidates nodes, and is free to adjust its request rate.
Event 2 (scheduled), similar to Event 1; the electricity cost allows the use of every available node in the architecture. The nodes are added to the set of candidates during the following 20 minutes, resulting in a use of all possible nodes between t + 120 and t + 160 min.
Event 3 (unexpected) simulates an instant rise of tempera-ture, detected by the Master Agent at t + 160 min. According to administrator rules, the predefined behavior is to reduce the number of candidates nodes to 2. It is performed in 3 steps, in order to cause a drop of heat and energy consumption. We allow tasks in progress to complete, resulting in a delayed drop of energy consumption. The system keeps on working with 2 candidates until an acceptable temperature is measured at t + 240 min (Event 4 (unexpected)). The master agent then starts to provision the pool of candidates every 10 minutes to reach again the value of 12.
The scenario of this experiment shows the reactivity of the scheduler and its ability to manage energy-related events by adapting dynamically the number of provisioned resources of the physical infrastructure, therefore the power consumption.
V. CONCLUSIONS ANDPERSPECTIVES
Due to the increasing number and size of datacenters required to host current services, efficient workload placement considering energy efficiency is becoming a major concern. Previous research typically address this problem through power management techniques that aim at maximizing the utilization of resources.
In this work, we proposed methods for provisioning re-sources and distributing requests with the objective of meeting performance requirements while reducing energy consumption. We validate our strategy through experiments using the DIET
toolkit and the GRID’5000 experimental testbed. Comparing three different scheduling policies by enabling users and providers specify trade-offs between performance and energy consumption, results show a reduction of energy consumption of 25% with a minor performance loss (6%).
We propose and evaluate a hybrid metric taking into ac-count performance and power consumption as a ratio of energy efficiency. The effectiveness of this metric strongly relies on the heterogeneity of servers. The work also considered the provisioning of resources, while taking into account energy-related events and user preferences. Results show a reactive scheduling, allowing policy management to be abstracted into a software layer that can be automated and controlled centrally. We expect this approach to be very useful when applied to provisioning servers, using contextual data from third-party predicting or monitoring tools.
Future work will revolve around fine-grained scheduling by taking into account spatial information. We intend to lever-age control over energy consumption by considering budget constrained scheduling.
ACKNOWLEDGEMENTS
Experiments presented in this paper were carried out using the GRID’5000 experimental testbed, developed under Inria ALADDIN development action with support from CNRS, RENATER and several Universities as well as other funding bodies6.
REFERENCES
[1] I. Foster and C. Kesselman, “Computational grids,” in Vector and Parallel ProcessingVECPAR 2000. Springer, 2001, pp. 3–37. [2] J. Dongarra et al., “The International Exascale Software Project
roadmap,” The International Journal of High Performance Computing Applications, vol. 25, no. 1, pp. 3–60, Feb. 2011.
[3] W. chun Feng et al., “Green supercomputing comes of age,” IT Professional, vol. 10, no. 1, pp. 17–23, 2008.
[4] E. Caron and F. Desprez, “DIET: A scalable toolbox to build network enabled servers on the grid,” International Journal of High Performance Computing Applications, vol. 20, no. 3, pp. 335–352, 2006.
[5] A. Hawkins, “Unused servers survey results analysis,” The Green Grid, 2010.
[6] A.-C. Orgerie, M. D. d. Assuncao, and L. Lef`evre, “A survey on techniques for improving the energy efficiency of large-scale distributed systems,” ACM Computing Surveys (CSUR), vol. 46, no. 4, p. 47, 2014. [7] D. C. Snowdon, S. Ruocco, and G. Heiser, “Power management and dynamic voltage scaling: Myths and facts,” in Proceedings of the 2005 Workshop on Power Aware Real-time Computing, Sep. 2005.
6The GRID’5000 testbed. http://www.grid5000.fr
[8] E. Le Sueur and G. Heiser, “Dynamic voltage and frequency scaling: The laws of diminishing returns,” in Proceedings of the 2010 interna-tional conference on Power aware computing and systems. USENIX Association, 2010, pp. 1–8.
[9] A. Beloglazov and R. Buyya, “Managing overloaded hosts for dynamic consolidation of virtual machines in cloud data centers under quality of service constraints,” IEEE Trans. Parallel Distrib. Syst, vol. 24, no. 7, pp. 1366–1379, 2013.
[10] I. Foster et al., “Cloud computing and grid computing 360-degree compared,” CoRR, vol. abs/0901.0131, 2009.
[11] F. Hermenier, N. Loriant, and J.-M. Menaud, “Power management in grid computing with xen,” in Proceedings of the 2006 International Conference on Frontiers of High Performance Computing and Network-ing, ser. ISPA’06. Berlin, Heidelberg: Springer-Verlag, 2006, pp. 407– 416.
[12] A.-C. Orgerie and L. Lef`evre, “When Clouds become Green: the Green Open Cloud Architecture,” Parallel Computing, vol. 19, pp. 228 – 237, 2010. [Online]. Available: http://hal.inria.fr/ensl-00484321 [13] K. H. Kim, R. Buyya, and J. Kim, “Power aware scheduling of
bag-of-tasks applications with deadline constraints on DVS-enabled clusters,” in CCGRID. IEEE Computer Society, 2007, pp. 541–548.
[14] G. Varsamopoulos, A. Banerjee, and S. K. S. Gupta, “Energy ef-ficiency of thermal-aware job scheduling algorithms under various cooling models,” in Contemporary Computing - Second International Conference, IC3 2009, Noida, India, August 17-19, 2009. Proceedings, ser. Communications in Computer and Information Science, vol. 40. Springer, 2009, pp. 568–580.
[15] M. E. M. Diouri et al., “Your cluster is not power homogeneous: Take care when designing green schedulers!” in IGCC-4th IEEE Interna-tional Green Computing Conference, 2013.
[16] N. Capit and al., “A batch scheduler with high level components,” in Cluster computing and Grid 2005 (CCGrid05), 2005.
[17] D. Wentzlaff et al., “An operating system for multicore and clouds: Mechanisms and implementation,” in Proceedings of the 1st ACM Symposium on Cloud Computing, ser. SoCC ’10. New York, NY, USA: ACM, 2010, pp. 3–14.
[18] C.-Y. Tu, W.-C. Kuo, W.-H. Teng, Y.-T. Wang, and S. Shiau, “A power-aware cloud architecture with smart metering,” in Proc. Second International Workshop on Green Computing (2nd GreenCom’10), 2010 International Conference on Parallel Processing Workshops (39th ICPPW’10) CD-ROM. San Diego, CA: CPS/IEEE Computer Society, Sep. 2010, pp. 497–503.
[19] C.-H. Hsu et al., “Towards efficient supercomputing: A quest for the right metric,” in Parallel and Distributed Processing Symposium, 2005. Proceedings. 19th IEEE International. IEEE, 2005, pp. 8–pp. [20] B. Subramaniam and W.-c. Feng, “The green index: A metric for
evaluating system-wide energy efficiency in hpc systems,” in Parallel and Distributed Processing Symposium Workshops & PhD Forum (IPDPSW), 2012 IEEE 26th International. IEEE, 2012, pp. 1007– 1013.
[21] S.-H. Lim et al., “A dynamic energy management scheme for multi-tier data centers,” in ISPASS. IEEE Computer Society, 2011, pp. 257–266. [22] M. Polverini et al., “Thermal-aware scheduling of batch jobs in geo-graphically distributed data centers,” Cloud Computing, IEEE Transac-tions on, vol. 2, no. 1, pp. 71–84, Jan 2014.
[23] M. D. De Assuncao, A.-C. Orgerie, and L. Lef`evre, “An analysis of power consumption logs from a monitored grid site,” in Green Computing and Communications (GreenCom), 2010 IEEE/ACM Int’l Conference on & Int’l Conference on Cyber, Physical and Social Computing (CPSCom). IEEE, 2010, pp. 61–68.
[24] M. D. De Assuncao et al., “The green grid’5000: Instrumenting and using a grid with energy sensors,” in Remote Instrumentation for eScience and Related Aspects. Springer, 2012, pp. 25–42.