HAL Id: tel-02119191
https://tel.archives-ouvertes.fr/tel-02119191
Submitted on 3 May 2019HAL is a multi-disciplinary open access
archive for the deposit and dissemination of sci-entific research documents, whether they are pub-lished or not. The documents may come from teaching and research institutions in France or abroad, or from public or private research centers.
L’archive ouverte pluridisciplinaire HAL, est destinée au dépôt et à la diffusion de documents scientifiques de niveau recherche, publiés ou non, émanant des établissements d’enseignement et de recherche français ou étrangers, des laboratoires publics ou privés.
Etude de l’impact des procédés d’assistance médicale à
la procréation sur la régulation des gènes soumis à
l’empreinte et des séquences répétées dans le placenta et
le sang de cordon chez l’homme
Cecile Choux
To cite this version:
Cecile Choux. Etude de l’impact des procédés d’assistance médicale à la procréation sur la régula-tion des gènes soumis à l’empreinte et des séquences répétées dans le placenta et le sang de cordon chez l’homme. Génétique humaine. Université Bourgogne Franche-Comté, 2018. Français. �NNT : 2018UBFCI004�. �tel-02119191�
Etu
Thè
Com
Mme Mme Mr D Mme Mr PPREPAREE
ude
de
sur
la r
répét
se
présenté
mposition
du
Hélène JAMM Sandrine BAR David MONK Patricia FAU Paul SAGOTDE
L’E
AU
LABOR
l’impac
égulatio
tées
dan
ée
et souten
u
Jury :
MES RBAUX UQUEETABLISSEM
RATOIRE
GE
t
des pr
on
des g
ns
le pla
nue
à Dijon,
Directrice Chargée d Principal Professeu ProfesseuTHESE
MENT
UNIV
NETIQUE
D
Ecole
Enviro
Doctorat
M
merocédés
gènes
so
acenta
e
,
le 14 décem
e de recherche de recherche, investigator, I ur, Université ur, UniversitéDE
DOC
ERSITE
BOU
DES
ANOMA
e
doctorale
onnements
de
Biologie
Par
Cécile
CH
s
d’assis
oumis
à
et
le san
mbre
2018
e, INRA, Jouy Institut Cochi IDIBELL, Ba Bourgogne Fr Bourgogne FrCTORAT
URGOGNE
F
ALIES
DU DE
n°554
‐ Santé
e
Cellulaire
HOUX
stance
m
à
empre
ng
de co
y en Josas in, Paris arcelona ranche-Comté ranche-ComtéFRANCHE
‐C
EVELOPPEM
médicale
einte
et
ordon
ch
P R E é, Dijon D é, Dijon CCOMTE
MENT
(INSE
e
à la pr
des
séq
hez
l’Ho
Président/Rapp Rapporteur Examinateur Directeur de th Codirecteur deRM
U1231)
rocréati
quences
omme
porteur hèse e thèse
)
ion
s
2
A ma Directrice de Thèse,
Madame le Professeur Patricia FAUQUE,
Vous me faites l’honneur de m’accompagner dans ma carrière médicale et
scientifique depuis plusieurs années maintenant. Vous m’avez confié ce travail et
toujours guidée, soutenue et encouragée dans sa réalisation.
Veuillez trouver ici le témoignage de mon profond respect et de ma très sincère
gratitude.
A mon co-directeur de Thèse,
Monsieur le Professeur Paul SAGOT,
Vous m’avez accompagnée et aidée tout au long de la réalisation de cette thèse et
depuis le début de ma carrière en Gynécologie-Obstétrique. Votre rigueur et votre
exigence ont conditionné ma formation, j’ai beaucoup appris grâce à vous. Votre
soutien y compris dans les moments difficiles qui ont ponctué cette première année
de clinicat m’a beaucoup apporté et je vous en remercie.
Aux membres du Jury,
Madame le Docteur Sandrine BARBAUX, vous me faites l’honneur de juger ce
travail. On ne se connait pas encore mais le résultat de vos travaux dans le domaine
de l’épigénétique du placenta, et notamment sur le retard de croissance intra-utérin
et la prééclampsie, est impressionnant.
Veuillez trouver ici l’expression de ma sincère gratitude et de mon profond respect.
Madame le Docteur Hélène Jammes, je vous remercie d’avoir accepté de juger ce
travail. Je connais votre rigueur médicale et scientifique et admire l’étendue de vos
travaux dans le domaine de l’épigénétique du placenta chez l’Homme et dans
différentes espèces animales.
Veuillez trouver ici le témoignage de ma sincère gratitude et de mon profond respect.
Doctor Dave MONK, you welcomed me into your team in Barcelona for one year,
and gave me the opportunity to learn new techniques and new way of working. You
helped me so much, always with patience and efficacy. You also participated in
writing the article on histones.
A Maxime,
Pour la joie de partager ma vie avec toi depuis plus de 10 ans. Pour ton soutien, ta
tendresse, ton amour et tous les moments de bonheur passés, présents et à venir.
Pour ton aide précieuse dans les moments difficiles. Je t’aime.
A Gaspard,
Tu illumines notre existence depuis ta naissance par ta présence toujours enjouée et
optimiste. Ta joie de vivre me donne le sourire tous les matins. Je t’aime fort fort fort,
jusqu’aux galaxies les plus lointaines.
A Numérobis,
Nous t’attendons avec papa et Gaspard depuis plusieurs mois déjà, nous avons hâte
de faire ta connaissance et de te donner notre amour.
A mes Parents,
Pour les valeurs essentielles que vous m’avez transmises. Pour votre soutien, votre
écoute, votre amour inconditionnel et tous les moments de bonheur passés, présents
et à venir. Voyez en cette thèse l’expression de mon amour et de ma
reconnaissance.
A mes frères,
J’ai toujours plaisir à vous retrouver à Lille, à Paris ou à la maison. Merci de m’avoir
appris à ne pas me laisser marcher sur les pieds dans la vie.
A Sabine,
Merci de supporter le frangin tous les jours, votre complicité fait plaisir à voir.
A mes mamies,
Pour tous les souvenirs et les moments de bonheur que vous m’avez apportés, merci
d’avoir été là pour m’aider à grandir dans la joie, la bonne humeur et le respect des
autres. Vous me manquez.
6
A Tatie Véro,
Merci pour ton dynamisme et ton humour, merci de m’avoir toujours accueillie les
bras ouverts pour des vacances pleines d’activités, de bonsaïs, de chats et d’une
bonne dose de fous rires.
A Christophe et ses filles,
Merci d’avoir toujours cru en moi, merci pour votre admiration, que je maintiens ne
pas mériter.
A Aleth et Pascal,
Des beaux-parents bienveillants et des grands-parents dynamiques. Merci pour votre
enthousiasme sans faille, votre soutien et votre affection.
A Renaud, Clémentine et Agathe, à Fanny et Martin,
Pour tous ces bons moments passés et à venir, c’est toujours un plaisir de vous
retrouver. C’est un vrai bonheur de voir ma petite filleule grandir avec autant de joie
de vivre. En témoignage de mon affection.
A mes fleurs,
Mes manouches, mes coupines, merci d’avoir toujours été là dans les moments de
joie, merci d’avoir cru en moi. Même si on ne se voit pas assez, c’est toujours un
immense plaisir de vous retrouver, avec toujours la même impression qu’on ne s’est
jamais quittées.
A mes amis,
Estelle,
pour ton dynamisme et pour nos soirées toujours sympathiques.
Ced,
pour ton humour détonnant.
Justinette,
pour ta franchise et tes bonnes idées de sorties et de week-ends.
Emy,
pour nous trouver toujours des trucs sympas à faire entre copines !
7
A mes collègues de la mat’,
Julie,
merci pour nos délires, notre entente détonante et ta confiance sans faille !
J’admire beaucoup ton travail et tes compétences et c’est toujours un plaisir de te
retrouver dans THE bureau.
Maëva,
merci pour tes conseils toujours bienveillants durant cette difficile première
année de clinicat, c’est toujours un immense plaisir de travailler à tes côtés tu es
douée et hyper compétente. Et surtout merci te rester toujours droite dans tes bottes
et de vouloir toujours que la vérité triomphe ;-).
Micmic,
merci pour ton calme et ton humour pinçant, c’est toujours un plaisir de se
retrouver.
Nico,
merci pour ton apparente mauvaise humeur un peu déroutante mais qui cache
un super tempérament !
Céline et Julie,
merci à vous qui comprenez les aléas de la recherche ;-) et du
parcours scientifique en général.
Merci à tous mes autres collègues.
A l’équipe «GAD»,
Merci pour votre accueil et votre aide toujours précieuse.
Virginie, m
erci ma 2
èmemaman de m’avoir TOUT appris de la Science avec un grand
S, tu as su rester patiente et calme malgré mes boulettes. Merci pour notre amitié qui
dure maintenant depuis un petit bout de temps, c’est toujours un plaisir de se
retrouver autour d’une bonne raclette ;-).
Magali,
notre technicienne en or. On ne se connait pas depuis très longtemps mais
ton efficacité et ta bonne humeur n’ont pas mis longtemps à me convaincre. Merci
pour ton aide précieuse dans la réalisation de cette thèse.
Benjamin Tournier et l’équipe du pyro,
merci pour votre aide dans l’apprentissage de
cette technique.
8
A l’Equipe de Barcelone,
Gracias a todos por todo, por aprenderme el espanol de la calle (y el normal
tambien), por soportarme durante un año entero…
A Marta, g
racias por todo chica, por los lecciones de español, por tu ayuda preciosa
durante este año… y porque ERES buena ;-) (y lo estas tambien eh?). Espero que
tendras suerte en tu vida nueva, porque lo mereces.
A Paolo,
gracias por tu paciencia para la ChIP, y gracias por los cafés que gané
gracias a ti ;-).
Au CNGOF, au CHU de Dijon pour avoir financé ces travaux.
A la direction de la recherche clinique et de l’innovation du CHU de Dijon, pour
leur aide dans la mise en place et la conduite de ces travaux.
Au CIC-EC, et notamment Christine Binquet, Sandrine Daniel, Marie-Laure Ascensio
et Lydie Rossye
, pour leur aide pour l’analyse des données.
A toutes les sages-femmes, qui ont eu la gentillesse de décortiquer les morceaux
de placentas pour les ranger dans les tubes ;-).
A tous les patients qui ont participé à ces études.
A Suzanne Rankin, pour son aide précieuse dans la correction du manuscrit en
RESUME
Le nombre d’enfants nés par Assistance Médicale à la Procréation (AMP) dans le monde est estimé à plus de 5 millions, représentant jusqu’à 4% des naissances. Environ 10% des couples en âge de procréer sont actuellement infertiles, et leur apporter des techniques pour devenir parents est devenu un problème de santé publique. Cependant, l’innocuité de ces techniques n’a pas été totalement démontrée. Notamment, le risque de pathologies d’origine placentaire pourrait être augmenté. De plus, des issues périnatales défavorables, un risque majoré de malformations majeures et de pathologies liées à l’empreinte ont été rapportés chez ces enfants. Ceci soulève la question d’une éventuelle vulnérabilité épigénétique induite par l’AMP.
L’objectif de ce travail de thèse était d’étudier la régulation épigénétique des gènes soumis à empreinte (GSE) et des éléments transposables (TE) dans le placenta et le sang de cordon d’enfants conçus par AMP comparés à des enfants conçus naturellement.
En guise d’introduction, nous avons rédigé une revue détaillée des modifications phénotypiques et épigénétiques induites par l’AMP dans les embryons, le placenta et le sang de cordon chez l’Homme et sur les modèles animaux.
Au cours de cette thèse, une cohorte de presque 250 patientes a été incluse prospectivement, répartie en 4 groupes de patientes selon la technique d’AMP et 4 groupes de témoins selon la durée d’infertilité.
A partir de cette cohorte, la première question posée a été l’effet de la Fécondation in vitro (FIV) sur la méthylation de l’ADN et/ou la transcription des GSE et TE dans le sang de cordon et le placenta à la naissance. Pour cela, nous avons sélectionné 51 patientes enceintes après FIV avec ou sans ICSI avec transfert d’embryon frais à J2 et les avons comparées à 48 témoins enceintes dans l’année après l’arrêt de la contraception. Nous avons étudié la méthylation de l’ADN et l’expression de 3 GSE et 4 TE. Les niveaux de méthylation de l’ADN placentaire pour H19/IGF2, KCNQ1OT1, LINE-1 et ERVFRD-1 et le niveau d’expression placentaire d’ERVFRD-1 étaient plus bas dans le groupe FIV/ICSI que dans le groupe contrôle. Ces modifications épigénétiques pourraient faire partie des mécanismes de compensation développés pendant la grossesse après AMP, comme discuté dans notre revue.
Ensuite, nous avons voulu déterminer si ces changements de méthylation de l’ADN des GSE pouvaient être associés à des modifications des histones. A partir de la cohorte précédente, nous avons sélectionné 16 patientes du groupe FIV/ICSI avec des niveaux de méthylation dans le placenta inférieurs au 5ème percentile pour au moins un des GSE étudiés. Elles ont été appariées à 16 témoins sur la parité, le sexe du nouveau-né et l’âge gestationnel à l’accouchement. Des marques permissives (H3K4me2 et me3 et H3K9ac) et répressives (H3K9me2 et me3) ont été étudiées. Les résultats ont révélé une quantité significativement augmentée de H3K4me2 dans le groupe FIV/ICSI pour H19/IGF2 et KCNQ1OT1. La quantité des deux marques répressives pour H19/IGF2 et SNURF était significativement abaissée dans le groupe FIV/ICSI.
Ces données montrent que l’hypométhylation de l’ADN au niveau des GSE pourrait être associée à une augmentation des marques permissives et une diminution des marques répressives des histones, ce qui permettrait de favoriser un état « actif » de la chromatine au niveau de l’allèle normalement réprimé.
Nos résultats, ainsi que les données de la littérature, renforcent l’hypothèse de potentiels mécanismes mis en place dans le placenta après AMP, utiles pour compenser des anomalies précoces de la placentation, qui seraient écrits à travers des modifications épigénétiques comme la méthylation de l’ADN mais aussi les modifications des histones. Bien que certaines questions restent en suspens, cette thèse a permis de bâtir les fondations de travaux futurs, notamment pour étudier l’impact de la congélation/décongélation des embryons et le rôle joué par l’infertilité en elle-même.
ABSTRACT
It is estimated that more than five million children have been born by Assisted Reproductive Technologies (ART) worldwide, representing up to 4% of all births. As around 10% of reproductive-aged couples are currently infertile, providing them with treatment options is a public health issue. However, the safety of these techniques has not been fully demonstrated. Notably, the rate of placenta-related adverse pregnancy outcomes could be increased after ART. Moreover, adverse perinatal outcomes, a higher risk of major malformations and imprinting disorders have also been reported in children born following ART. These issues combined raise the question of a potential ART-induced epigenetic vulnerability.
The aim of this thesis was to investigate the epigenetic regulation of imprinted genes (IGs) and transposable elements (TEs) in the placenta and cord blood of children conceived by ART and to compare them to children conceived naturally.
By way of introduction, we wrote a comprehensive review about phenotypic and epigenetic modifications induced by ART in embryos, placenta and cord blood either in human or animal models.
Then, an extensive cohort of almost 250 patients was prospectively included, resulting in 4 groups of ART techniques and 4 groups of controls stratified on the time to pregnancy. From this cohort, the first question we investigated was the effect of in vitro fertilization (IVF) on DNA methylation and/or transcription of TEs and IGs in cord blood and placenta collected at birth. For this purpose, we selected 51 pregnant women after IVF with fresh embryo transfer at day -2 and compared them with 48 controls pregnant within 1 year of stopping contraception. We studied the DNA methylation and expression of 3 imprinted DMRs and 4 TEs. DNA methylation levels for H19/IGF2 and KCNQ1OT1 DMRs, LINE-1 and ERVFRD-1 in the placenta were lower in the IVF/ICSI group than in the control group. The expression level of ERVFRD-1 in the placenta was also lower in the IVF/ICSI group than in the control group. These modifications in epigenetic regulation may influence some compensation mechanisms developed throughout pregnancy after ART, as discussed in our review.
We then intended to determine if these DNA methylation changes in IGs were associated with histone modifications. From the previously mentioned cohort, we selected the 16 patients from the IVF/ICSI group who presented with below the 5th percentile of percentage placenta DNA methylation for at least one of the previously studied DMRs. These patients were compared with 16 controls matched for parity, new-born sex, and gestational age at delivery. Permissive (H3K4me2 and me3 and H3K9ac) and repressive (H3K9me2 and me3) histone marks were studied. The results revealed a significantly higher quantity of H3K4me2 in the IVF/ICSI group than in the natural conception group for H19/IGF2 and KCNQ1OT1 DMRs. The quantity of both repressive marks at H19/IGF2 and SNURF DMRs was significantly lower in the IVF/ICSI group than in the natural conception group.
These data demonstrate that DNA hypomethylation at imprinted DMRs may be associated with an increase in permissive histone marks and a decrease in repressive histone marks. This is consistent with a more “active” chromatin conformation on the normally repressed allele.
Our findings, together with the literature data, reinforce the hypothesis that some mechanisms are established in the placenta after ART, probably to mediate placental plasticity and compensate primary disorders in trophoblastic invasion, and written through epigenetic changes such as DNA methylation but also histone modifications.
Although some questions remain unanswered, this thesis paves the way for further original studies, notably to assess the impact of frozen-thawed embryo transfer and to decipher the role of infertility per se.
SUMMARY
RESUME ... 10
ABSTRACT ... 11
TABLES AND FIGURES LIST ... 15
ABBREVIATIONS LIST ... 16
INTRODUCTION ... 19
I. The potential link between ART and adverse pregnancy outcomes (Tables 1 and 2) ... 23
II. Changes in placenta after ART at various levels: morphologic, microscopic and molecular. Could these modifications be written through epigenetic changes? ... 42
1) Article 1: The placenta: phenotypic and epigenetic modifications induced by Assisted Reproductive Technologies throughout pregnancy ... 42
2) Increased placental weight ... 42
3) Changes in ultrastructure ... 44
4) Blood supply ... 44
5) Changes in molecular mechanisms ... 44
III. ART and epigenetic modifications ... 66
1) Epigenetics: general information ... 66
2) Imprinted genes ... 69
3) Transposable elements ... 73
4) Epigenetic dysregulation of IGs and TEs in the placenta is responsible for placenta-related adverse pregnancy outcomes ... 74
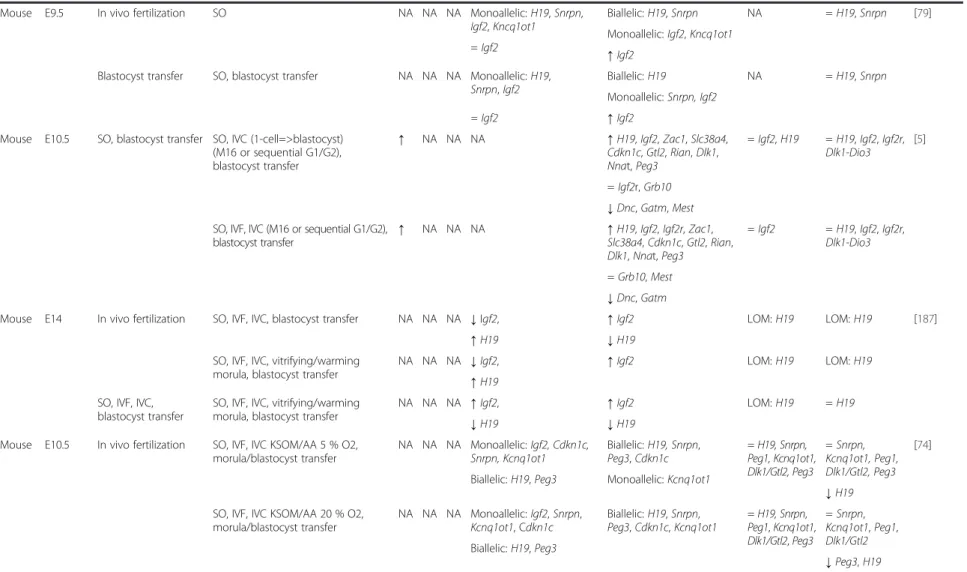
5) ART has been associated with epigenetic modifications in embryos and placenta ... 75
6) Long-term consequences ... 86
IV. Objectives ... 88
MATERIALS AND METHODS ... 91
I. Conçue Cohort ... 91
II. Methylation and expression analyses ... 93
III. Post-translational histone modifications analyses by Chromatin ImmunoPrecipitation (ChIP) 93 IV. Statistical analyses ... 98
RESULTS ... 100
I. METHYLATION AND EXPRESSION ... 100
14
2) Article 2: “The epigenetic control of transposable elements and imprinted genes in
new-borns is affected by the mode of conception: ART versus spontaneous conception without
underlying infertility” ... 101
II. Post-translational histone modifications ... 124
1) Introduction: histones have a fundamental role in placental regulation ... 124
2) Article 3: “The hypomethylation of imprinted genes in IVF/ICSI placenta samples is associated with concomitant changes in histone modifications” ... 124
DISCUSSION AND PERSPECTIVES ... 155
I. Discussion ... 155
II. Perspectives... 159
1) Epigenetic regulation after frozen-thawed embryo transfers ... 159
2) Epigenetic regulation according to the cause of infertility: endometriosis, PCOS, male infertility ... 161
3) The effects of infertility per se ... 162
4) Follow-up of the cohort ... 162
5) Other analyses ... 162
CONCLUSION ... 164
REFERENCES ... 167
TABLES AND FIGURES LIST
Figures
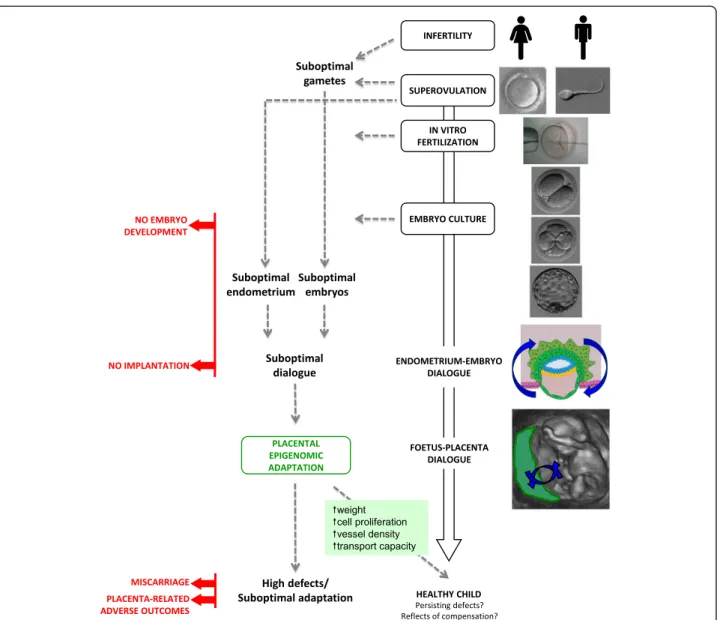
Figure 1: ART and its associated procedures ... 20
Figure 2: Results obtained by our centre “Dijon University Hospital” according to the last ABM (Agence de la Biomédecine) report. ... 22
Figure 3: The placenta is enlarged after ART ... 43
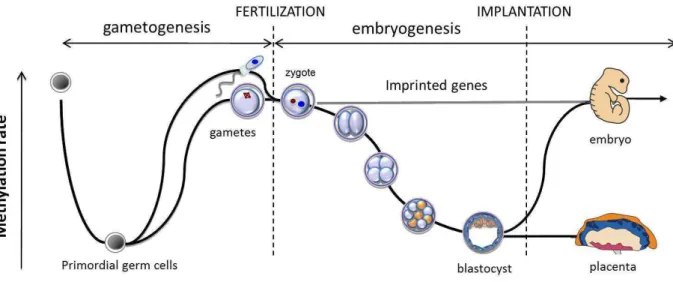
Figure 4: Preimplantation development of the embryo is a sensitive period when important epigenetic events take place ... 66
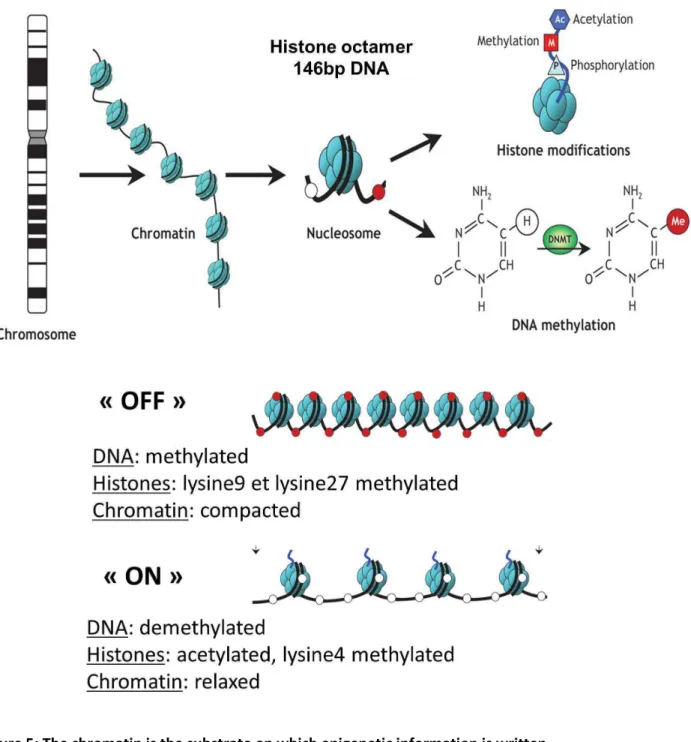
Figure 5: The chromatin is the substrate on which epigenetic information is written ... 67
Figure 6: A nucleosome is constituted by an octamer of histones and a DNA strand ... 68
Figure 7: Parental imprinting ... 70
Figure 8: Epigenetic reprogramming ... 71
Figure 9: The imprinting gene network... 72
Figure 10: Structure of human transposable elements ... 73
Figure 11: Functional and morphological differences between mammal placentas ... 81
Figure 12: Flowchart of Conçue’s cohort ... 92
Figure 13: Technique for Chromatin ImmunoPrecipitation (ChIP) ... 93
Figure 14: Design of the first study (Article 2) ... 101
Figure 15: Conclusion ... 165
Tables
Table 1: Spontaneous abortions in human after ART ... 24Table 2: Adverse and perinatal outcomes after ART potentially involving placenta in humans ... 27
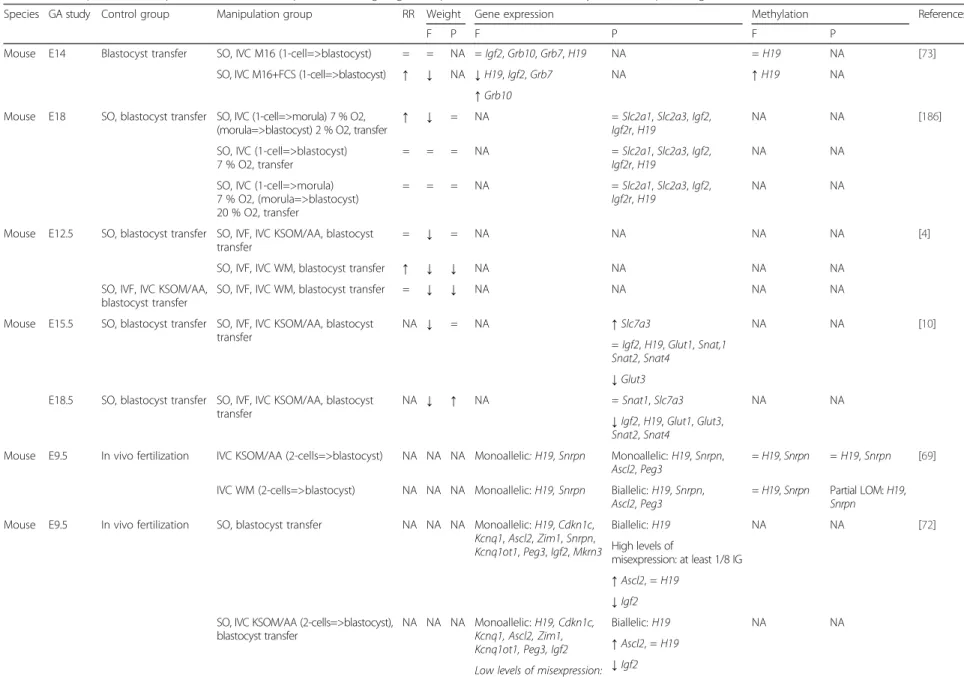
Table 3: Effects of ART on imprinted genes and repeated sequence expression and methylation in mouse blastocysts ... 76
Table 4: Conceptuses and/or placentas in different animal species: resorption rate, weight, gene expression and/or DNA methylation of imprinted genes and genes involved in foeto-placental functions ... 78
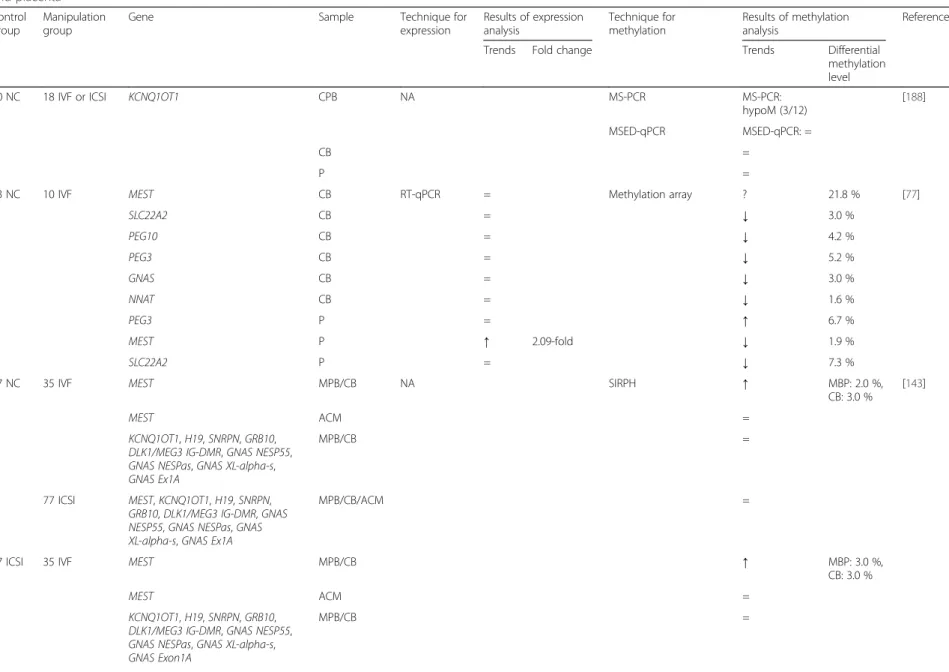
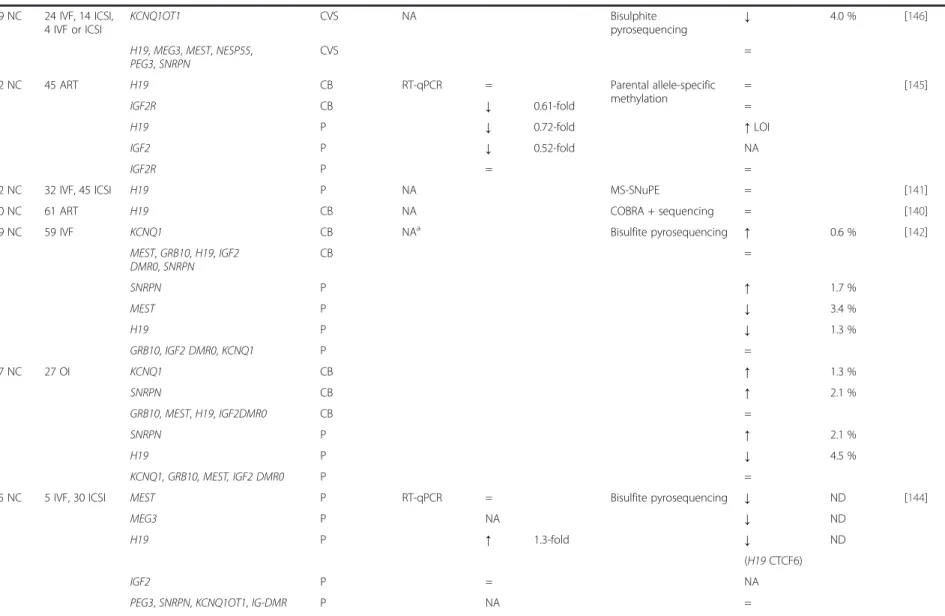
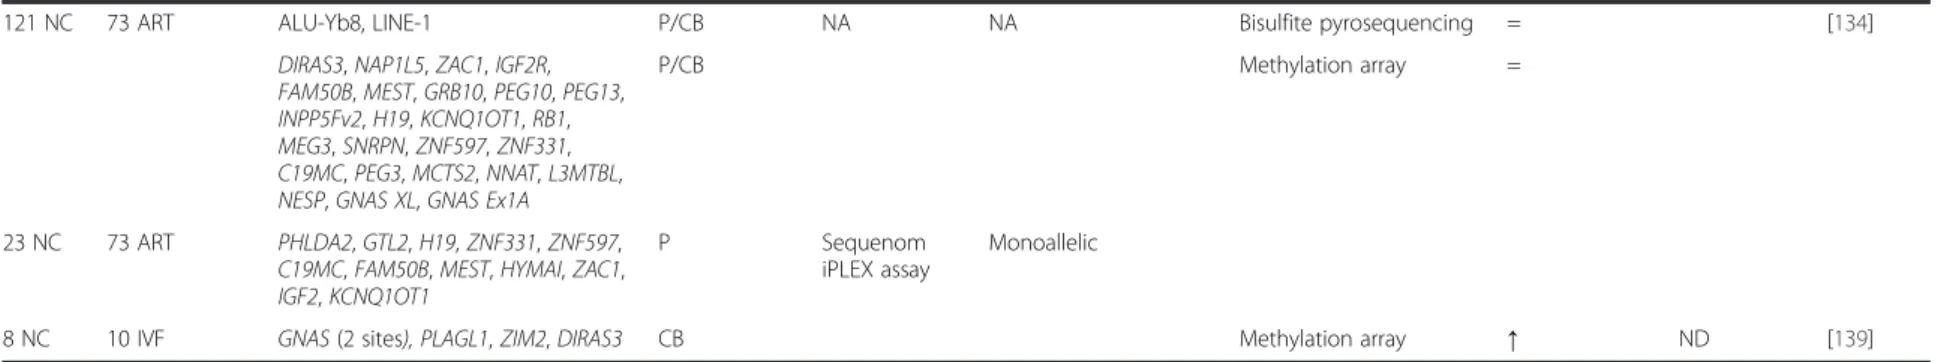
Table 5: Effects of ART on imprinted genes and retrotransposable element expression and methylation in chorionic villous samples from abortion, peripheral blood, cord blood and placenta in human ... 83
ABBREVIATIONS LIST
A
ABM: Agence de la Biomédecine ADN: Acide DésoxyriboNucléique
AMP: Assistance Médicale à la Procréation ART: Assisted Reproductive Technologies
B
BMI: Body Mass Index
C
CB: Cord Blood
ChIP: Chromatin Immuno-Precipitation cIVF: Conventional IVF
D
DMRs: Differentially Methylated Regions DNA: DeoxyriboNuceic Acid
DNMTs: DNA MethylTransferase
DOHaD: Developmental Origin of Health and Diseases
E
E: Embryonic day
EDTA: EthyleneDiamineTetraAcetic Acid ET: Embryo Transfer
F
FET: Frozen-thawed Embryo Transfer FIV: Fécondation in vitro
FSH: Follicle Stimulating Hormone
G
GA: Gestational Age
GnRH: Gonadotrophin Releasing Hormone GSE: Gènes Soumis à Empreinte
H
hCG: Human Chorionic Gonadotrophin HERV: Human endogenous retrovirus
I
ICRs: Imprinting Control Regions ICSI: Intra-Cytoplasmic Sperm Injection IGR: Imprinting Gene Network
IGs: Imprinted Genes
IUGR: Intra-Uterine Growth Retardation IUI: Intra-Uterine Insemination
IVC: In Vitro Culture IVF: In Vitro Fertilization
17
L
L1: LINE-1
LGA: Large for Gestational Age
LINE: Long Interspersed Nucleotide Element LTR: Long Terminal Repeat
N
NC: Naturally Conceived
O
OI: Ovulation Induction ORF: Open Reading Frame
P
PAPP-A: Pregnancy-Associated Plasma Protein A PBS: Phosphate Buffered Saline
PCOS: PolyCystic Ovary Syndrome PCR: Polymerase Chain Reaction PMSF: PhenylMethylSulfonyl Fluoride
R
RNA: RiboNucleic Acid
S
SD: Standard Deviation SDS: Sodium Dodecyl Sulfate SGA: Small for Gestational Age
SINE: Short Interspersed Nucleotide Element SO: SuperOvulation
T
TEs: transposable elements
U
UTR: UnTranslated Region
W
18
19
INTRODUCTION
The development of in vitro fertilization (IVF) has been a major breakthrough of the
20
thcentury. After various attempts on animals in the 1960’s, the first pregnancy
obtained by IVF in humans was described in the Lancet in 1973 (De Kretzer et al.,
1973) but it developed only a few days and was indeed what we could now call a
‘biochemical pregnancy’. The following attempts were not a great success either, as
in 1976 when Steptoe and Edwards reported the successful implantation of a
blastocyst after IVF, but in the fallopian tubes (Presl, 1977). Finally, the same team
was able to claim victory with the birth of the world’s first “test-tube baby”, Louise
Brown, on 25 July 1978 in UK (Clarke, 2006).
The subsequent use of clomiphene citrate and human Chorionic Gonadotrophin
(hCG) to stimulate cycles and control oocyte maturation and collection has led IVF to
a shift from research towards clinical treatment. Nowadays, from an oocyte collected
after ovarian stimulation with Follicle Stimulating Hormone (FSH), preceded by
ovarian blockage by Gonadotrophin Releasing Hormone (GnRH) or accompanied by
GnRH antagonists, and prepared semen, IVF generates embryos which are cultured
in media for 2 to 5-6 days. This procedure is then followed by intra-uterine transfer of
one or two (maximum three) embryos.
Over the last 40 years, the basic process has been improved with new stimulation
protocols, new culture media, the possibility of slow-freezing and, more recently, the
intra-cytoplasmic sperm injection (ICSI), a new fertilization technique described for
the first time in 1992 by Palermo et al. (Palermo et al., 1992), and the vitrification of
embryos and oocytes (Figure 1).
20
Figure 1: ART and its associated procedures
From (Vrooman et al., 2017). This figure explains the different procedures of ART.
Basically, although IUI implies that a woman’s fallopian tubes and a man’s sperm are normal, IVF enables to bypass non-functioning fallopian tubes. Concerning ICSI, the main indication is the abnormality of a man’s semen, particularly severe teratozoospermia, oligozoospermia and/or abnormal survival rate. Indications are also discussed according to other female or male diseases and/or age.
21
All in all, IVF has become the ideal solution for most fertility problems, enabling birth
of more than 5 million children and totalling up to 4% of births worldwide (Messerlian
et al.
, 2017).
According to the ABM (Agence de la BioMédecine), in France, 46,347 intra-uterine
insemination (IUI), 62,623 cycles of IVF and 32,739 frozen-thawed embryo transfers
(FET) were carried out in 2016.
At Dijon University hospital, 255 IUI, 787 cycles of IVF with or without ICSI with
oocyte retrieval and 513 frozen-thawed embryo transfers were done in 2016.
For IUI, the pregnancy rate was 29.6%, with a clinical pregnancy rate (ie. pregnancy
with gestational sac and cardiac activity visible with US scan) of 23.5% and a delivery
rate of 20.4%. Concerning IVF, the clinical pregnancy and delivery rates per oocyte
retrieval were 41.8% and 30.8%, respectively. For FET, the pregnancy and delivery
rates per frozen-thawed embryo were 37.6% and 23.2%, respectively.
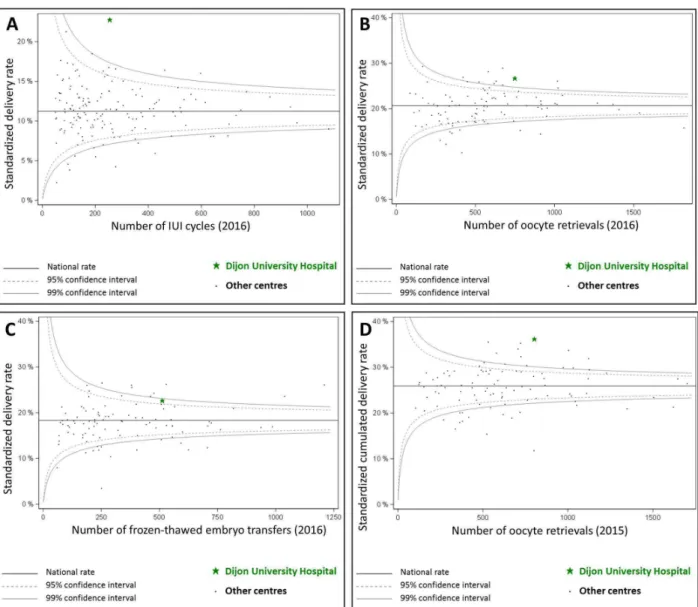
The standardized results of our centre (normalized according to the characteristics of
the population) compared to the national average are displayed in Figure 2 (A: IUI;
B: IVF; C: FET and D: cumulated results of fresh ET and FET for the same oocyte
retrieval).
All in all, in France, out of 798,948 new-borns in 2016, 24,609, or 3.1%, were the
result of ART. As between 8 and 12% of reproductive-aged couples are currently
infertile (Vander Borght et al., 2018), providing them with safe treatment options has
become a public health issue.
However, all over the recent years, the scientific community has started to look more
closely at the potential consequences of the treatments and manipulations used for
IVF.
22
Figure 2: Results obtained by our centre “Dijon University Hospital” according to the last ABM (Agence de la Biomédecine) report.
The results are displayed as funnel plots of the Standardized national Mean Difference. These results are normalized according to the characteristics of the population in each centre. Standardized delivery rate, A: by IUI cycles; B: by oocyte retrieval and C: by FET. D: Standardized Cumulated Delivery rates, from fresh or frozen-thawed embryo transfers, per oocyte retrieval.
23
I.
The potential link between ART and adverse pregnancy
outcomes (Tables 1 and 2)
In both humans and animals, ART has been associated with increased incidence of
placenta-related adverse pregnancy outcomes.
Indeed, in a number of animal models, more abortions are reported after IVF, culture
or superovulation than with natural conception (Van der Auwera et al., 2001; Delle
Piane et al., 2010; Fauque et al., 2010). In the same way, Intra-Uterine Growth
Retardation (IUGR) as well as overgrowth have been described in animals following
ART procedures (Young et al., 1998; Sinclair et al., 2000; Hiendleder et al., 2004;
Miles et al., 2004; Delle Piane et al., 2010; Hori et al., 2010; Bloise et al., 2012; Chen
et al.
, 2013; Grazul-Bilska et al., 2013; Ptak et al., 2013).
Similarly, in humans, after adjusting for several confounding factors, the risk of
spontaneous abortion is higher in ART cohorts than in spontaneous pregnancies
(Table 1).
However, the studies that evidenced higher levels of abortions did not distinguish
between different techniques of ART. Of note, when each ART technique was
studied separately, no difference was found except that the risk was higher in FET
when compared with naturally conceived pregnancy (Table 1).
24
Table 1: Spontaneous abortions in human after ART
Groups
compared Population Study design Adjustment
Measure of
association Comments References
ART vs NC
554 vs 34286 Prospective multicentre cohort None 0.8 (0.1-5.6) ART=cIVF, ICSI and
GIFT (Shevell et al., 2005) 1945 vs 549 (Ford
cohort)
Retrospective cohort
Age 1.20 (1.03-1.46) ART=cIVF, ICSI and
GIFT, including sperm donation
(Wang et al., 2004)
1945 vs 4265
(Treloar cohort) Age, number of previous spontaneous abortions 1.34 (1.19-1.51)
OI vs NC
682 vs 40261 Prospective cohort Maternal characteristics, obstetrics history 5.37 ( 3.71-7.77) (Chaveeva et al., 2011)
266 vs 864 Prospective multicentre cohort
Maternal and paternal age, hospital, obstetrics history, smoking habits, menstrual cycle type,
infertility diagnosis, man alcohol use
1.3 (0.79-2.18)
Infertile couples, excluding oocyte and
sperm donation
(Brandes et al., 2011)
1222 vs 34286 Prospective multicentre cohort
Age, parity, maternal race, marital status, years of education, prior preterm delivery or pregnancy
with anomaly, BMI, smoking habits, bleeding
1.6 (0.6-4.4) (Shevell et al., 2005)
IUI vs NC 203 vs 864 Prospective multicentre cohort
Maternal and paternal age, hospital, obstetrics history, smoking habits, menstrual cycle type,
infertility diagnosis, man alcohol use
1.3 (0.85-2.10)
Infertile couples, excluding oocyte and
sperm donation
(Brandes et al., 2011)
IVF vs NC 561 vs 600 Prospective cohort
Age, maternal education, obstetric history, hypertension and diabetes prior to pregnancy,
BMI, smoking habits
0.94 (0.44-2.54) cIVF and ICSI and FET (Farhi et al., 2013)
634 vs 40261 Prospective cohort Maternal characteristics, obstetrics history 1.20 ( 0.58-2.47) (Chaveeva et al., 2011)
cIVF vs NC
223 vs 600 Prospective cohort
Age, maternal education, obstetric history, hypertension and diabetes prior to pregnancy,
BMI, smoking habits
1.04 (0.43-1.63) Including FET (Farhi et al., 2013)
190 vs 864 Prospective multicentre cohort
Maternal and paternal age, hospital, obstetrics history, smoking habits, menstrual cycle type,
infertility diagnosis, man alcohol use
1.1 (0.67-1.75)
Infertile couples, excluding oocyte and
sperm donation
(Brandes et al., 2011)
ICSI vs NC
338 vs 600 Prospective cohort
Age, maternal education, obstetric history, hypertension and diabetes prior to pregnancy,
BMI, smoking habits
0.89 (0.40-1.98) Including FET (Farhi et al., 2013)
202 vs 864 Prospective multicentre cohort
Maternal and paternal age, hospital, obstetrics history, smoking habits, menstrual cycle type,
infertility diagnosis, man alcohol use
1.0 (0.60-1.62)
Infertile couples, excluding oocyte and
sperm donation
25
FET vs NC 61 vs 864 Prospective multicentre cohort
Maternal and paternal age, hospital, obstetrics history, smoking habits, menstrual cycle type,
infertility diagnosis, man alcohol use
2.2 (1.14-4.19)
Infertile couples, excluding oocyte and
sperm donation
(Brandes et al., 2011)
IVF with EPE2 vs IVF without
EPE2
299 vs 2696 Retrospective cohort None Miscarriage rate:
8.4 vs 7.1% (NS)
cIVF and ICSI, only fresh embryo transfer,
excluding oocyte donation (Imudia et al., 2014) IVF with Progesterone level at oocyte retrieval≥12 ng/mL vs <12
51 vs 135 Prospective cohort None
Implantation rate: 31.6 vs 43.9 % (P=0.01) Pregnancy rate: 20.0 vs 38.6% (P=0.02) Miscarriage rate: 16.7 vs 12.1% (P=0.64) Only antagonist protocols, cIVF and ICSI, only fresh embryo
transfer (Nayak et al., 2014) IVF with 1st trimester serum hCG<10th percentile vs IVF with normal serum hCG
46 vs 161 Retrospective cohort None 6.5 (4.1-10.1) (Haddad et al., 1999)
Letrozole-induced cycles vs natural cycles
792 vs 3136 Retrospective cohort Maternal age and calendar year 0.37 (0.30-0.47)
Only single embryo transfer, excluding twin
pregnancies
(Tatsumi et al., 2017)
IVF with fresh blastocyst transfer vs IVF
with cleavage embryo transfer
194 vs 194 Randomized clinical trial None 19.72 vs 12% (ns)
Patients < 39 years of age with >3 fertilized oocytes and <4 previous
ART attempts
(Levi-Setti et al., 2018)
ART: Assisted Reproductive Technologies, cIVF : conventional In Vitro Fertilization, EPE2: Elevated Peak serum Estradiol level (>90 th
percentile, 3450-4500 pg/mL), GIFT: Gamete Intra-Fallopian Transfer, ICSI: Intra-Cytoplasmic Sperm Injection, IVF: In Vitro Fertilization (cIVF + ICSI), NC: Naturally Conceived, NS: Not Significant.
26
In addition, throughout ART pregnancy, placental-related defects can also occur
(Thomopoulos et al., 2013). For example, human studies found an increased risk of
gestational hypertension, preeclampsia, placenta praevia and placental abruption
(Table 2). Moreover, the risks of low birth weight (Jackson et al., 2004) and
prematurity (Jackson et al., 2004; Pinborg et al., 2013; Cavoretto et al., 2018) were
increased after ART (Table 2). Interestingly, according to the ART technique used,
the potential adverse effects on pregnancy may be different. For example, after FET,
the risks of large for gestational age (Sazonova et al., 2012; Wennerholm et al.,
2013; Ishihara et al., 2014; Korosec et al., 2014; Litzky et al., 2018), gestational
hypertension (Ishihara et al., 2014; Roque et al., 2018) and preeclampsia (Sazonova
et al.
, 2012) are increased but the risk of small for gestational age (SGA) is
decreased (Wennerholm et al., 2013; Ishihara et al., 2014; Korosec et al., 2014;
Litzky et al., 2018) as compared to superovulation followed by fresh embryo transfer
(Table 2). The risks are therefore dependent on the specific ART technique used,
which emphasises the importance of studying ART techniques differentially and not
pooling ART patients into a single group.
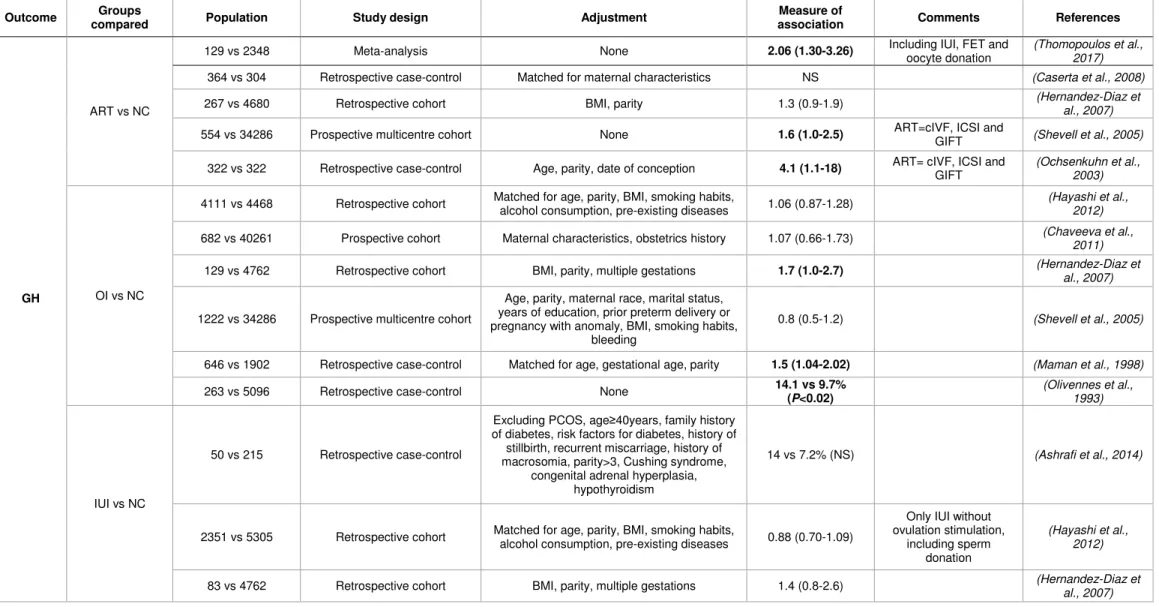
However, regarding Table 2, the results of different studies are quite heterogeneous
and most of them are based on retrospective cohorts. Recently, some meta-analyses
that compiled the existing studies on the obstetrical outcomes of ART were
performed. The first one concluded that the rates of gestational hypertension and
preeclampsia were increased after ART compared to natural conception
(Thomopoulos et al., 2017), but different methods of ART were mixed. A
meta-analysis comparing IVF and natural conception reported higher rates of gestational
hypertension, placenta praevia, abruptio placentae, SGA and preterm birth after IVF
(Qin et al., 2016). The increase in the rate of preterm birth after IVF was also
demonstrated by another recent meta-analysis (Cavoretto et al., 2018). As for the
comparison between IVF with fresh or frozen-thawed embryo transfer, another recent
meta-analysis found an increase in gestational hypertension and preeclampsia after
FET but no difference in placenta praevia rates (Roque et al., 2018).
27
Table 2: Adverse and perinatal outcomes after ART potentially involving placenta in humans
Outcome Groups
compared Population Study design Adjustment
Measure of
association Comments References
GH
ART vs NC
129 vs 2348 Meta-analysis None 2.06 (1.30-3.26) Including IUI, FET and
oocyte donation
(Thomopoulos et al., 2017)
364 vs 304 Retrospective case-control Matched for maternal characteristics NS (Caserta et al., 2008)
267 vs 4680 Retrospective cohort BMI, parity 1.3 (0.9-1.9) (Hernandez-Diaz et al., 2007)
554 vs 34286 Prospective multicentre cohort None 1.6 (1.0-2.5) ART=cIVF, ICSI and
GIFT (Shevell et al., 2005) 322 vs 322 Retrospective case-control Age, parity, date of conception 4.1 (1.1-18) ART= cIVF, ICSI and
GIFT
(Ochsenkuhn et al., 2003)
OI vs NC
4111 vs 4468 Retrospective cohort Matched for age, parity, BMI, smoking habits,
alcohol consumption, pre-existing diseases 1.06 (0.87-1.28)
(Hayashi et al., 2012)
682 vs 40261 Prospective cohort Maternal characteristics, obstetrics history 1.07 (0.66-1.73) (Chaveeva et al.,
2011)
129 vs 4762 Retrospective cohort BMI, parity, multiple gestations 1.7 (1.0-2.7) (Hernandez-Diaz et
al., 2007)
1222 vs 34286 Prospective multicentre cohort
Age, parity, maternal race, marital status, years of education, prior preterm delivery or pregnancy with anomaly, BMI, smoking habits,
bleeding
0.8 (0.5-1.2) (Shevell et al., 2005)
646 vs 1902 Retrospective case-control Matched for age, gestational age, parity 1.5 (1.04-2.02) (Maman et al., 1998)
263 vs 5096 Retrospective case-control None 14.1 vs 9.7%
(P<0.02)
(Olivennes et al., 1993)
IUI vs NC
50 vs 215 Retrospective case-control
Excluding PCOS, age≥40years, family history of diabetes, risk factors for diabetes, history of stillbirth, recurrent miscarriage, history of macrosomia, parity>3, Cushing syndrome,
congenital adrenal hyperplasia, hypothyroidism
14 vs 7.2% (NS) (Ashrafi et al., 2014)
2351 vs 5305 Retrospective cohort Matched for age, parity, BMI, smoking habits,
alcohol consumption, pre-existing diseases 0.88 (0.70-1.09)
Only IUI without ovulation stimulation,
including sperm donation
(Hayashi et al., 2012)
83 vs 4762 Retrospective cohort BMI, parity, multiple gestations 1.4 (0.8-2.6) (Hernandez-Diaz et
28
GH
IVF vs NC
26652 vs 68948 Meta-analysis None 1.30 (1.04-1.62) Including cIVF and ICSI (Qin et al., 2016)
1659 vs 5193 Retrospective cohort Matched for maternal age and birth year 1.99 (1.56-2.53) P<0.001 Excluding birth<28 WG, donor oocytes/sperm/embryos, preimplantation genetic diagnosis, chronic hypertension, diabetes
or heart disease and fetal anomalies Including cIVF and ICSI
(Zhu et al., 2016)
116 vs 664 Retrospective case-control None
Age≥40: 3.02 (1.49-6.09) Age 30-34: 6.23
(1.63-19 .8)
2 populations (age≥40 and age 30-34), ICSI
and cIVF
(Toshimitsu et al., 2014)
95 vs 215 Retrospective case-control
Excluding PCOS, age≥40years, family history of diabetes, risk factors for diabetes, history of stillbirth, recurrent miscarriage, history of macrosomia, parity>3, Cushing syndrome,
congenital adrenal hyperplasia, hypothyroidism
21 vs 7.2% (P=0.01) cIVF and ICSI (Ashrafi et al., 2014)
561 vs 600 Prospective cohort
Age, maternal education, obstetric history, hypertension and diabetes prior to pregnancy,
BMI, smoking habits
1.49 (0.93-2.38) FET and cIVF and ICSI, (Farhi et al., 2013)
4570 vs 4264 Retrospective cohort Matched for age, parity, BMI, smoking habits,
alcohol consumption, pre-existing diseases 0.74 (0.62-0.89) cIVF and ICSI
(Hayashi et al., 2012)
634 vs 40261 Prospective cohort Maternal characteristics, obstetrics history 1.38 ( 0.92-2.06) (Chaveeva et al.,
2011)
269 vs 15037 Retrospective case-control
Matched for year of delivery and mother’s place of residence. Adjustment on age, parity,
socio-economic status
2.35 (1.57-3.53) Only fresh SET, cIVF
and ICSI
(Poikkeus et al., 2007)
307 vs 307 Retrospective case-control
Matched for maternal age, parity, ethnic origin, date of parturition, height, smoking habits,
obstetric history
13.7 vs 11.1% (NS) Excluding FET (Koudstaal et al.,
29
GH
169 vs 469 Retrospective case-control Matched for age, gestational age, parity 2.1 (1.04-4.10) (Maman et al., 1998)
260 vs 260 Retrospective case-control Matched for age, parity, ethnic origin, location
and date of delivery 11.2 vs 8.1% (NS)
14% FET, 6.2% ovum donation
(Reubinoff et al., 1997)
62 vs 62 Retrospective case-control Matched for age, race, order of gestation,
insurance 21 vs 4% (P<0.05) (Tallo et al., 1995)
162 vs 5096 Retrospective case-control None 9.2 vs 9.7% (NS) (Olivennes et al.,
1993)
cIVF vs NC 223 vs 600 Prospective cohort
Age, maternal education, obstetric history, hypertension and diabetes prior to pregnancy,
BMI, smoking habits
1.63 (0.89-2.99) Including FET (Farhi et al., 2013)
ICSI vs NC 338 vs 600 Prospective cohort
Age, maternal education, obstetric history, hypertension and diabetes prior to pregnancy,
BMI, smoking habits
1.41 (0.84-2.38) Including FET (Farhi et al., 2013)
IVF FET vs IVF fresh
31479 vs 17447 Meta-analysis None 1.82 (1.24-2.68),
P=0.002 (Roque et al., 2018)
31249 vs 16909 Retrospective cohort
Adjusted for maternal age, type of embryo transferred (cleaved or blastocyst) and sex of
the infant
1.58 (1.35-1.86) Only SET (Ishihara et al., 2014)
PE
ART vs NC
2987 vs 75958 Meta-analysis None 1.65 (1.53-1.77) Including IUI, FET,
oocyte donation
(Thomopoulos et al., 2017)
267 vs 4680 Retrospective cohort BMI, parity 1.2 (0.6-2.4) (Hernandez-Diaz et
al., 2007)
554 vs 34286 Prospective multicentre cohort None 2.7 (1.7-4.4) ART=cIVF, ICSI and
GIFT (Shevell et al., 2005)
OI vs NC
296 vs 9559 Meta-analysis None 1.48 (1.12-1.96) (Thomopoulos et al.,
2017)
682 vs 40261 Prospective cohort Maternal characteristics, obstetric history
Early: 1.29 (0.39-4.20) Late: 1.32 (0.78-2.24) (Chaveeva et al., 2011) 777 vs 3103 Retrospective case-control
Matched for age and parity, adjustment on smoking, delivery hospital level, initiating time
of prenatal care, average neighbourhood income, foetal sex, previous caesarean
delivery
0.72 (0.31-1.68) (Sun et al., 2009)
1222 vs 34286 Prospective cohort
Age, race, marital status, years of education, prior preterm delivery, prior foetal anomaly,
BMI, smoking history, bleeding
30
PE
IUI vs NC 471 vs 1884 Retrospective case-control
Matched for age and parity, adjustment on smoking, delivery hospital level, initiating time
of prenatal care, average neighbourhood income, foetal sex, previous caesarean
delivery
2.28 (1.04-5.02) (Sun et al., 2009)
IVF vs NC
1659 vs 5193 Retrospective cohort Matched for maternal age and birth year 1.71 (1.34-2.19)
Excluding birth<28 WG, donor oocytes/sperm/embryos, preimplantation genetic diagnosis, chronic hypertension, diabetes
or heart disease and fetal anomalies Including cIVF and ICSI
(Zhu et al., 2016)
474 vs 474
Retrospective case-control
Matched with the closest propensity score adjusting for 27 maternal and paternal
variables
2.50 (0.49-12.89)
(Watanabe et al., 2014)
474 vs 2610 Adjusted for 27 maternal and paternal
confounders 2.32 (1.08-4.99)
825 vs 111264 Retrospective multicentre case-control
Birth gestational age, parity, birth weight, maternal and paternal age, education,
smoking habits, alcohol consumption
1.48 (1.16-1.87)
cIVF, ICSI and FET, including PE and
eclampsia
(Yang et al., 2014)
634 vs 40261 Prospective cohort Maternal characteristics, obstetrics history
Early: 3.28 (1.39-7.74) Late: 1.48 (0.91-2.41) (Chaveeva et al., 2011) 870 vs 3433 Retrospective case-control
Matched for age and parity, adjustment on smoking, delivery hospital level, initiating time
of prenatal care, average neighbourhood income, foetal sex, previous caesarean
delivery
1.12 (0.56-2.22) cIVF and ICSI (Sun et al., 2009)
269 vs 15037 Retrospective case-control
Matched for year of delivery and mother’s place of residence
Adjustment on age, parity, socio-economic status
2.2 vs 1.6% (NS) Only fresh SET, cIVF and ICSI
(Poikkeus et al., 2007)
554 vs 34286 Prospective cohort
Age, race, marital status, years of education, prior preterm delivery, prior foetal anomaly,
BMI, smoking history, bleeding
2.7 (1.7-4.4) (Shevell et al., 2005)
13261 vs 2013633 Register study Age, parity, smoking habits, year of pregnancy 1.2 (1.1-1.3) cIVF and ICSI (Kallen et al., 2005)
144 vs 39112 Retrospective case-control None 5.2 (1.7-15.9) (Tabs et al., 2004)
IVF FET vs NC 2348 vs 571914 Retrospective case-control Age, parity, BMI, smoking habits, year of birth,
years of involuntary childlessness 1.25 (1.03-1.51)
SET and DET, excluding oocyte donation
(Sazonova et al., 2012)
31
PE
IVF FET vs IVF fresh
211 vs 915 Retrospective cohort None 0.9 vs 3.1%
(P=0.098)
Mostly blastocyst-stage transfers, cIVF and ICSI
(Korosec et al., 2014)
2348 vs 8944 Retrospective case-control Age, parity, BMI, smoking habits, year of birth,
years of involuntary childlessness 1.32 (1.07-1.63)
SET and DET, excluding oocyte donation
(Sazonova et al., 2012)
IVF with EPE2 vs IVF without
EPE2
27 vs 265 Retrospective cohort Age, parity, total dose of gonadotropin 4.79 (1.55-14.84) Excluding FET (Imudia et al., 2012)
IVF with hCG<50 IU/L vs hCG≥150 IU/L at
day 12
220 vs 673 Prospective cohort
Age, parity, BMI, smoking habits, type of IVF (cIVF, IVF-ICSI or FET), number of transferred
embryos, year of transfer, offspring sex
Any PE: 2.2 (1.0-4.9) Severe PE: 3.7 (1.2-11.6) Mild PE: 1.3 (0.4-4.0)
Including FET, cIVF and ICSI, excluding oocyte
donation (Asvold et al., 2014) IVF with 1st trimester serum hCG<10th percentile vs IVF with normal serum hCG
46 vs 161 Retrospective cohort None 9 vs 1.4% (NS) (Haddad et al., 1999)
GH or PE ICSI vs NC 2055 vs 7861 Prospective controlled cohort None 1.3 (1.11-1.52) Excluding FET (Katalinic et al.,
2004)
Placenta praevia
ART vs NC
1408 vs 53939 Retrospective cohort None 4.7 vs 1.5%
(P=0.0001) ART=cIVF, ICSI, GIFT (Fujii et al., 2010)
554 vs 34286 Prospective multicentre cohort None 6.0 (3.4-10.7) ART=cIVF, ICSI, GIFT (Shevell et al., 2005)
OI vs NC
4111 vs 4468 Retrospective cohort Matched for age, parity, BMI, smoking habits,
alcohol consumption, pre-existing diseases 1.77 (1.24-2.54)
(Hayashi et al., 2012)
1222 vs 34286 Prospective cohort
Age, race, marital status, years of education, prior preterm delivery, prior foetal anomaly,
BMI, smoking history, bleeding
0.9 (0.3-2.3) (Shevell et al., 2005)
IUI vs NC 2351 vs 5305 Retrospective cohort Matched for age, parity, BMI, smoking habits,
alcohol consumption, pre-existing diseases 1.46 (1.03-2.08)
Only IUI without ovulation stimulation,
including sperm donation
(Hayashi et al., 2012)
32
Placenta praevia
1659 vs 5193 Retrospective cohort Matched for maternal age and birth year 2.25 (1.75-2.89) P<0.001
Excluding birth<28 WG, donor oocytes/sperm/embryos, preimplantation genetic diagnosis, chronic hypertension, diabetes
or heart disease and fetal anomalies Including cIVF and ICSI
(Zhu et al., 2016)
825 vs 111264 Retrospective multicentre case-control
Birth gestational age, parity, birth weight, maternal and paternal age, education,
smoking habits, alcohol consumption
2.78 (1.97-13.94) cIVF and ICSI and FET (Yang et al., 2014)
4570 vs 4264 Retrospective cohort Matched for age, parity, BMI, smoking habits,
alcohol consumption, pre-existing diseases 2.2 (1.68-2.87) cIVF and ICSI
(Hayashi et al., 2012)
6730 vs 24619 Retrospective cohort
Matched on age, year of birth of the baby Adjustment on age, year of pregnancy, marital
status, parity, miscarriage, hospital status
2.34 (1.87-2.92)
cIVF, ICSI and FET, excluding oocyte
donation
(Healy et al., 2010)
269 vs 15037 Retrospective case-control
Matched for year of delivery and mother’s place of residence
Adjustment on age, parity, socio-economic status
4.75 (2.57-8.78) Only fresh SET, cIVF
and ICSI
(Poikkeus et al., 2007)
5581 vs 826909
Retrospective cohort
Age, parity, interval between deliveries, year of delivery, history of caesarean section,
offspring sex, marital status
5.6 (4.4-7.0)
cIVF, ICSI and FET (Romundstad et al.,
2006)
1349 vs 1349 consecutive birth for
the same mother
2.9 (1.4-6.1)
13261 vs 2013633 Register study Age, parity, smoking habits, year of pregnancy 3.8 (3.3-4.5) cIVF and ICSI (Kallen et al., 2005)
260 vs 260 Retrospective case-control Matched for age, parity, ethnic origin, location
and date of delivery 0.4 vs 0.8% (NS)
14% FET, 6.2% oocyte donation
(Reubinoff et al., 1997)
ICSI vs NC 2055 vs 7861 Prospective controlled cohort None 6.42 (4.03-10.22) Only fresh embryo
transfer
(Katalinic et al., 2004)
IVF FET vs NC 2348 vs 571914 Retrospective case-control Age, parity, BMI, smoking habits, year of birth, years of involuntary childlessness 1.22 (0.73-2.04) SET and DET, excluding oocyte donation (Sazonova et al., 2012)
IVF FET vs IVF fresh
36455 vs 33031 Meta-analysis None 0.70 (0.46-1.08), P=0.11 (Roque et al., 2018)
31249 vs 16909 Retrospective cohort
Adjusted for maternal age, type of embryo transferred (cleaved or blastocyst) and sex of
the infant
33
Placenta praevia
211 vs 915 Retrospective cohort None 0 vs 3.5% (P=0.002) Mostly blastocyst-stage
transfers, cIVF and ICSI
(Korosec et al., 2014)
2348 vs 8944 Retrospective case-control Age, parity, BMI, smoking habits, year of birth,
years of involuntary childlessness 0.32 (0.19-0.55)
SET and DET, excluding oocyte donation
(Sazonova et al., 2012)
2045 vs 4058 Retrospective cohort
Matched on age, year of birth of the baby Adjustment on age, year of pregnancy, marital
status, country of birth, parity, miscarriage, hospital status
0.73 (0.51-1.04)
cIVF and ICSI, FET=only in natural cycles, excluding oocyte
donation
(Healy et al., 2010)
IVF vs NC in infertile population
6730 vs 2167 Retrospective cohort Matched on age, year of birth of the baby 2.6 vs 1.2% (P<0.001)
cIVF and ICSI and FET, excluding oocyte
donation
(Healy et al., 2010)
Abruptio placentae
ART vs NC 554 vs 34286 Prospective multicentre cohort None 2.4 (1.1-5.2) ART=cIVF, ICSI and
GIFT (Shevell et al., 2005)
OI vs NC
4111 vs 4468 Retrospective cohort Matched for age, parity, BMI, smoking habits,
alcohol consumption, pre-existing diseases 1.35 (0.88-2.08)
(Hayashi et al., 2012)
777 vs 3103 Retrospective case-control
Matched for age and parity, adjustment on smoking, delivery hospital level, initiating time
of prenatal care, average neighbourhood income, foetal sex, previous caesarean
delivery
1.63 (0.60-4.42) (Sun et al., 2009)
1222 vs 34286 Prospective cohort
Age, race, marital status, years of education, prior preterm delivery, prior foetal anomaly,
BMI, smoking history, bleeding
2.4 (1.3-4.2) (Shevell et al., 2005)
IUI vs NC
2351 vs 5305 Retrospective cohort Matched for age, parity, BMI, smoking habits, alcohol consumption, pre-existing diseases 0.98 (0.59-1.62)
Only IUI without ovulation stimulation, including sperm donation (Hayashi et al., 2012) 471 vs 1884 Retrospective case-control
Matched for age and parity, adjustment on smoking, delivery hospital level, initiating time
of prenatal care, average neighbourhood income, foetal sex, previous caesarean
delivery
1.57 (0.41-6.03) (Sun et al., 2009)
34
Abruptio placentae
1659 vs 5193 Retrospective cohort Matched for maternal age and birth year 4.43 (2.28-8.61) P<0.001
Excluding birth<28 WG, donor oocytes/sperm/embryos, preimplantation genetic diagnosis, chronic hypertension, diabetes
or heart disease and fetal anomalies Including cIVF and ICSI
(Zhu et al., 2016)
4570 vs 4264 Retrospective cohort Matched for age, parity, BMI, smoking habits,
alcohol consumption, pre-existing diseases 1.21 (0.79-1.87) cIVF and ICSI
(Hayashi et al., 2012)
6730 vs 24619 Retrospective cohort
Matched on age, year of birth of the baby Adjustment on age, year of pregnancy, marital
status, parity, miscarriage, hospital status
2.07 (1.44-2.98)
cIVF, ICSI and FET, excluding oocyte
donation
(Healy et al., 2010)
870 vs 3433 Retrospective case-control
Matched for age and parity, adjustment on smoking, delivery hospital level, initiating time
of prenatal care, average neighbourhood income, foetal sex, previous caesarean
delivery
1.26 (0.54-2.92) cIVF and ICSI (Sun et al., 2009)
269 vs 15037 Retrospective case-control
Matched for year of delivery and mother’s place of residence
Adjustment on age, parity, socio-economic status
0 vs 0.4% (NS) Only fresh SET, cIVF and ICSI
(Poikkeus et al., 2007)
13261 vs 2013633 Register study Age, parity, smoking habits, year of pregnancy 1.9 (1.4-2.5) cIVF and ICSI (Kallen et al., 2005)
ICSI vs NC 2055 vs 7861 Prospective controlled cohort None 1.81 (1.26-2.60) excluding FET (Katalinic et al.,
2004)
IVF FET vs NC 2348 vs 571914 Retrospective case-control Age, parity, BMI, smoking habits, year of birth,
years of involuntary childlessness 1.21 (0.69-2.11)
SET and DET, excluding oocyte donation
(Sazonova et al., 2012)
IVF FET vs IVF fresh
31249 vs 16909 Retrospective cohort
Adjusted for maternal age, type of embryo transferred (cleaved or blastocyst) and sex of
the infant
0.65 (0.41-1.04) Only SET (Ishihara et al., 2014)
2348 vs 8944 Retrospective case-control Age, parity, BMI, smoking habits, year of birth,
years of involuntary childlessness 0.66 (0.36-1.20)
SET and DET, excluding oocyte donation
(Sazonova et al., 2012)
2045 vs 4058 Retrospective cohort
Matched on age, year of birth of the baby Adjustment on age, year of pregnancy, marital
status, country of birth, parity, miscarriage, hospital status
0.39 (0.19-0.80)
cIVF and ICSI, FET=only in natural cycles, excluding oocyte
donation
35
IVF vs NC in infertile population
6730 vs 2167 Retrospective cohort Matched on age, year of birth of the baby 0.9 vs 0.6% (NS)
cIVF and ICSI and FET, excluding oocyte
donation
(Healy et al., 2010)
SGA
ART vs NC
1408 vs 53939 Retrospective cohort Age, gestational age, placenta praevia, maternal pretreatment characteristics
<10th perc 1.12 (0.95-1.31)
ART=cIVF, ICSI and
GIFT (Fujii et al., 2010)
554 vs 34286 Prospective multicentre cohort None <10
th
perc 1.3 (1.0-1.8)
ART=cIVF, ICSI and
GIFT (Shevell et al., 2005)
OI vs NC
4111 vs 4468 Retrospective cohort Matched for age, parity, BMI, smoking habits, alcohol consumption, pre-existing diseases
<10th perc
1.45 (1.21-1.73)
(Hayashi et al., 2012)
682 vs 40261 Prospective cohort Maternal characteristics, obstetrics history <5 th perc 1.76 (1.30-2.38) (Chaveeva et al., 2011) 777 vs 3103 Retrospective case-control
Matched for age and parity, adjustment on smoking, delivery hospital level, initiating time
of prenatal care, average neighbourhood income, foetal sex, previous caesarean
delivery
<10th perc
1.40 (1.06-1.86)) (Sun et al., 2009)
1222 vs 34286 Prospective cohort
Age, race, marital status, years of education, prior preterm delivery, prior foetal anomaly,
BMI, smoking history, bleeding
<10th perc
1.5 (0.8-2.8) (Shevell et al., 2005)
263 vs 5096 Retrospective case-control None <10
th perc 10.6 vs 5.9% (P<0.05) (Olivennes et al., 1993) IUI vs NC 4208 vs 229749 Retrospective cohort
Age, parity, year of pregnancy, child gender, BMI smoking habits, elective caesarean
section, induction of labour
<10th perc 1.39 (1.18-1.65) Natural or stimulated cycle (Malchau et al., 2014)
2351 vs 5305 Retrospective cohort Matched for age, parity, BMI, smoking habits, alcohol consumption, pre-existing diseases
<10th
perc 1.27 (1.04-1.55)
Only IUI without ovulation stimulation, including sperm donation (Hayashi et al., 2012) 471 vs 1884 Retrospective case-control
Matched for age and parity, adjustment on smoking, delivery hospital level, initiating time
of prenatal care, average neighbourhood income, foetal sex, previous caesarean
delivery
<10th perc
1.07 (0.76-1.52) (Sun et al., 2009)
IVF vs NC 81090 vs 753771 Meta-analysis None <10
th
perc