Experimental characterisation of textile compaction response: a benchmark exercise
Texte intégral
Figure
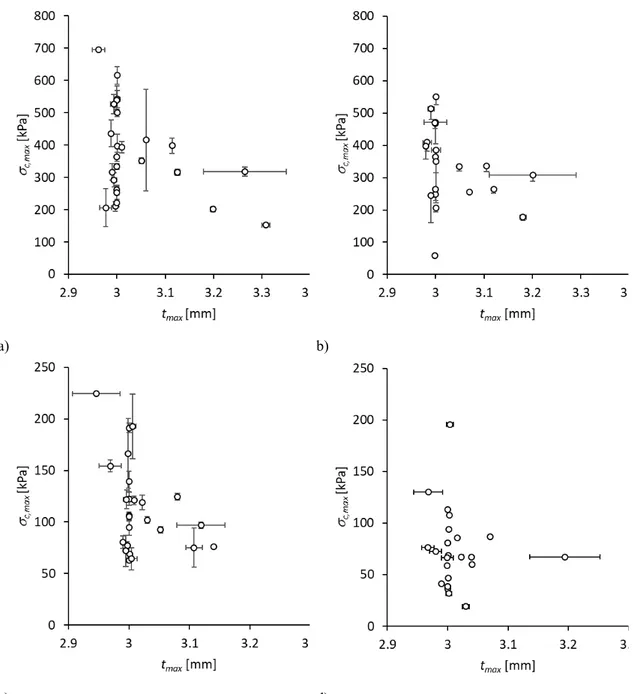
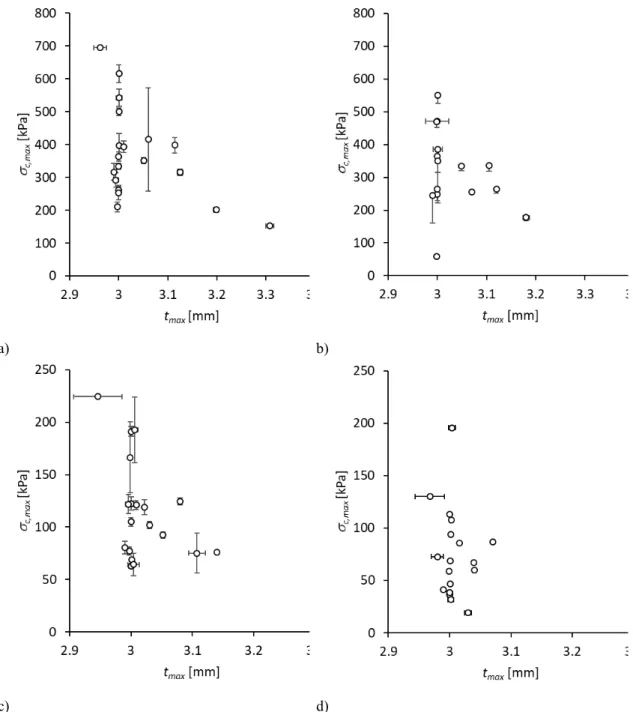

![Figure 8. Fitted dry compaction curve for [thickness measurement source - material] a) [UTM - NCF dry], b) [LVDT/direct - NCF dry], c) [UTM - WOVEN dry] and d) [LVDT/direct - WOVEN dry].](https://thumb-eu.123doks.com/thumbv2/123doknet/14388092.507707/29.892.131.780.152.875/figure-fitted-compaction-thickness-measurement-source-material-direct.webp)
![Figure 9. Fitted wet compaction curve for [thickness measurement source - material] a) [UTM - NCF wet], b) [LVDT/direct - NCF wet], c) [UTM - WOVEN wet] and d) [LVDT/direct - WOVEN wet].](https://thumb-eu.123doks.com/thumbv2/123doknet/14388092.507707/30.892.135.811.121.834/figure-fitted-compaction-thickness-measurement-source-material-direct.webp)
Documents relatifs
Les terres limono-sableuses contenant moins de 15 % d'argile sont très sensibles à la compaction et, de plus, ont les plus mauvaises réactions aux phénomènes de tassement et
Static precompaction of 3 MPa and dynamic compaction using a projectile velocity of 50 mls resulted in compacts having a compaction degree of 65% and a tensile strength of
higher confining pressure, plastic deformation can occur at grain contacts leading to contact
Pre-compressed expanded potassic vermiculite samples, used as main components of high- temperature-resistant sealing gaskets, were investigated by using in situ
For bioclastic carbonate sand saturated with reactive fluids and crushed calcite the model initially deviates from the observed data, indicating that several mechanisms may
Ce principe peut être utilisé pour diverses raisons : jonction d’une ossature en bois avec une ossature en acier, renforcement mécanique, protection au feu de
Figura 94 - Resultados da identificação da cinética da deformação de recuperação obtidos de ensaios de dilatometria em corpos-de-prova isótropos e anisótropos sem vazios
Information on the bending rigid- ity (persistence length) of the nucleoprotein complex and Hfq mediated bridging between different segments of the DNA molecule is then derived from
