HAL Id: hal-02558375
https://hal.archives-ouvertes.fr/hal-02558375
Submitted on 6 May 2020HAL is a multi-disciplinary open access archive for the deposit and dissemination of sci-entific research documents, whether they are pub-lished or not. The documents may come from teaching and research institutions in France or abroad, or from public or private research centers.
L’archive ouverte pluridisciplinaire HAL, est destinée au dépôt et à la diffusion de documents scientifiques de niveau recherche, publiés ou non, émanant des établissements d’enseignement et de recherche français ou étrangers, des laboratoires publics ou privés.
Chemical vapor deposition of Cu films from copper(I)
cyclopentadienyl triethylphophine: Precursor
characteristics and interplay between growth parameters
and films morphology
Nathalie Prud'homme, Vassilios Constantoudis, Asiya Turgambaeva,
Vladislav Krisyuk, Diane Samélor, François Senocq, Constantin Vahlas
To cite this version:
Nathalie Prud'homme, Vassilios Constantoudis, Asiya Turgambaeva, Vladislav Krisyuk, Di-ane Samélor, et al.. Chemical vapor deposition of Cu films from copper(I) cyclopentadienyl tri-ethylphophine: Precursor characteristics and interplay between growth parameters and films mor-phology. Thin Solid Films, Elsevier, 2020, �10.1016/j.tsf.2020.137967�. �hal-02558375�
1
Chemical vapor deposition of Cu films
from copper(I) cyclopentadienyl triethylphophine:
Precursor characteristics and interplay between
growth parameters and films morphology
Nathalie Prud’homme a1
, Vassilios Constantoudis b, Asiya E. Turgambaevac, Vladislav V. Krisyuk c, Diane Samélor d, François Senocq d
,
and Constantin Vahlas d.aICMMO, Université Paris-Sud, Université Paris-Saclay, 15 Rue Georges Clemenceau,
91405 Orsay Cedex, France.
bNCSR Demokritos, Neapoleos 10, 15310 Ag. Paraskevi, Greece, and Nanometrisis, ΤEPA
Lefkippos, Patriarchou Grigoriou & Neapoleos 27, PO Box 60037, 15341 Agia Paraskevi, Greece
c
Nikolaev Institute of Inorganic Chemistry SB RAS, Novosibirsk 630090, Russia
dCIRIMAT, ENSIACET, 4 allée Emile Monso - BP44362, 31030 Toulouse cedex 4 - France
1 Corresponding author : E-mail : nathalie.prudhomme@u-psud.fr, Phone : +33 169 157 097, Fax : +33 169 154 819
2
Abstract
The rough, even discontinuous morphology of vapor-deposited copper films inhibits their attractive electrical properties. In the present study, we investigate the influence of deposition time, deposition temperature, and the flow rate of the precursors on the morphology of Cu films deposited from metalorganic chemical vapor deposition. We show that it is necessary to purify the copper(I) cyclopentadienyl triethylphophine (CpCuPEt3) precursor in order to improve its
stability and volatility. We also determined its saturated vapor pressure law, logPsat (Pa) = 4.368
- 2272/T (K). The Arrhenius plot of the global deposition reaction of Cu films in the presence of hydrogen between 431-523 K shows a low apparent activation energy of 10 kJ/mol. Electron probe microanalysis, grazing incidence X-Ray diffraction, and image analysis of the micrographs obtained by top-down surface scanning electron microscopy reveal metallic films composed of Cu islands. Their size and packed density increase and, ultimately, the islands coalesce with increasing precursor flow rate and, to a lesser extent, with increasing deposition temperature.
Keywords:
Copper(I) cyclopentadienyl triethylphophine; Copper; Thin films; Metal-organic chemical vapor deposition; Coalescence; Nucleation; Morphology; Image analysis
3
1. Introduction
Copper films are widely used as interconnect material seed layers [1-4], for device encapsulation [5], or as components of antimicrobial coatings [6] due to their high electrical conductivity, high ductility, and biocidal nature. Such films are conveniently deposited on flat surfaces by evaporation or sputtering. However, these methods cannot be applied to the metallization of non-line-of-sight surfaces, such as trenches and vias on Si, or the inner walls of tubings such as polymer waveguides [7], because of their weak hole-filling capability and the resulting non-uniformity. As a characteristic example, specifications concerning the metallization of the internal surface of polymer waveguides include the deposition of a film composed of a several-microns-thick, highly conductive, corrosion/oxidation-resistant metal with smooth surface morphology and adherence to the composite substrate. These specifications are not necessarily compatible, since it is difficult to preserve high smoothness while promoting adhesion [8, 9]. The heat sensitivity of polymers gives rise to additional constraints, namely processing at low to moderate temperatures. Alternatively, chemical vapor deposition (CVD) can be used specifically in view of the possibility of achieving conformal films [9-11] combined with relatively elevated growth rates. Despite considerable work on the CVD of Cu, the reluctance of the process to yield smooth films remains to be overcome. Indeed, in general terms, the activation energy for the heterogeneous nucleation of Cu is higher than the activation energy for the growth of 2D structures, e.g. thin films ([12] and references therein). This situation results in rough, even discontinuous films, which are inappropriate for the targeted properties. For these reasons, research since the early days of this technique has focused on monitoring Cu film morphology through the appropriate selection of process conditions [13].
Numerous copper precursors contain oxygen and/or halogen atoms in their ligands, or require oxygen-containing co-reactants for the deposition of copper [14]. However, an oxygen-free
4
precursor can be considered as more appropriate for the processing of metallic films, because alternative, halogen-based deposition chemistries require high process temperatures and they involve corrosive by-products. Copper(I) cyclopentadienyl phosphine derivatives were among the few oxygen- and halogen-free precursors that were investigated in CVD processes [15-21]. CpCuPEt3 (Cp = n5-C5H5, Et = C2H5) was synthesized and characterized in the late fifties, but
it had not been used as a metalorganic CVD (MOCVD) precursor before the 1980s [22] [23]. In the 1990s, it was used in combination with alanes for the co-deposition of Cu-Al films [16, 17]. CpCuPEt3–based CVD processes operate at a relatively low temperature, typically 473 K,
thus allowing surface functionalization of thermally sensitive parts. In our previous investigation of the physical and thermal properties of CpCuPEt3,[24] we defined the law of
𝑃𝑠𝑎𝑡 vs. sublimation temperature in the 313-343K range. We demonstrated that the compound is stable below 343K and that it provides pure copper films in the 423-563K range. We also investigated the heterogeneous thermal decomposition mechanism of CpCuPEt3 by online and
in situ mass spectrometry (MS), revealing all of the changes in the composition of the gas phase [25]. However, no systematic investigation of the film morphology, especially regarding smooth films, has been reported for this suitable adequate Cu precursor, especially considering the previously mentioned unfavorable competition between nucleation and growth. Moreover, the process was observed to be unstable during the course of the various deposition experiments [25]. This instability was attributed to the variation of the precursor characteristics from one batch to the other, revealing the need to purify the precursor and to revisit its thermal behavior. The present contribution aims at investigating these two aspects, namely the precursor thermal behavior and the film morphologies.The purification protocol is presented and a saturated-vapor-pressure behavior is defined as a function of temperature for the purified precursor. The thermal behavior of the latter is established and the Arrhenius plot of the process is determined. Finally, the morphology of the deposited Cu films is systematically investigated as a function
5
of deposition temperature and precursor concentration, taken as representatives of the process parameters.
2. Experimental details
2.1. Precursor
As-received CpCuPEt3 (Strem Chemicals) was purified by sublimation at 313 K and 10-2 Torr.
The elemental composition of the precursor was determined by ICP-MS for Cu and P, and by CHN microanalysis for C and H. Its thermal stability in the condensed phase was investigated by Thermo-Gravimetric and Differential Thermal Analysis (TGA and DTA) under nitrogen flow (40 L/min), from 298 K to 873 K, with a 10 K/min ramp.
The saturated vapor pressure (Psat) of the purified compound was determined with the aim of
controlling the transport conditions in the CVD experiments. Data for Psat versus temperature
were obtained by using a previously described static method.[26] The precursor was conditioned in a homemade sublimator composed of tubing and a frit. In this setup, two valves are positioned before and after the sublimator, and a third one serves as bypass. A new batch of the compound was used for each investigated sublimation temperature. For each temperature, two sequential measurements were performed with the same batch of the compound, with the aim of monitoring the evolution of Psat due to the possible degradation of the compound after
the first measurement. Between the two measurements, the chamber was evacuated to the base pressure. Based on the determined temperature dependence of Psat, the flow rate QCpCuPEt3 of
CpCuPEt3 in the deposition chamber can be estimated from Eq. 1[27].
𝑄𝐶𝑝𝐶𝑢𝑃𝐸𝑡3(𝑠𝑐𝑐𝑚) = 𝑄𝑁2,𝑝𝑟𝑒𝑐×
𝑃𝑠𝑎𝑡(𝑇𝑠𝑎𝑡)
𝑃𝑠𝑢𝑏− 𝑃𝑠𝑎𝑡(𝑇𝑠𝑎𝑡)[1 − 𝑒𝑥𝑝 (−
𝛽 𝑀
6
where M is the mass of precursor introduced in the sublimator in g, QN2,prec is the carrier flow
rate of nitrogen through the sublimator in standard cubic centimeters per minute (sccm), Psat(Tsat) is the saturated vapor pressure in Torr at the sublimation temperature Tsat, Psub is the
pressure in the sublimator in torr, and β is mass transfer coefficient in sccm/g. β values, typically between 0.2 and 4 sccm/g, were determined by mass loss of the precursor in each set of deposition conditions.
2.2. CVD of Cu films
CVD experiments of Cu films were performed in a vertical, cylindrical, stagnant-flow, warm-wall MOCVD reactor, which has been described in detail in [28-30]. The reactor is equipped with a showerhead system, ensuring homogeneous flow of the reactants on the surface of the substrate. 10 x 10 x 1 mm3 Si (100) wafers (Siltronix or ACM) and 304L stainless steel coupons
of various centimeter size were used as substrates. The Si coupons were etched in a 1 ml HF:10 ml H2O solution for 1 min, sonicated in an acetone and ethanol for 5 min, and dried in Ar flow.
The stainless steel substrates were polished with 2400 grade SiC paper: they were then ultrasonically cleaned in ethanol for 5 min and finally dried in Ar flow. Substrates were placed horizontally at different radial positions, on a 58-mm-diameter susceptor (substrate holder) facing the shower plate and heated by a resistance coil just below the surface.
The sublimated CpCuPEt3 precursor was thermally regulated in the evaporator. Two nitrogen
(Air Liquide, 99.999 %) lines were used: one for the transport of the precursor and one for the dilution of the input gas. Hydrogen was used as reducing gas-reactant, flowing at 25 sccm. The total flow rate was maintained at 325 sccm. 19 independent experiments were performed at 1333 Pa, in the temperature range 431-523K. Table 1 lists the ranges of the investigated operating conditions.
7
Table 1. Investigated operating conditions.
Total reactor pressure / Pa 1333
Time / min 90 - 420
Deposition temperature / K 431 - 523 Sublimation vessel temperature / K 326 - 373 Precursor flow rate / sccm 0.004 - 0.070
2.3. Characterizations
We defined the deposition rates as the mass gained per unit surface over the experiment duration (µg.h-1.cm-2). We estimated the rates by weighting the substrates before and after the deposition
experiments in a Sartorius-Genius microbalance, with a ±1 µg precision, corresponding to approximately four monolayers of Cu on the entire coupon surface. We probed the elemental composition of the films by electron probe microanalysis (EPMA) with a CAMECA SX50 instrument and performed a structural investigation by grazing incidence X-Ray diffraction (GIXRD) with a Seifert XRD 3000 TT diffractometer using CuKα radiation and 2 degrees incidence angle. We investigated the morphology of the films by scanning electron microscopy (SEM) with a LEO 435 VP instrument operating at 15 kV and the topography of the films by white light interferometry with a MetroProTM Zygo New View 100 optical interferometer. We analyzed the top-down micrographs obtained by SEM measurements by using the software application nanoTOPO-SEMTM (version 11, Nanometrisis) that quantifies different
characteristics of the film surface morphologies.
3. Results and discussion
8
Sublimation of the as-received brown CpCuPEt3 powder yielded only white, translucent
crystalline particles, in agreement with the expected appearance of the pure compound.[22] Table 2 presents the elemental molar ratios of P, C, and H to Cu for the as-received and purified compounds. The corresponding ratios for the stoichiometric, pure CpCuPEt3 are given for
comparison. There were no significant differences, either between the as-received and the purified compound or between the compounds and the theoretical values. It is worth noting, however, that the content of P and C in the purified compound was closer to the theoretical values than that in the as-received compound. The difficulty in determining the oxygen content prevented us from identifying the nature of the impurities present in the as-received compound. However, the minor deviation from the theoretical value for both as-received and purified samples indicates that the impurities present in the former concern the surface and not the bulk of the individual grains. Considering that the solid-to-gas transformation during the sublimation process takes place through the surface of the grains, such a surficially modified as-received compound is expected to present a lower saturated vapor pressure than the purified compound. Moreover, we observed a progressive change in the color of the purified compound with time, when exposed in ambient conditions: it changed from translucent white to yellow to brownish after some days. This result renders the long term stability of CpCuPEt3 in ambient conditions
questionable, especially in terms of the surface area of its grains. The potential instability, in turn, is expected to shift the effective vapor pressure of CpCuPEt3 toward lower values without,
however, affecting the thermal decomposition in CVD conditions and, subsequently, the characteristics of the obtained Cu films.
Table 2. Elemental molar ratios of P, C, and H to Cu for the as-received and purified CpCuPEt3.
9
Molar ratio P/Cu C/Cu H/Cu As received 0.492 2.110 0.318 Sublimed 0.491 2.089 0.313 Stoichiometric, pure CpCuPEt3 0.487 2.079 0.317
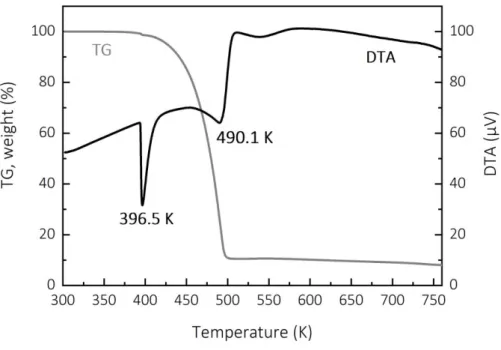
Figure 1 presents the TGA and DTA profiles of the sublimated compound. Weight loss occured in the range of 383–493 K. Above 493 K we obtained a residue that corresponds to 8 wt% of the initial amount. Two endothermic peaks appeared in the DTA curve, at 396.5 K and at 490.1 K. We attribute the first peak to the melting point and the second to the evaporation of the compound. The TGA data show negligible weight loss up to 373 K. These results indicate that CpCuPEt3 is thermally stable under N2 up to 373 K and that it sublimates at higher temperature
under ambient pressure.
Fig. 1: TGA and DTA profiles of the sublimated CpCuPEt3 under N2 flow at atmospheric
10
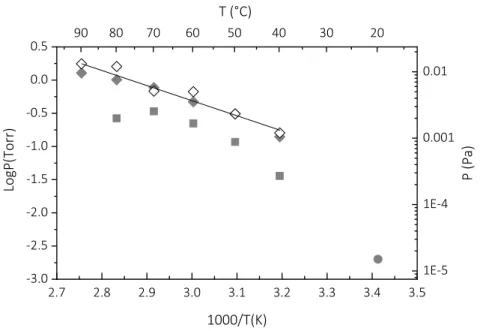
Figure 2 presents the experimentally determined values of the Psat vs. temperature for the
sublimation of purified CpCuPEt3 in the range 313 K to 363 K. Empty and grey diamonds refer
to the first and the second measurements, respectively (see experimental section). The obtained values at each temperature were similar, except for those obtained at 353 K (80 °C) and above. We conclude that the precursor remains stable during the sublimation process up to this temperature, at which point its degradation is initiated. The obtained sublimation law for the purified CpCuPEt3 is:
logPsat (Torr) = 6.493 - 2272/T (K) (2)
and is illustrated in figure 2 by the straight line. The gray squares in Figure 2 represent the previously reported raw Psat vs. temperature points for the as-received compound, which
resulted in a reported sublimation law of logPsat (Torr) = 9.671– 3455/T(K) in the temperature
range 313 K–353 K. [24] These points correspond to systematically lower Psat values than the
ones of the purified compound. The observed Psat drop at 353 K was attributed to a noticeable
decomposition of the precursor. The Psat of non-purified CpCuPEt3 was previously reported as
2.10-3 Torr at 293 K, [22] but information on the adopted experimental protocol was not provided. This value is reported as a gray circle in Figure 2. For this sublimation temperature, the reported laws for the as-received and purified compounds yield Psat values equal to 8.10-3
Torr and 55.10-3 Torr, respectively: i.e., an order of magnitude higher for the purified compounds. We conclude that the purification of the precursor by sublimation enhances the volatility and the stability of CpCuPEt3.
11
Fig. 2: Saturated vapor pressure of the purified CpCuPEt3 as a function of inverse temperature
for two sequential measurements (empty and grey diamonds for the first and second measurements, respectively). The straight line is the obtained sublimation law for the pure precursor (equation 1). Literature results, illustrated by grey squares [24] and the grey circle
[22], are also reported for comparison.
Depending on the adopted operating conditions for the MOCVD experiments, the flow rate of the precursor, estimated from the Eq. 1, varies between 0.004 and 0.070 sccm. The temperature range where Psat of the purified precursor shows a stable, linear (in Arrhenius plot coordinates)
behavior indicates that it is sufficient to ensure precursor transport to feed the MOCVD process.
3.2. Growth rate and crystalline structure
EPMA analysis of the films revealed pure Cu without impurities from heteroatoms such as phosphorus or carbon. For all experiments, we observed a 5- to 30-min nucleation delay. We evaluated it by visual inspection of the illuminated substrate surface through two windows
2.7 2.8 2.9 3.0 3.1 3.2 3.3 3.4 3.5 -3.0 -2.5 -2.0 -1.5 -1.0 -0.5 0.0 0.5 Log P(Torr) 1000/T(K) 90 80 70 60 50 40 30 20 1E-5 1E-4 0.001 0.01 P (Pa) T (°C)
12
mounted on the deposition chamber and defined it as the time needed for the surface color to change from shiny grey to brick red through a sharp color transition. In view of the observed time scale (min), this observation allows the convenient and rather precise determination of the incubation time [31]. The deposition time reported in Table 1 takes into account the proper nucleation delay for each experiment. This phenomenon was also probed in a specific experiment, which consisted of monitoring the gas phase by continuous online MS[25]. Indeed, at 493 K, 11 min after the beginning of the precursor feeding, a sharp decrease in the intensity of the precursor and an increase in the intensity of the Cp2 product peaks were observed,
indicating the beginning of deposition. The optical tracking of the color change of the substrates revealed the onset of copper-film growth at the same time. We conclude that the observed induction period is due to the delay in nucleation on the substrate at this temperature. During the MOCVD experiments, we did not find a correlation between the value of the nucleation delay and either the deposition temperature or the flow rate QCpCuPEt3.
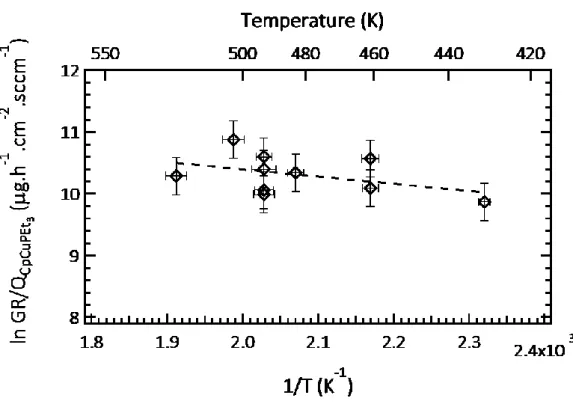
Figure 3 presents the temperature dependence of the growth rate (GR), evaluated on silicon substrates. In this diagram, the mass gain per unit surface and time is divided by the precursor flow rate QCpCuPEt3 (µg.h-1.cm-2.sccm-1). Presenting the growth rate in this manner overcomes
the difference among the different experiments concerning the precursor feeding. Only one region is notable in this semilogarithmic plot of GR/QCpCuPEt3 vs. reciprocal temperature. In the
temperature range of 423 K–523 K, the film growth rate is almost constant with a slight increase with increasing temperature. The apparent activation energy of the global deposition mechanism, obtained from the slope of the linear plot, is low (roughly 10 kJ/mol). Krisyuk et al. reported a similar behavior for copper deposition, namely a weak dependence of the GR in the temperature range of 513 K–573 K, corresponding to a diffusion-controlled regime.[32] They also observed a sharp linear increase of the GR at temperatures up to 513 K, indicative of a surface-reaction-controlled regime with an activation energy of 65 kJ/mol. In another study
13
on MOCVD of Cu, Addou et al. reported two regions in the Arrhenius plot of the GR on Si substrate: a diffusion-limited regime with a minor variation of the GR (468 K-493 K) and a surface-reaction-limited region at lower temperatures, for which they report an activation energy equal to 50 kJ/mol.[9] Interestingly, the activation energy in the diffusion-limited regime, estimated from their reported Arrhenius plot (Figure 1 in [9]), is 12 kJ/mol: i.e., almost identical to the present one. Beach et al. [33] studied copper deposition from CpCuPEt3 on
Cr/Cu-seeded Si substrate and determined an activation energy of 75 kJ/mol in the temperature range 423-483 K. From these different reports, we can conclude that the very low value of activation energy obtained in the present work corresponds to a diffusion-limited regime. Moreover, we observed that an increase of the precursor concentration in the input gas — through the increase of the sublimation temperature and/or the increase of the nitrogen flow rate through the evaporator — results in an increase in the growth rate. This result applies also to a diffusion-controlled regime in these conditions.
We also observed a decrease in the GR with decreasing deposition time when all the other process parameters were kept constant. This is in agreement with the results obtained by online MS monitoring of the gas phase during the deposition experiments.[25] During deposition at 493 K, MS monitoring revealed a monotonic increase in the intensity of the precursor and a decrease in the intensity of the deposition reaction products with deposition time at low deposition temperature. This confirmed a gradual decrease in the growth rate. Such non-steady-state behavior may be attributed to the saturation of the growing surface with adsorbed phosphine, which hinders precursor supply to the deposition zone. Indeed, Holl et al. [34] reported that PEt3 is well adsorbed on the copper surface in the investigated temperature range,
and CVD from phosphine-containing precursors should be performed at a higher temperature to desorb the surface-adsorbed PEt3. The phenomena observed in our experiments agree with
14
PEt3, on the surface is favored with increasing temperature, resulting in a moderate increase of
the available surface-nucleation sites. This, in turn, allows for a corresponding increase in the Cu growth rate.
Fig. 3. Plot of the MOCVD growth rate divided by the estimated flow rate of CpCuPEt3
(GR/QCpCuPEt3) of Cu as a function of the inverse of the growth temperature.
3.3. Surface morphology
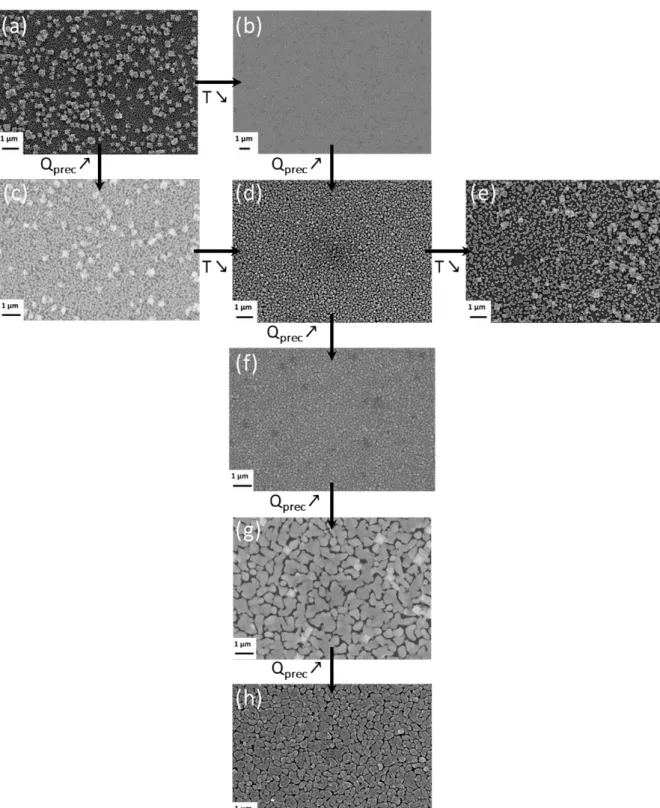
Figure 4 presents SEM surface micrographs of Cu films deposited at different temperatures and precursor feeding rates, from 431–523 K and 0.006–0.070 sccm, respectively. Further information on the deposition conditions of the films shown in Figure 4 is presented in Table 3. For all the investigated deposition conditions, the films presented a nodular smooth morphology that is characteristic of a Wolmer-Weber type island growth. The grain size was approximately 40-60 nm for the film deposited with QCpCuPEt3=0.006 sccm (fig. 4a and 4b); it
15
493 K and 0.02 sccm (fig. 4f). XRD analysis revealed that the size of Cu crystallites, estimated using Sherrer’s equation from the (111) diffraction peak, also increased with increasing precursor feeding rate. Indeed, the crystallite size was 20 nm and 40 nm with 0.01 sccm and 0.07 sccm CpCuPet3 flow rate, respectively. The simultaneous increase of the size of crystallites
and grains with increasing precursor flow rate resulted in the coalescence of the grains (fig. 4g and 4h) and, consequently, yielded films with improved continuity. On the other hand, the grain size decreased slightly with increasing substrate temperature (fig 4e, 4d and 4c).
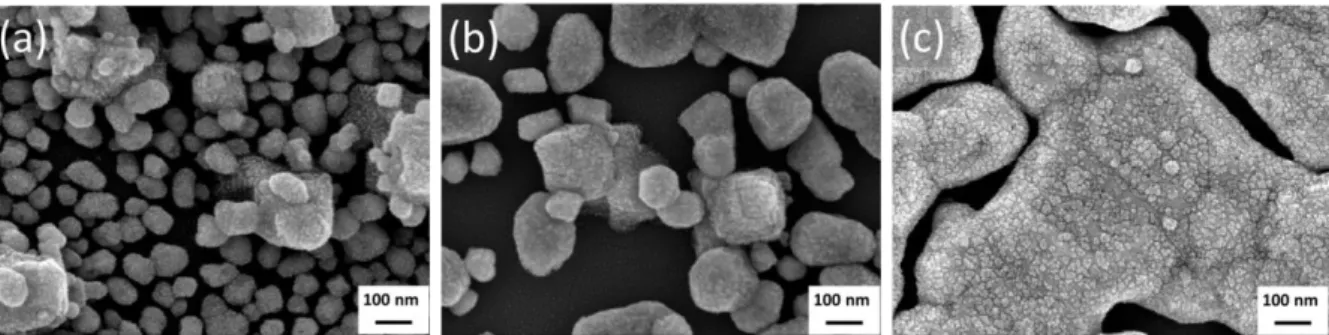
When the deposition time was longer than 210 min (Table 3 and fig 4a, 4c, 4e), we observed brighter spots of larger Cu aggregates on the surface of the film. Higher magnification images in Fig 4a and 4e are presented in Fig 5a and 5b, respectively. We attribute such preferential local growth to the adsorption of decomposition byproducts on the growing surface, namely triethylphosphine, which made the nucleation sites temporarily unavailable, thereby allowing growth recovery only after a deposition time greater than 210 min (in the present case).
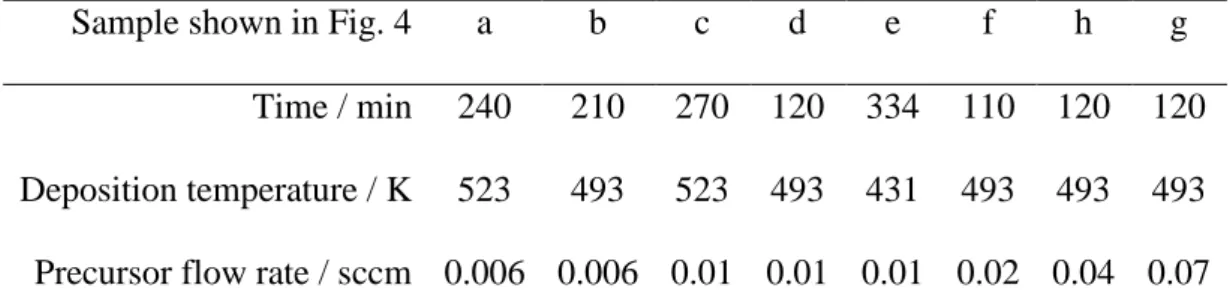
Table 3. Operating conditions of Cu samples shown in Fig.4.
Sample shown in Fig. 4 a b c d e f h g Time / min 240 210 270 120 334 110 120 120 Deposition temperature / K 523 493 523 493 431 493 493 493 Precursor flow rate / sccm 0.006 0.006 0.01 0.01 0.01 0.02 0.04 0.07
16
Fig. 4. Top-down view SEM images showing the morphology of the copper films grown on Si wafers under conditions summarized in Table 3.
17
Fig. 5. Higher magnification top-down view SEM images (a) Fig. 4a, (b) Fig. 4e, and (c) Fig. 4h.
We used top-down SEM images to calculate the coverage of silicon substrates by copper and the period (if any) of the morphology of deposited material. Figure 6 shows the two main tools we used to analyze the SEM images: the histogram of pixel intensities of images (Fig. 6a) and the radially averaged Fourier spectrum (Fig. 6b). Not surprisingly, the micrographs are characterized by bimodal histograms with two peaks corresponding to the dark regions of the substrate and the brighter pixels of the deposited material, respectively. The bimodal character dictated the definition of the threshold at the minimum between the peaks (see Fig. 6a where the threshold is defined at ~0.27). Additionally, we used Fourier analysis to identify and measure the periodicity of the deposited films. Figure 6b shows a typical Fourier spectrum (amplitude) of a top-down SEM image, in which the prominent peak justifies the presence of periodicity in the deposited morphology, with a period defined by the inverse of the peak frequency. Using these methods, we measured the coverage and period of the deposited copper films. The results are shown in Figure 7 for the majority of the images displayed in figure 4 to illustrate the impact of temperature and precursor flow rate.
18
Fig. 6. Histogram of the pixel intensities of a typical top-down SEM micrograph of the copper surface morphology (a). The bimodal character is evident with a peak at the dark pixels of the substrate and a second peak at the brighter pixels of the deposited material, respectively. It is clear that the reasonable choice of the threshold to measure the film coverage by copper is at the local minimum between the two peaks (~0.27 at this case). Circularly averaged 1D Fourier transform of a typical morphology after deposition with a single peak used for the calculation of the period of morphology (b).
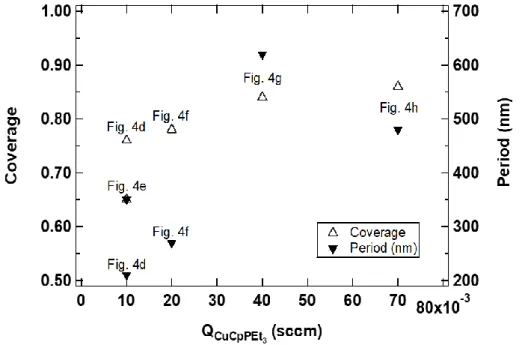
The results show that when the deposition temperature decreased from 493 K (Fig. 4d) to 431 K (Fig.4e), the film coverage shrank while the period of their morphology elevated from 210 nm to 350 nm. The latter behavior is consistent with our expectation that the decrease in the deposition temperature of constraints the desorption of decomposition products, namely triethylphosphine, resulting in less dense morphologies with a greater period. This is also consistent with the observations by Shima et al. that a lower deposition temperature leads to a larger nucleate density, which suggests that Cu CVD conditions follow the general nucleation behavior as physical phenomena: the CVD reaction is not the limiting step to promote nucleation.[35]
19
A second observation from the results in Figure 7 pertains to the effects of precursor flow rate. We observed a noticeable increase in period from 0.02 sccm (Fig. 4f) to 0.04 sccm (Fig. 4g) and 0.07 sccm (Fig. 4h and Fig. 5c), whereas the coverage remained almost similar with a slight increase from 0.78 to 0.84 and 0.86, respectively. The fact that the morphologies of figures 4g and 4h become broader with much wider local features and uniformity points to the predominance of coalescence over nucleation. The morphologies of figures 4g and 4h (channel-like structure) were also observed by Hagen et al., who attributed these features to a coalescence becoming less complete because of the decrease of curvature gradients when the deposition is further continued.[36] Shima et al. also observed an increased coalescence with increasing amounts of precursor in the gas phase and predicted that a higher partial pressure of the precursor would result in a a larger Cu nucleation density, which is confirmed by our observations.[35] The methodology in our study provides a quantitative assessment of the contribution and interplay of the two fundamental mechanisms of nucleation and coalescence.
Fig. 7. Coverage (left axis) and period (right axis) of Cu films, measured using the methodology illustrated in figure 6, as a function of QCpCuPEt3. The source surface SEM micrographs of figure
20
These results show that a high precursor flow rate QCpCuPEt3 > 0.02 sccm) allows the
predominance of coalescence effects over nucleation processes. The channel-like morphology (fig 4g and 4h) obtained in these conditions should impart a lower value of resistivity than that imparted by the island morphology. Indeed, the electrical resistivity of copper film prepared by ALD was 17 µΩ.cm for island morphology, as compared with the much lower value of 7.6 µΩ.cm for channel-like morphology and 1.7 µΩ.cm for the bulk, monocrystalline Cu.[36]
4. Conclusions
The MOCVD of Cu films from CpCuPEt3 was investigated to determine precursor
characteristics and the interplay between growth parameters and film morphology. We show here that it is necessary to purify the compound in order to obtain the best stability and volatility up to 363 K. The Psat values obtained from the purified precursor obey the logPsat (Pa) = 4.368
- 2272/T (K) relation; they are convenient to ensure precursor transport in MOCVD process. The obtained Cu films are pure. The Arrhenius plot of the Cu growth rate yields an activation energy of 10 kJ/mol, showing weak dependence on the deposition temperature. This observation, in conjunction with literature results, indicates a diffusion-controlled regime in these deposition conditions.
For all the investigated conditions, the films present nodular, smooth morphology, which is characteristic of a Wolmer-Weber type island growth. From the SEM images, we observed a simultaneous increase in the size of crystallites and grains with increasing precursor flow rate, resulting in the coalescence of the grains and, consequently, in improved film continuity. We also observed a slight decrease of the grainsize with increasing deposition temperature. Image analysis of SEM top-down micrographs revealed that when the deposition temperature
21
decreased from 493 K to 431 K, the film coverage shrank while the period of their morphology increased from 210 nm to 350 nm. The latter behavior meets our expectation that the decrease of deposition temperature limits the desorption of decomposition products, namely triethylphosphine, resulting in less dense morphologies. We observed a noticeable increase in period with an increas in theprecursor flow rate from 0.02 sccm to 0.04 sccm to 0.07 sccm, whereas the coverage remained almost similar with a slight increase from 0.78 to 0.84 to 0.86, respectively. This indicates that the channel-like morphologies became broader with much wider local features and uniformity, underpinning the dominance of coalescence effects over nucleation processes.
With a specially developed methodology of image treatment, we quantified the period (density) and coverage to assess the contribution of nucleation and coalescence, respectively, as well as the interplay of these two fundamental mechanisms. Subsequently, we addressed the link between structure (coverage) and function (electrical conductivity). From a more general perspective, this work strengthens the correlations among processing, structure, and function by means of precursor insight and advanced and targeted morphological characterization of structure.
Acknowledgements
We are indebted to Y. Thebault and to P. de Parseval for FEG-SEM and EPMA analysis, respectively. This work was partly supported by CNRS and RFBR through grants PRC 1986/2018 and 18-53-15005, respectively.
22
[1] Y.M. Zhang, T. Hang, M.Y. Dong, Y.W. Wu, H.Q. Ling, A.M. Hu, M. Li, Effects of 2-mercaptopyridine and Janus Green B as levelers on electrical resistance of electrodeposited copper thin film for interconnects, Thin Solid Films, 677 (2019) 39-44.
[2] H.J. Chae, K.Y. Song, S.K. Joo, Polycrystalline-silicon thin-film transistor fabricated with Cu gate controlled morphology by plating mode, Thin Solid Films, 661 (2018) 128-131. [3] R. Solanki, B. Pathangey, Atomic layer deposition of copper seed layers, Electrochem. Solid-State Lett., 3 (2000) 479-480.
[4] J.S. Thompson, L. Zhang, J.P. Wyre, D.J. Brill, K.G. Lloyd, Vapor phase deposition of copper films with a Cu(I) beta-diketiminate precursor, Thin Solid Films, 517 (2009) 2845-2850. [5] X.J. Yan, H. Wang, D.H. Yan, An investigation on air stability of copper phthalocyanine-based organic thin-film transistors and device encapsulation, Thin Solid Films, 515 (2006) 2655-2658.
[6] S.L. Aktug, S. Durdu, S. Aktas, E. Yalcin, M. Usta, Characterization and investigation of in vitro properties of antibacterial copper deposited on bioactive ZrO2 coatings on zirconium, Thin Solid Films, 681 (2019) 69-77.
[7] Y.Q. Xiong, H.J. Gao, N. Ren, Z.W. Liu, Atomic layer deposition of copper thin film and feasibility of deposition on inner walls of waveguides, Plasma Sci. Technol., 20 (2018) 035507. [8] T. Duguet, F. Senocq, L. Laffont, C. Vahlas, Metallization of polymer composites by metalorganic chemical vapor deposition of Cu: Surface functionalization driven films characteristics, Surface & Coatings Technology, 230 (2013) 254-259.
[9] F. Addou, T. Duguet, P. Bosso, A.N. Zhang, E. Amin-Chalhoub, F. Fanelli, C. Vahlas, Metallization of carbon fiber reinforced polymers: Chemical kinetics, adhesion, and properties, Surf. Coat. Technol., 308 (2016) 62-69.
23
[10] S.P. Murarka, R.J. Gutmann, A.E. Kaloyeros, W.A. Lanford, Advanced multilayer metallization schemes with copper as interconnection metal, Thin Solid Films, 236 (1993) 257-266.
[11] J.A.T. Norman, B.A. Muratore, P.N. Dyer, D.A. Roberts, A.K. Hochberg, L.H. Dubois, A new metal organic-chemical vapor-deposition process for selective copper metallization, J. Mater. Sci. Eng. B, 17 (1993) 87-92.
[12] T.T. Kodas, M.J. Hampden-Smith, The Chemistry of Metal CVD, VCH, Weinheim, Germany, 1994.
[13] G.M. Psarellis, I.G. Aviziotis, T. Duguet, C. Vahlas, E.D. Koronaki, A.G. Boudouvis, Investigation of reaction mechanisms in the chemical vapor deposition of al from DMEAA, Chem. Eng. Sci., 177 (2018) 464-470.
[14] V.V. Krisyuk, L. Aloui, N. Prud’homme, S. Sysoev, F. Senocq, D. Samélor, C. Vahlas, CVD of pure copper films from amidinate precursor, Electrochem. Sol. State Lett., 14 (2011) D26-D29.
[15] S. Chichibu, N. Yoshida, H. Higuchi, S. Matsumoto, Chemical vapor-deposition of Cu film on SiO2 using cyclopentadienylcoppertriethylphosphine, Jpn. J. Appl. Phys., Part 2, 31
(1992) L1778-L1780.
[16] T. Katagiri, E. Kondoh, N. Takeyasu, T. Nakano, H. Yamamoto, T. Ohta, Metalorganic chemical vapor deposition of aluminum-copper alloys films, Jpn. J. Appl. Phys. Pt. 2, 32 (1993) L1078-L1080.
[17] E. Kondoh, Y. Kawano, N. Takeyasu, T. Ohta, Interconnection formation by doping chemical-vapor-depositon aluminum with copper simultaneously: Al-Cu CVD, J. Electrochem. Soc., 141 (1994) 3494-3499.
24
[18] M.J. Hampden-Smith, T.T. Kodas, M. Paffett, J.D. Farr, H.-K. Shin, Chemical Vapor Deposition of Copper from Copper(I)Trimethylphospine c ompounds, Chem. Mater., 2 (1990) 636-639.
[19] G. Wilkinson, T.S. Piper, Cyclopentadienyl-triethylphosphine-copper(I) and bis-cyclopentadienylmercury(II), J. Inorg. Nucl. Chem., 2 (1956) 32-37.
[20] G.M. Whitesides, J.S. Fleming, A nuclear magnetic resonance study of .sigma.-cyclopentadienyl(triethylphosphine)copper(I), J. Am. Chem. Soc., 89 (1967) 2855–2859. [21] F.A. Cotton, T.J. Marks, Systematic preparation and characterization of pentahaptocyclopentadienylcopper(I) compounds, J. Am. Chem. Soc., 92 (1970) 5114–5117. [22] C.G. Dupuy, D.B. Beach, J.E. Hurst, J.M. Jasinski, Laser induced deposition of copper from (triethylphosphine)cyclopentadienylcopper(I), Chem. Mater., 1 (1989) 16–18.
[23] K. Hara, T. Kojima, H. Kukimoto, Epitaxial Growth of CuGaS2 by Metalorganic Chemical
Vapor Deposition, Jpn. J. Appl. Phys., 26 (1987) L1107-L1109.
[24] F. Senocq, A. Turgambaeva, N. Prud'homme, U. Patil, V.V. Krisyuk, D. Samelor, A. Gleizes, C. Vahlas, Thermal behaviour of CpCuPEt3 in gas phase and Cu thin films processing,
Surf. Coat. Techn., 201 (2007) 9131–9134.
[25] A.E. Turgambaeva, N. Prud’homme, V.V. Krisyuk, C. Vahlas, Mass spectrometric monitoring of the gas phase during chemical vapor deposition of copper from copper cyclopentadienyl triethylphosphine, Chem. Vap. Dep., 18 (2012) 209-214.
[26] F. Juarez, M.-C. Lafont, F. Senocq, C. Vahlas, Chemical vapor deposition in spouted bed reactors., in: M.D. Alendorf, F. Teyssandier, F. Maury (Eds.) Chemical Vapor Deposition XVI and EUROCVD14, The Electrochemical Soc., Paris, 2003, pp. 538-548.
[27] C. Vahlas, B. Caussat, F. Senocq, W.L. Gladfelter, L. Aloui, T. Moersch, An original device for the delivery of vapors to a deposition apparatus based on the sublimation in a fluidized bed, Chem. Vap. Dep., 13 (2007) 123-129.
25
[28] T.C. Xenidou, A.G. Boudouvis, N.C. Markatos, D. Samélor, F. Senocq, A.N. Gleizes, N. Prud’homme, C. Vahlas, An experimental and computational analysis of a MOCVD process for the growth of Al films using DMEAA, Surf. Coat. Techn., 201 (2007) 8868-8872.
[29] T.C. Xenidou, N. Prud’homme, C. Vahlas, N.C. Markatos, A.G. Boudouvis, Reaction and transport interplay in Al MOCVD investigated through experiments and computational fluid dynamic analysis., J. Electrochem. Soc., 157 (2010) D633-D641.
[30] I.G. Aviziotis, N. Cheimarios, C. Vahlas, A.G. Boudouvis, Experimental and Computational Investigation of Chemical Vapor Deposition of Cu from Cu Amidinate, Surf. Coat. Techn., 230 (2013) 273-278.
[31] I.G. Aviziotis, T. Duguet, K. Soussi, G. Kokkoris, N. Cheimarios, C. Vahlas, A.G. Boudouvis, Investigation of the kinetics of the chemical vapor deposition of aluminum from dimethylethylamine alane: experiments and computations, Phys. Status Solidi C, 12 (2015) 923-930.
[32] V.V. Krisyuk, L. Aloui, N. Prud’homme, B. Sarapata, F. Senocq, D. Samélor, C. Vahlas, CVD of pure copper films from a novel amidinate precursor, ECS Transactions, 25 (2009) 581-586.
[33] D.B. Beach, F.K. LeGoues, C.-K. Hu, Low temperature chemical vapor deposition of high purity copper from an organometallic source, Chem. Mater., 2 (1990) 216-219.
[34] M.M.B. Holl, P.F. Seidler, S.P. Kowalczyk, F.R. McFeely, Surface reactivity of alkylgold(I) complexes - substrate - selective chemical-vapor-deposition of gold from RAuP(CH3)3 (R=Ch2Ch(3), Ch3) at remarkably low-temperatures, Inorg. Chem., 33 (1994) 510-517.
[35] K. Shima, H. Shimizu, T. Momose, Y. Shimogaki, Comparative Study on Cu-CVD Nucleation Using beta-diketonato and Amidinato Precursors for Sub-10-nm-Thick Continuous Film Growth, ECS J. Solid State Sci. Technol., 4 (2015) P305-P313.
26
[36] D.J. Hagen, J. Connolly, I.M. Povey, S. Rushworth, M.E. Pemble, Island Coalescence during Film Growth: An Underestimated Limitation of Cu ALD, Adv. Mater. Interf., 4 (2017) 1700274.