Comprehensive single-cell transcriptional profiling of the
regenerative planarian Schmidtea mediterranea
by
Christopher T. Fincher B.A. Honors, Biology (2012)
University of Pennsylvania, Philadelphia, PA Submitted to the Department of Biology
In Partial Fulfillment of the Requirements for the Degree of Doctor of Philosophy
at the
MASSACHUSETTS INSTITUTE OF TECHNOLOGY September 2020
© 2020 Massachusetts Institute of Technology. All rights reserved The author hereby grants to MIT permission to reproduce and to distribute
publicly paper and electronic copies of this thesis document in whole or in part in any medium now known or hereafter created.
Signature of Author: _____________________________________________________ Department of Biology July 22nd, 2020 Certified by: ____________________________________________________________ Peter W. Reddien Professor of Biology Thesis Supervisor Accepted by: ___________________________________________________________ Mary Gehring Associate Professor of Biology Co-Director, Biology Graduate Committee
Comprehensive single-cell transcriptional profiling of the regenerative planarian
Schmidtea mediterranea By
Christopher T. Fincher
Submitted to the Department of Biology on July 22, 2020 in Partial Fulfillment of the Requirements for the Degree of Doctor of Philosophy in Biology
Abstract
Animals can contain hundreds of cell types, each of which has a distinct morphology and function. The transcriptome of a cell dictates this unique cell biology. Recent approaches for high throughput single-cell RNA sequencing have made it possible to generate transcriptomes easily and affordably for tens of thousands of single cells, raising the possibility that transcriptomes could be generated for all cell types and cell states in a complete animal. Planarians are freshwater flatworms renowned for their capacity for whole-body regeneration. They possess a complex body plan with multiple distinct tissues. They also possess a population of dividing cells, called neoblasts, which contain pluripotent stem cells and are the source of all new tissue, with all cell types being turned over throughout the life of the animal. Planarians also constitutively express an arrangement of regionally expressed genes in their muscle that serve as patterning information for the animal. As such, at a single time point in the adult, pluripotent stem cells, all differentiated cells, and all associated transition states from stem cell to differentiated cell can be recovered, including patterning information expressed in muscle. This makes planarians ideally suited to generating an atlas of transcriptomes for all cell types and cell states in a whole animal. We used the single-cell RNA sequencing technology Drop-seq to determine the transcriptomes for 66,783 cells from adult planarians. In doing so, we identified a number of known and novel cell populations, including a novel class of phagocytic cells. We also uncovered novel neoblast subpopulations and putative transition state populations between neoblasts and differentiated cells, as well as a number of genes with regional expression in
muscle. Through the identification of known rare cell types in the data, we conclude that we have obtained near-to-complete cell type saturation for all cell types and cell states in the adult planarian. We now have full transcriptomes for each of these cell
populations, which can be utilized to assay their roles in planarian biology. This approach can also be applied widely to diverse animal species, including those with limited molecular tools available.
Thesis Supervisor: Peter W. Reddien Title: Professor of Biology
Acknowledgements
First and foremost, I would like to thank my advisor Peter Reddien for giving me the opportunity to work in your lab for my PhD work. Your scientific insight and rigor and your extensive knowledge of pretty much any topic imaginable has allowed me to grow immensely as a scientist over my time in the lab. You have also been a fantastic
mentor, and your passion for science helped keep me excited about my research, even through the inevitable slumps.
I would like to thank my committee members, Omer Yilmaz, Iain Cheeseman, and Terry Orr-Weaver, for their advice and support throughout my graduate school journey. I would also like to thank Evan Macosko for taking the time to serve as the external member of my defense committee.
I would like to thank the many members of the Reddien lab that I’ve had the pleasure of working with over the years. You’ve been both amazing labmates and great friends these past years. From karaoke, to fishbowls at the Kong, to photobooths, to being robbed of best costume prizes, to woefully misguided participation in Movember, each of you have made my time in lab and in grad school a truly great experience. Also, some of my toughest times have come during grad school, and you guys were instrumental in getting me through them. I am forever grateful.
Through my time in grad school, I’ve had the pleasure of meeting a number of people here at MIT that have become great friends. In particular, I would like to thank Josh, Danny, Spencer, Santi, and John for helping me afford to live in Cambridge, but also my other MIT friends: Laurens, Grace, Nolan, Rohan, and everyone else. From trips to Salem, MA and other exotic locales, to ski trips and weddings, you guys have made my time in grad school absolutely amazing.
I would like to thank my boyfriend Doug. Thanks so much for all the great times we’ve had the past couple of years and for all of your support. You’ve helped me get through some truly tough times the past couple of years, and I’ll never be able to thank you enough.
Finally, I wanted to thank my family, and in particular my mom and my grandparents. Your love and support and the sacrifices you’ve made over the years have been essential to getting me to where I am today. I truly would not have been able to accomplish this without you.
Table of Contents
Chapter 1: Introduction ………9
Foreword………...10
I. Tools for single-cell genomic analysis………..11
II. Planarians as a regenerative model system ………..42
III. Content overview………61
References………62
Chapter 2: Cell type transcriptome atlas for the planarian Schmidtea mediterranea………………....80
Abstract……….81
Introduction………...82
Results & Figures………84
Discussion………..185
Materials and Methods……….190
Table Captions ………..…….………..…214
Acknowledgements………...………215
References……….216
Chapter 3: Discussion ……….223
I. Successful strategy for generating transcriptomes for all cell types of an animal…...224
II. Identification of novel specialized neoblasts and transition states………225
III. Identification of novel differentiated cell types………229
VI. Identification of novel regionally expressed genes………232
V. Conclusion……….233
Chapter 1
Introduction
Foreword
Multicellular animals can contain trillions of cells and hundreds of distinct cell types. Cell type composition changes dramatically during development from a fertilized egg to a mature adult organism. Distinct cell types in an animal are typically highly
interconnected, with heterogenous cell types composing functionally distinct organs and organ systems. The actively transcribed set of genes within cells, the transcriptome, dictates the unique morphology and function of distinct cell types. Therefore, to
understand the complex and interconnected biology underlying a multicellular organism, the actively transcribed genes for all cell types and cell states within an animal across its development must be determined. Recent advances in single-cell RNA sequencing technologies have made this daunting task a possibility. My thesis work focused on generating such a whole-animal cell type transcriptome atlas for the planarian
Schmidtea mediterranea, a regenerative flatworm that is especially well suited as a
case study for determining the transcriptomes of all cell types and cell states in a whole animal. The introductory chapter of this thesis will introduce the history of single-cell genomic technologies, including a summary of approaches that are currently available for the generation and analysis of single-cell genomic data, as well as an overview of how these methods are currently being used to transform diverse fields of biology. I will then introduce planarians as a model system, including the many features that make it especially well-suited for transcriptionally profiling all cells in a whole animal. My work aims to both provide insight into the cellular basis for the fascinating biology of this regenerative organism, as well as to provide a framework for generating such a whole-animal single-cell transcriptomic resource for diverse species across the whole-animal
I.
Tools for single-cell genomic analysis
Genome sequencing projectsThe complete genome sequence of the first free-living organism was released in 1995 for the bacterium Haemophilus influenzae (1). Over the next 3 years, completed genomes were released for the eukaryotic budding yeast Saccharomyces cerevisiae (2), the bacterium Escherichia coli K-12 (3), the archaeon Methanococcus jannaschii (4), and the bacterium Mycobacterium tuberculosis (5). In 1998, the complete genome sequence of a multicellular organism, the roundworm Caenorhabditis elegans, was completed (6), followed by the fruit fly Drosophila melanogaster in 2000 (7). In 2001, the first drafts of the human genome were completed (8, 9). Since that time, scores of animal genomes have been completed across the animal kingdom and individual human genomes can now be sequenced both quickly and affordably.
The complete sequencing of animal genomes has had a profound impact on biological research. The identification of genes and regulatory regions important for human health has been greatly accelerated, and we have identified many genes important for human health that are conserved across many animal species. By comparing genomes across the animal kingdom, our ability to phylogenetically group organisms, before largely limited to physiological traits, has transformed our understanding of evolutionary biology. With the ease and affordability of genome sequencing, we can now sequence the entire genomes of understudied animal, plant, microbial, and viral species, with wide ranging potential for discovering new biology and improving human health.
The advance of transcriptomic capabilities
Despite the profound impact of whole genome sequencing on biological research, animals can contain hundreds of distinct cell types, each of which contains essentially the same DNA content. It is the transcriptome, or the actively transcribed set of genes, that dictates the unique morphology and function of a cell. The capability to sequence actively transcribed genes from cells was first demonstrated in 1983, with the
sequencing of 178 clones from a rabbit muscle cDNA library using Sanger sequencing (10). More such cDNA sequences, later termed expressed sequence tags (ESTs), were generated by Sanger sequencing and compiled over the next decade (11). In 1995, two higher throughput methods for assessment of the sets of active genes from a biological sample were developed: serial analysis of gene expression (SAGE) and microarray technology (12, 13). SAGE involved the generation and concatenation of short sequence tags from a cDNA library (generated using oligo (dT) primers) into long constructs that could be cloned and sequenced, allowing for more multiplexed
sequencing and the identification of thousands of transcripts from the pancreas (12). Microarray technology involved the printing of pre-defined complementary DNA sequences onto glass chips, allowing for the detection of corresponding gene
expression using hybridization of fluorescently labeled cDNA libraries, and became the dominant method for high-throughput identification of actively transcribed genes for the next decade (13). In 2006, a more unbiased approach called RNA sequencing (RNA-seq) was developed, in which fragmented cDNA was amplified by polymerase chain reaction (PCR) using ligated adapter sequences, followed by annealing of sequencing primers and sequencing using Roche/454 technology, enabling detection of transcripts from 10,000 gene loci from cultured human pancreatic cells (14). A more
high-throughput Illumina-based technology was developed in 2008 (15, 16, 17). RNA-seq has since become a standard laboratory tool, enabling full transcriptomes to be generated easily and affordably for tissues and populations of cells.
Single-cell RNA sequencing technologies
As with whole-genome sequencing, the ability to easily and affordably generate transcriptomes was transformational for biological research, allowing most genes actively expressed by a group of cells or tissues to be elucidated. Previously described RNA-sequencing strategies can only be performed on bulk populations of tissues or cells, however. As a result, transcriptomes generated by these methods are aggregates across multiple cell types and cell states, averaging out any heterogeneity in gene expression between transcriptionally distinct cell populations and drowning out rare
transcripts expressed by rare cell types in the sample. To overcome these limitations, a number of strategies were developed over the last decade that have allowed for the generation of transcriptomes from single cells.
Approaches for single-cell microarrays (18, 19) and single-cell RT-qPCR (20), which could be combined with microfluidic arrays, allowing for multiplexed measurements of hundreds of cells (21), were first developed in the 90’s and were widely used to measure gene expression in single cells. However, these methods only enabled profiling of a limited set of pre-defined genes, not full transcriptomes. The first method for non-biased RNA sequencing of single cells, allowing for full transcriptome
determination, was described in 2009 and is commonly referred to as the Tang method (22) (Figure 1.1A). This method involved isolating single cells into wells, where the cells were lysed and mRNA was reverse transcribed using an oligo-DT primer. A poly (A) tail was then added and the second DNA strand was generated using a poly (T) primer. The cDNA was amplified by polymerase chain reaction (PCR) using adapter sequences added during cDNA synthesis. The products were then sheared, sequencing adaptors with barcode sequences unique to each sample were ligated onto the fragments, and the libraries were pooled and sequenced. Although the method was a major
breakthrough, allowing transcriptomes for single cells to be generated, the method had a fairly low sensitivity and a significant 3’ bias.
In 2012, a method called SMART-seq was developed that improved on many of these issues (23) (Figure 1.1B). SMART-seq takes advantage of Moloney Murine Leukemia Virus (MMLV) reverse transcriptase, which adds extra C nucleotides to the 3’ end of the cDNA product. In a strategy called template switching, a template switch oligo (TSO) containing an adapter sequence with added G ribonucleotides is added to the reverse transcription (RT) reaction, which also contains an oligo (dT) primer with the same adapter sequence. First strand cDNA is generated using the oligo (dT) primer, and the added G ribonucleotides of the TSO act as primers for a second round of RT, allowing both first and second strand cDNA to be generated in the same reaction (Figure 1.1B).
PCR amplification is then performed using a single primer to the adapter sequence. Barcoded sequencing libraries are generated using Nextera transposon-based tagmentation (Illumina, Inc.), in which transposons simultaneously fragment the DNA and add primers to the ends of the fragments. Illumina sequencing adapters are then added through PCR, and the libraries are pooled and sequenced. SMART-seq provided great performance increases over the Tang method and was further optimized over the next couple of years with the development of SMART-seq2, which is still widely used today (24, 25). Template switching was also adopted by many future single-cell sequencing technologies (Table 1.1).
A number of similar single-cell sequencing methods have been developed over the past decade that involve separating single cells into wells and barcoding and pooling
individual samples just prior to sequencing. Quartz-seq, an approach similar to the Tang method, was released just prior to SMART-seq2 (26, 27) (Figure 1.1A). However, it was largely inferior in performance to SMART-seq2 and was not widely adopted. SUPeR-seq is another approach, also similar to the Tang method, that uses random primers for RT, allowing for single-cell sequencing of RNA species other than mRNA (28) (Figure 1.1A). MATQ-seq similarly allows for sequencing of RNA species other than mRNA by using both poly (dT) and internal primers for RT, followed by poly (C) tailing and second strand DNA synthesis using poly (G) primers (29) (Figure 1.1A). Unlike the previously described methods, MATQ-seq adds a unique barcode, called a UMI, to each RNA species in a sample during second strand cDNA synthesis, allowing for the identification of amplification artifacts. This innovation was originally demonstrated by another single-cell sequencing approach, MARS-seq, which is described below (30).
For each of the single-cell RNA sequencing technologies described thus far, individual samples are indistinguishable until the addition of barcoded sequencing adapters just prior to sequencing and cannot be pooled until this time. As such, these methods are generally more low throughput, are work intensive, and have a relatively high cost per cell, limiting the number of cells that can reasonably be sequenced. A number of
approaches were released that overcame this limitation by introducing unique barcodes to each sample early in the protocol. The earliest such approach was CEL-seq, in which cells are sorted into wells and RT is performed using a primer carrying a T7 promoter, an Illumina sequencing adapter, a sample-specific barcode sequence, and a poly (T) sequence (31) (Figure 1.1C). Second-strand DNA synthesis is then performed, followed by pooling of all samples. in vitro transcription (IVT) is then used for linear amplification, and the RNA is fragmented. RT is performed again, adding a second sequencing
adapter, and the PCR amplified library is sequenced.
A number of similar tag-based strategies were developed in which single cells are originally separated into wells. One such approach, MARS-seq, is very similar to CEL-seq in its use of IVT amplification, but utilizes three separate tags: a molecular tag (UMI), a cellular tag, and a plate tag, providing even greater potential for multiplexing (30) (Figure 1.1C). As mentioned earlier, MARS-seq was the first approach to utilize a UMI strategy, which has been widely adopted and was utilized in all subsequent single-cell sequencing strategies described here, with the exception of STRT-seq. CEL-seq2 is one such strategy, which made a number of improvements to the CEL-seq protocol, including the addition of a UMI (32) (Figure 1.1C). Another strategy is STRT-seq, which uses a template switching mechanism for cDNA synthesis, similar to SMART-seq, but uses a barcoded TSO that is biotinylated at the 5’ end (33, 34). Streptavidin beads are then used to capture pooled cDNA, which is fragmented, end-repaired, and A-tailed, all on the streptavidin beads. Sequencing adapters are ligated, and the cDNA is PCR amplified before being sequenced. Unlike other methods, sequenced transcripts are heavily 5’ biased due to the streptavidin bead strategy. A modified STRT-seq protocol, STRT-seq/C1, has more recently simplified andadapted STRT-seq to the C1 Single-Cell Auto Prep system (Fluidigm) (35) (Figure 1.1D). It uses a poly (T) primer and template switching strategy for cDNA synthesis, with both the barcoded TSO and poly (T) primer biotinylated at the 5’ end, and with the poly (T) primer containing a PvuI restriction enzyme site. Library generation occurs through Nextera transposon-based tagmentation (Illumina, Inc.), and streptavidin beads are used to isolate both the 5’ and
3’ fragments, with a PvuI restriction digest removing all 3’ sequences. Unlike the earlier iteration, STRT-seq/C1 does not pool samples until after library generation. Finally, Quartz-seq2 is an optimized version of Quartz-seq that added cellular barcoding during RT, as well as UMI capability (36) (Figure 1.1A).
Whereas tag-based single-cell RNA sequencing methods allowed for earlier pooling of samples, making them generally more affordable and allowing for greater multiplexing capabilities, the methods described thus far are fairly low-throughput, labor intensive, and still too costly to generate transcriptomes for large numbers of cells. In 2015, two new technologies, Drop-seq and inDrop, were developed that utilized novel droplet-based approaches to allow for high throughput and affordable RNA-sequencing of thousands of single cells (37, 38). Drop-seq uses a microfluidics device to encapsulate single cells and single barcoded microbeads together within oil droplets (37) (Figure 1.1E). Barcoded microbeads contain a poly (T) capture sequence, a PCR priming sequence, and both a bead-specific barcode sequence that is common to each spot on the bead and a UMI barcode that differs across each spot on the bead. Only a small fraction of oil droplets contain both a cell and a bead, requiring a large starting material. Cells are lysed within the oil droplet and mRNA is captured onto the beads. The
droplets are then broken, and the remaining downstream steps, from RT to sequencing, are largely identical to SMART-seq, but are performed in aggregate, greatly reducing per-cell reagent costs. InDrop also utilizes a microfluidics device to encapsulate single cells and barcoded primer sequences within oil droplets (38) (Figure 1.1C). However, inDrop utilizes deformable hydrogels that ensure almost all droplets contain barcoded primer sequences, thus greatly increasing cell capture efficiency and reducing the amount of starting material needed. Cell lysis, UV induced primer release from the hydrogels, mRNA capture, and RT all occur within the oil droplets. Similar to CEL-seq, the barcoded primers used by inDrop contain a T7 promoter. As such, after droplets are broken following RT, the remaining downstream steps are very similar to CEL-seq, from second strand DNA synthesis and IVT amplification to sequencing.
A few additional droplet-based methods have also been developed. 10X Genomics, Inc. has optimized and commercialized a droplet-based technology, called Chromium, that combines aspects of both inDrop and Drop-seq, including the use of deformable hydrogels and the use of cDNA fragmentation and sequencing adapter ligation, similar to inDrop, and the use of template switching/PCR amplification used in Drop-seq (39) (Figure 1.1E). 10X/Chromium has dramatically increased the accessibility of high-throughput single-cell RNA sequencing and has greatly improved sensitivity, precision, and noise, though with a slightly higher per-cell experimental cost prior to sequencing (40). DroNc-seq is another recently developed method that uses a modified Drop-seq approach that is compatible with cell nuclei, allowing for isolation of harder to dissociate cell types (41) (Figure 1.1E).
Although droplet-based methods have arguably been the most widely adopted single-cell RNA sequencing approaches, a number of similarly high throughput strategies have been developed that isolate cells by gravity into microwells containing barcoded beads (42, 43, 44). As a group, gravity-based methods are especially useful for low-input samples, requiring significantly less cells as starting material compared to droplet-based methods. The first such method, Cyto-seq, was released in 2015, around the same time as Drop-seq and inDrop (42). Cyto-seq utilizes a strategy by which cells are loaded by gravity into picoliter-sized wells of a Polydimethylsiloxane (PDMS) array generated from silicon wafers with an array of evenly spaced micropillars. To these wells are added barcoded beads, similar to those used in Drop-seq. A lysis buffer is then added, capturing mRNA from each cell onto the barcoded beads, and RT is performed. The beads are then pooled, and multiple rounds of PCR, initially using gene specific primers, are used to add sequencing adapters.
Additional gravity-based methods were developed over the next couple of years. One such method, Seq-well, is very similar to Cyto-seq, but adds a semipermeable
polycarbonate membrane to the array to prevent cross contamination and cell loss, improving data quality (43) (Figure 1.1E). It then uses a largely identical protocol to
Drop-seq after pooling the beads for RT, from template switching and PCR amplification to sequencing. Another method, Microwell-seq, is very similar to Seq-well, but utilizes a simpler and more inexpensive system for generating microwell arrays (44) (Figure 1.1E). Specifically, it uses reusable silicon wafers with regularly spaced microwells to make PDMS micropillar arrays. These are also reusable and are used to make the agarose microwell arrays into which cells are loaded. Magnetic barcoded beads are also used to better ensure bead collection.
Finally, in addition to droplet-based and gravity-based methods, a number of high-throughput and affordable single-cell RNA sequencing technologies have been developed that rely on distributing cells across 96- or 384-well plates, and then performing one or more rounds of pooling and redistribution, barcoding the cells with each round (45, 46). Through this process, each cell is combinatorially labeled with a unique combination of barcodes. As a group, combinatorial indexing-based methods are simple, largely do not require specialized equipment, and allow for significant
multiplexing, all of which lower the per-cell cost of these approaches and greatly increase their reach. The first such strategy to be released, sci-RNA-seq, relies on fluorescence activated cell sorting (FACS) sorting to distribute fixed and permeabilized cells, or isolated nuclei, into wells of a 96- or 384-well plate (45). Following FACS sorting, RT is performed on intact cells or nuclei, during which the first barcode and a UMI tag are introduced. Cells/nuclei are then pooled, and FACS is used to redistribute the cells/nuclei across the wells of a 96- or 384- well plate, this time at limiting numbers. Second strand synthesis, library generation, cell lysis, and PCR amplification of the libraries are all performed in these wells, with PCR primers that target the poly (T) primer on one end and the sequencing adaptor on the other introducing a second barcode specific to each well. Wells are then pooled and sequenced. A related method, SPLiT-seq, was released in 2018 and does not rely on FACS sorting of cells (46)
(Figure 1.1F). Rather distribution of formaldehyde-fixed cells across 96-well plates occurs by manual mixing and pipetting. RT is performed on whole cells, adding a well-specific barcode. Cells are then pooled and redistributed, where an in-cell ligation
reaction adds a second barcode. A third round of pooling and splitting is performed, and a third barcode and UMI tag are added by ligation. Finally, the cells are pooled, split, and lysed. Sequencing adapters, as well as a fourth barcode, are introduced by PCR and the wells are pooled and sequenced. Because SPLiT-seq does not require FACS sorting, there is less bias in cell isolation, and the four rounds of barcoding allows for distinction between biological samples.
As described in this section, a large number of single-cell RNA sequencing technologies have been developed over the past couple of decades, each of which have distinct strengths and weaknesses (Table 1.1). Although most newer approaches allow for quick, high throughput, and affordable RNA sequencing of thousands of single cells, more low throughput technologies, such as SMART-seq, still have their advantages. Compared to more recent approaches that are strongly 3’ or 5’ biased, SMART-seq, SUPeR-seq, and MATQ-seq all have the capability of generating nearly full-length RNA sequences, and are thus better suited for certain applications, such as the analysis of splice sites. SUPeR-seq and MATQ-seq have the added benefit of allowing sequencing of non-mRNA RNA species. Furthermore, because lower-throughput methods generate fewer transcriptomes to be sequenced, a finite number of sequencing reads are spread across less cells, resulting in higher per-cell coverage and better detection of lowly expressed transcripts. More recent high-throughput methods also generally require a greater number of cells as starting material, which is not only untenable for many tissues, but the generation of thousands of single-cell transcriptomes is largely
unnecessary for such samples. Newer, more high-throughput techniques do have many advantages, however. Biasing sequencing from the 3’ or 5’ end of the transcript
provides strand specificity. Furthermore, the ability to sequence thousands of cells, even at lower coverage, allows for enhanced identification and characterization of subpopulations in complex tissue samples, with the sheer number of cells isolated from each subpopulation making up for missing transcripts due to low coverage from any one single cell of that subpopulation. More recent techniques have also introduced the use of molecular tags, or UMIs, that reduce noise generated from PCR amplification
artifacts. Although technologies described here vary widely in how single cells are isolated, how a unique barcode is introduced to each of those single cells, and how cDNA is amplified following RT, among other differences, virtually all approaches are capable of producing high quality single-cell RNA sequencing data. As such, the choice between technologies must largely be based on the constraints of the specific
experimental question at hand.
Analysis of single-cell sequencing data
Each of the single-cell RNA sequencing methods profiled thus far generate large
sequencing files containing millions of randomly ordered reads from often thousands of single cells. As such, computational methods are required to deconvolute this data and extract meaningful biological information (47). Most single-cell RNA sequencing
methods have developed their own computational strategies for processing the raw sequencing data produced, taking into account various method-specific differences. These include Cell Ranger, which was developed to analyze Chromium 10X data (39), and a pipeline developed to process Drop-seq data (37), among many others. Despite the large number of approaches available for processing sequencing data generated by single-cell RNA sequencing, all approaches share certain computational considerations. Raw sequencing reads must be tagged with their various cell-specific barcodes, as well as the associated UMI tag, if any. The reads can then be aligned to the transcriptome or genome of choice, and those aligned reads, tagged with their cell-specific barcodes, can be used to generate a gene expression count matrix, with each unique barcode combination a distinct column and each gene or transcript a distinct row. Low-quality cells, including those with low transcript counts or low numbers of detected genes, those with very high transcript counts, indicating possible cell doublets, or those with a high percentage of mitochondrial genes, are removed from the data. The count matrix is then normalized to correct for relative gene expression differences between cells, as well as for differences in gene length for full-length RNA sequencing approaches. Regression models are also commonly used to remove technical and unwanted biological variation in the data, and a number of approaches have been developed to
correct for batch effects from different datasets, one popular example being canonical correlation analysis (CCA) (48). The resulting gene expression matrix is used as input for a variety of downstream applications used to uncover meaningful biological
information.
Because single-cell RNA sequencing experiments generate expression data for potentially tens of thousands of genes, the data has a high dimensionality. Multiple approaches exist to make analysis of this highly complex data more manageable, better enabling real biological variation to be uncovered. A common first approach is feature selection, in which only highly informative genes, such as those with high variance across cells, are used for downstream analysis of the data (49). Following feature selection, algorithms for dimensionality reduction are commonly applied and are useful both for identifying inherent dimensionality in the data and for data visualization.
Common algorithms for identifying inherent dimensionality include principal component analysis (PCA) (50), a common pre-processing step prior to clustering and visualization, and the generation of diffusion maps (51), which are commonly used for cell lineage reconstruction approaches reviewed in the following subsection. For visualization of the data, a number of algorithms are commonly used. The two most common are t-SNE (52) and UMAP (53), which are useful for plotting high dimensional data in low dimensional space, while largely retaining local relationships.
To determine the biological identity of each single cell in the data, cells can be clustered based on transcriptional similarities, and genes with enriched expression in each cluster can be identified. Some of the most widely used algorithms include k-means clustering, which iteratively defines a user-defined k number of centroids and assigns cells to the nearest centroid (54); hierarchical clustering, which either assigns each single cell as a cluster and iteratively groups clusters into ever more similar larger clusters
(agglomerative approach) or iteratively splits one single cluster into ever more dissimilar smaller clusters (divisive approach); and graph-based clustering, in which cells are embedded into a multi-dimensional graph structure, edges are drawn between
transcriptionally similar cells, and the graph is divided into communities based on the degree of cell interconnectivity. A number of user-friendly packages have been released to help with the clustering workflow, from dimensionality reduction to clustering to
differential expression analysis. Some popular packages include Seurat (55) and Cell Ranger (39). As a note, clustering of cells is not always the best approach for identifying biological variation. Actively differentiating cells of a single lineage commonly exhibit a continuum of gene expression. Therefore, rather than clustering, these cells are commonly placed on a one-dimensional manifold, an approach useful for cell lineage reconstruction, which is described below.
Trajectory reconstruction and lineage assessment using single-cell sequencing data
Changes in cell fate, be it during development, stem cell differentiation, or
reprogramming, require dynamic and complex transcriptional changes. By sampling cells from tissues undergoing active changes in cell fate, such as in developing embryos and in tissues that are undergoing constant differentiated cell turn over in a stem cell-dependent process, a range of cells at different stages in the maturation process can be captured. Leveraging the concept that cells of similar maturation stages will share more similar transcriptional profiles, multiple methodologies have been developed that use single-cell RNA sequencing data to order cells along transcriptional trajectories, allowing for the identification of genes that vary significantly in their expression across these trajectories and that may be important for their progression.
Most trajectory reconstruction approaches first utilize dimensionality reduction, followed by construction of a minimum spanning tree (MST), definition of the path that connects the least differentiated to the most differentiated cells, and projection of the cells onto this path (56, 57, 58, 59, 60, 61, 62) (Figure 1.2A). Monocle, one of the first such approaches, was released in 2014, and, following user input of the cells that constitute the root state, uses independent component analysis (ICA) as its method for
infer linear differentiation trajectories (Figure 1.2A). However, a later iteration,
Monocle2, allows for more complex trajectories, including bifurcations, by grouping cells in higher dimensional space (57). The most recent iteration of Monocle was used to infer very complex trajectories of over one million cells during mouse organogenesis (63). Additional approaches include waterfall (58), TSCAN (59), and SLICE (60), each of which generate MSTs on predefined cell clusters following dimensionality reduction, reducing influence from outlier cells (Figure 1.2A). SLICE has the additional capacity to identify the trajectory start point by measuring transcriptome entropy (60). Yet other dimensionality reduction-based approaches include Slingshot, which fits smooth curves to a MST and projects cells onto the closest smooth curve (61), and SCUBA, which directly fits a smooth curve without generation of a MST (62) (Figure 1.2A).
An additional class of trajectory reconstruction methods are based on k-nearest neighbor graphs (k-NNGs), with each cell connected to its transcriptionally similar k nearest neighbors (Figure 1.2B). The first such method, Wanderlust, assigns a set of shortest walks from a manually assigned root cell, and takes the average to generate the most probable differentiation trajectories (64). Whereas Wanderlust is only able to predict linear trajectories, a very similar technique, Wishbone, does allow for more complex trajectories with bifurcations (65) (Figure 1.2B). Approximate graph abstraction (AGA) and population balance analysis (PBA) are yet other NNG-based approaches (66, 67), with AGA averaging cells into clusters before trajectory reconstruction (66), and PBA predicting differentiation direction by estimating the velocity of cell
differentiation based on NNG local cell density (67). Additional methods utilizing NNG-based strategies have been used to generate complex developmental trajectories using single-cell RNA sequencing data from developing zebrafish (68, 69) and Xenopus
tropicalis embryos (70), as well as differentiation trajectories of the adult Hydra polyp
(71).
Other trajectory reconstruction approaches include StemID (72) and Mpath (73), which first cluster cells and connect cluster centers in high dimensional space, followed by
projection of single cells onto the edges of the connections and removal of poorly populated edges (Figure 1.2C). RNA velocity is an entirely different approach that uses unspliced mRNA as a measure of a cell’s future transcriptional profile, with the gene-by-gene fraction of unspliced transcripts used to infer trajectories without a manually defined root-state (74) (Figure 1.2D).
The trajectory reconstruction approaches described thus far require extensive sampling of intermediate states and cannot record lineage relationships (cell division histories) of single cells. To overcome these limitations, single-cell RNA sequencing or multiplex fluorescent in situ hybridization (FISH) can be combined with genetic lineage-tracing strategies. A number of such methods have been developed, many of which have taken a CRISPR/Cas9-based approach. These approaches utilize the fact that Cas9, in the absence of a repair template, will generate deletions or insertions in the targeted DNA. Over time, these mutations accumulate, generating heritable marks that can be
detected and used to infer lineage relationships between cells. One such method, MEMOIR, was released in 2017 and targets Cas9 to an array of genomic sequences with an associated barcode, generating progressive heritable marks that are then assayed using seq-FISH (75). Another such method, scGESTALT, targets inducibly expressed Cas9 to a barcode sequence contained within the 3’ UTR of a transgene, and uses inDrop to identify the progressive heritable marks (76). Because an inducible Cas9 system is used, lineage relationships in the juvenile zebrafish brain could be examined. Two additional Cas9-based methods include LINNAEUS and ScarTrace, which both target Cas9 to multiple copies of red fluorescent protein (RFP) or green fluorescent protein (GFP) integrated into the zebrafish genome (77, 78). LINNAEUS targets 16-32 RFP sequences spread throughout the genome (77), whereas ScarTrace targets eight in-tandem GFP sequences (78). Both methods then utilize inDrop to identify progressive heritable marks. Finally, rather than CRISPR/Cas9, TracerSeq is a method that uses a Tol2 transposase system to genomically integrate GFP transcripts, each of which contain a unique barcode in their 3’ UTR (69). Insertions occur
identified by inDrop. This approach was used to identify lineage relationships in the developing zebrafish embryo.
Certain features of the previously described approaches for combining lineage tracing with single-cell RNA sequencing, such as the need to inject constructs early in
development, limited their translation to a mammalian system. As such, multiple additional approaches have been released and used to profile lineage relationships in early mouse embryo development and in hematopoiesis, using 10X genomics (79, 80) or InDrop (81) to read out the progressive heritable changes. Two approaches utilized a CRISPR/Cas9-based approach (79, 80). One such approach uses an array of sixty genomically-integrated homing CRISPR guide RNAs (hgRNAs) that target their own genomic loci (79), and the other approach uses three genomically integrated guide RNAs that target a DNA sequence contained within the 3’ UTR of a fluorescent transgene, multiple copies of which are spread throughout the genome (80), both of which were used to profile early mouse development. A third approach, termed lineage and RNA recovery (LARRY), uses a lentiviral library containing GFP constructs uniquely barcoded in their 3’ UTR and under control of an EF1alpha promoter to singly infect cells and was used to profile hematopoiesis in hematopoietic stem and progenitor cells (HSPCs) cultured in vitro and transplanted in vivo (81). Finally, whereas previously described methods actively generate and detect heritable marks within cells, additional methods have been developed that retroactively detect endogenous tags arising from naturally occurring mutations. Single-cell RNA sequencing and single-cell ATAC-seq (Assay for Transposase-Accessible Chromatin with high-throughput sequencing), which is described in a later section, are capable of detecting endogenous mutations in
mitochondrial DNA, in which somatic mutations occur at a much higher rate than genomic DNA, and can be used for lineage tracing of human cells (82, 83).
Spatial transcriptomics
All single-cell RNA sequencing approaches described thus far require dissociation of the tissue sample into a single-cell suspension prior to cell isolation. As a result, all
spatial information regarding the arrangement of cell types within the overall tissue is lost. Given the immense interconnectivity with which cell types function within an
organism, this spatial information is of great importance. A number of approaches have been developed that attempt to infer this spatial information from data generated using these previously established dissociative methods. In addition, a number of novel methods have been developed that retain spatial information for each cell throughout the sequencing process. Finally, methods for highly multiplexed FISH, including in situ sequencing, have been developed that allow for the direct imaging and identification of thousands of transcripts within intact tissue sections.
Approaches that infer spatial information from single-cell RNA sequencing data generated using previously described dissociative methods do so by determining the spatial tissue-level expression pattern for a number of genes by in situ hybridization (ISH), some of which overlap spatially and some of which do not (Figure 1.3A). These expression patterns are digitized, and the unique gene expression profiles for cells in the data are used to infer the rough spatial orientation of that cell in the original tissue (Figure 1.3A). Four conceptually similar methods have been released that have demonstrated the success of this approach. The first of these methods, released in 2015, were Seurat (55) and an approach by the Marioni lab (84). Seurat was used to analyze 851 single cells isolated and sequenced by SMART-seq from the developing
Xenopus embryo (55). 47 ISH patterns were used to generate a reference spatial map,
which was used to assign each cell to one of 128 bins distributed along the dorsal-ventral and animal-vegetal axis. Seurat was largely able to assign cells isolated from distinct regions of the embryo to the correct bin and to fairly accurately predict ISH patterns for genes and rare cell types not provided to the algorithm. A similar approach by the Marioni lab used up to 98 ISH images to infer the spatial positions of around 139 single cells isolated and sequenced using Fluidigm C1 from the marine annelid
Platynereis dumerilii. (84). A third approach, Distmap, was released in 2017 and used
ISH images for 84 genes to infer spatial positions of around 1,300 single cells isolated and sequenced using Drop-seq from stage 6 Drosophila melanogaster embryos (85).
Finally, novoSparc, released in 2019, is unique in not requiring existing in situ patterns for spatial reconstruction, though in situ images can be incorporated (86). Using a range of 0-84 ISH images, novoSparc was able to infer spatial patterns for cells isolated from effectively 2D tissues, such as the mouse intestinal epithelium and liver lobules, as well as cells isolated from more complex tissues, such as the stage 6 Drosophila
melanogaster and the developing Xenopus embryo. Although reconstruction quality was
slightly improved over previous methods, and less ISH reference images were required for high-quality reconstruction, reconstructions performed using no marker genes were fairly poor.
Rather than inferring positional information from single-cell data generated using
dissociative techniques, three new approaches have been developed that seek to retain this positional information throughout the sequencing process. The first such method, developed in 2016, utilizes an array of glass slide-anchored oligonucleotides containing spot-specific barcodes, UMI tags, and oligo (dT) sequences (87). A tissue slice is
placed onto the array, where it is permeabilized, RT is performed, and cDNA is captured onto the closest oligonucleotide spot. Following RT, the tissue is fully digested, and an IVT-based method is used for amplification. Because the location of each barcode sequence on the glass slide is known, the spatial location of each read can be determined through its associated barcode. Two additional methods, developed in 2019, are conceptually very similar but utilize glass-immobilized arrays of barcoded beads, similar to those used in Drop-seq, with the spot-specific barcode sequences determined by in situ indexing (88, 89). One such method, Slide-seq, pools beads following RT and tissue digestion, and further downstream steps, including template switching and PCR amplification, are performed almost identically to the Drop-seq approach (88) (Figure 1.3B). The other such method, HDST, also pools beads following RT and tissue digestion, but downstream steps are very similar to those used in the glass slide-anchored oligonucleotide-based method described above (87), including IVT amplification (89). Although HDST reports a spatial resolution of 2 µm for mRNA
close proximity, and thus do not provide traditional single-cell resolution. Despite this limitation, these methods have successfully characterized roughly transcriptome-wide gene expression profiles for tissue sections of the adult mouse olfactory bulb (87, 89), the mouse hippocampus and cerebellum (88), and a breast cancer tumor (89).
Finally, a number of a multiplex FISH techniques have been developed that enable detection of individual transcripts for thousands of genes directly in intact tissue slices. One of the first such methods, sequential FISH (seqFISH), was developed in 2014 and allows for multiple rounds of probe hybridization with up to four fluorophores, followed by probe stripping (90). A barcoding scheme was utilized wherein individual genes were uniquely marked by a combination of the hybridization rounds in which probes to that gene were added and the fluorophores used to label the probe in each round,
theoretically allowing for coverage of the entire transcriptome (Figure 1.3C). While initially only compatible with cultured cells, successive optimized versions of this approach enabled profiling of tissue sections and were used to profile up to 249 genes in 16,958 cells of the mouse hippocampus (91) and 10,000 genes in 2,963 cells from brain slices of the mouse subventricular zone and olfactory bulb (92). merFISH is a related approach, developed in 2015, that also uses multiple rounds of hybridization to barcode cells, but includes an error-correcting barcode system to lower noise in the system (93). While also initially only compatible with cultured cells, merFISH has also undergone successive rounds of optimization that have enabled profiling of 155 genes in one million cells of the hypothalamic preoptic region (94). Finally, osmFISH was developed in 2018 and does not rely on barcoding, but rather directly detects a small number of genes in each hybridization round, with multiple rounds of hybridization and stripping (95).
A number of FISH-based methods have also been developed to directly sequence RNA species in intact cells, all of which utilize rolling-circle amplification (RCA) to amplify signal (96, 97, 98). Only one such method, STARmap, is compatible with tissue
probe sets, one of which contains a 5-bp barcode, to generate a template for RCA (98). During RCA, amine-modified nucleotides are added that enable imbedding into a tissue hydrogel, increasing optical transparency and reducing background, among other benefits. The barcode is then sequenced using fluorescent readout probe hybridization and stripping, using an error-reducing two-base sequencing scheme. STARmap was used to profile 160-1,020 genes in sections of mouse primary visual cortex and medial prefrontal cortex.
Additional single-cell genomic technologies
The single-cell sequencing techniques highlighted thus far have largely been single-cell RNA sequencing approaches. However, a number of single-cell approaches have been developed over the past decade that have enabled profiling of genomic features ranging from DNA methylation to chromatin state, as well as methods allowing for the detection of combinations of these features. Methods have been developed for single-cell
detection of genomic copy-number variations (99) and full genome sequencing in single-cells (100, 101, 102). Multiple single-cell methods for analyzing the chromatin state of a cell have also been developed. These include methods for single-cell ATAC-seq to identify regions of open chromatin (103), single-cell whole genome bisulfite sequencing to measure DNA methylation (104, 105, 106, 107, 108), single-cell Hi-C to measure chromosome conformation (109, 110, 111, 112, 113), and single-cell Chip-seq to measure histone modifications (114, 115). Furthermore, single-cell methods have been developed that enable profiling of multiple genomic features in the same cell. These include approaches enabling both transcriptional profiling and profiling of either chromatin accessibility (116), DNA methylation (117), or protein epitopes (118, 119), as well as an approach enabling profiling of both chromatin accessibility and DNA
methylation (120).
Applications and outlook for single-cell sequencing technologies
The explosion of single-cell genomic approaches over the past decade has transformed many aspects of biological research. The ability to quickly and affordably generate
transcriptomes for thousands of single cells has enabled cellular profiling of entire organisms and organ systems, both in the adult and during development, and has allowed evolutionary comparisons between a wide range of organisms. Furthermore, the ability to profile cellularly heterogeneous diseases, such as cancer, provides an invaluable tool in the study and treatment of such diseases, and the ease and
affordability of current methods enables their use as readouts for genetic and chemical screens, with great promise for accelerated discovery in both basic science and
translational research.
Animal species can contain many hundreds of distinct cell types and cell states, the composition of which varies widely over the course of development. Despite this great complexity, high throughput single-cell RNA sequencing approaches have enabled the generation of transcriptomes for most cell types in a number of animals and tissues - so called cell-type transcriptome “atlases”. These atlases have been especially
transformative for emerging model organisms with limited molecular tools available. A whole-animal cell type transcriptome atlas has been generated for the asexual planarian
Schmidtea mediterranea, as will be described in chapter 2. In addition, transcriptomes
for most cell types of the adult cnidarian Hydra polyp (71), the ctenophore Mnemiopsis
leidyi (121), the placozoan Trichoplax adhaerens (121), the marine annelid Platynereis dumerilii (122), and both adult and larval stages of the cnidarian Nematostella vectensis
(123) and the sponge Amphimedon queenslandica (121) have been generated. Transcriptomes have also been generated from most cells of embryonic and larval Caenorhabditis elegans (31, 45, 124, 125) and from most cells across the life cycle stages of the ascidian Ciona intestinalis (126), as well as for a comprehensive collection of different organ systems from the mouse (44, 127). An effort to generate a human cell atlas to transcriptionally profile all human cell types and cell states is currently underway (128). Transcriptome atlases have also been generated for a number of organs and tissues. As an example, transcriptional profiling of cells from the lung airway epithelium revealed that the gene CFTR, mutations in which cause cystic fibrosis, was exclusively expressed in a previously unidentified cell type called the ionocyte (129, 130).
Animal development is a highly complex process, with the diverse array of differentiated tissue types of an adult animal all arising from a single fertilized egg. Given this
daunting complexity, much remains unknown of this fundamental process. With single-cell RNA sequencing techniques enabling transcriptome generation for tens of
thousands of single cells, however, the ability to transcriptionally profile this complex process has become a reality. As has been previously mentioned, single-cell RNA sequencing technologies have been applied to a wide range of animals at various
stages of development, including zebrafish (68, 69), Xenopus tropicalis (70), mouse (63, 131), C. elegans (31, 45, 124, 125), and the ascidian Ciona intestinalis (126). Using a variety of trajectory reconstruction techniques, as reviewed above, complex
developmental trajectories were generated for each organism, both confirming existing knowledge of certain developmental trajectories and refining understanding of others (63, 68, 69, 70, 125, 126, 131). Although all trajectory reconstruction techniques were performed on dissociated cells, precluding the direct analysis of lineage relationships, one zebrafish study used TracerSeq to combine genetic lineage tracing with single-cell RNA sequencing, confirming that most clonally related cells were in close proximity in the trajectory plot, but also identifying credible instances of divergent clones (69). This same zebrafish study also profiled developmental trajectories for embryos with
CRISPR/Cas9 induced loss of function chordin mutations, revealing an expected expansion of ventral tissues and loss of dorsal tissues compared to control animals, among other findings (69). Together, these results demonstrate the potential for
combining genetic modifications and lineage tracing with single-cell RNA sequencing to decipher the developmental logic across diverse animal embryos.
In addition to profiling development of animal embryos, other studies have used single-cell genomic approaches to profile lineage trajectories and identify stem single-cell populations in adult tissues. As one example, human hematopoietic cell types were recently profiled using both single-cell ATAC-seq and single-cell RNA seq, identifying chromatin-level lineage bias for various multipotent progenitors and identifying transcription factor
expression associated with these observed chromatin-level changes (132). As another example, single-cell RNA sequencing of mouse intestine was recently used to identify an injury-induced cell type, termed the “revival” stem cell, that is normally rare and quiescent in homeostasis, but is able to give rise to all major intestinal cell types following injury (133).
Systematic whole genome sequencing across the animal kingdom has revolutionized our understanding of organismal evolution. With the capacity to profile cell types at the transcriptome and chromatin level, cell type comparisons between animal species has the potential to transform our understanding of the evolution of cell types and gene regulatory networks. In fact, a number of studies have demonstrated the utility of such an approach. To give just two recent examples, comparison of transcriptional profiles from glutamatergic and GABAergic neurons isolated from reptilian and mouse brains revealed that whereas most mammalian GABAergic classes also exist in reptiles, mammals possess many more glutamatergic neuron types (134). As another example, comparison of cell-type-specific transcription factor expression and associated promoter sequences for sponges, ctenophores, and placozoans revealed that transcription factor motifs are highly predictive of cell type in less cellularly complex placozoans and
sponges, but less so in more cellularly complex ctenophores, among other findings (121).
In addition to their growing importance in basic biological research, single-cell genomic technologies can also be used to profile disease states, not only enhancing our
molecular understanding of diseases, but also identifying potential therapeutic targets. Tumors are highly heterogeneous in their cell type composition, and have thus been poorly characterized using bulk genomics techniques. Single-cell whole genome sequencing has been instrumental in measuring clonal evolution during tumor development (99, 101), and single-cell RNA sequencing has been used to profile a number of tumors types, as well as their microenvironment. As just one example,
sequencing of patient-derived organoids (135, 136). Our understanding of other human diseases can also benefit from these technologies. These include schizophrenia and other neurological disorders, for which the genetic bases are poorly understood. As one example, a recent study mapped genetic variants and gene sets associated with
schizophrenia to transcriptional profiles generated by single-cell RNA (137). In doing so, it was recognized that gene variants were only associated with four major neuronal cell types, each of which can now be targeted for further characterization.
Finally, single-cell genomic approaches are especially effective for profiling highly heterogeneous samples and are thus ideal tools for reading out transcriptional and chromatin-level changes arising from chemical and genetic screens. Indeed, a number of such approaches have been developed. An approach for combining single-cell transcriptomics with chemical screening was recently established (138). Similarly, multiple methods have been released that combine CRISPR/Cas9-based screening with single-cell RNA sequencing. These include Mosaic-seq (139), Perturb-seq (140, 141), Crisp-seq (142), and CROP-seq (143), as well as a method that combines
CRISPR/Cas9 based screening with single-cell ATAC-seq (144). These methods have been used to probe the genetic circuitry underlying epithelial-to-mesenchymal
transitions (145), and have identified iPSC-derived neuron-essential genes (146), as well as genes involved in immune activation (141), as just a few examples.
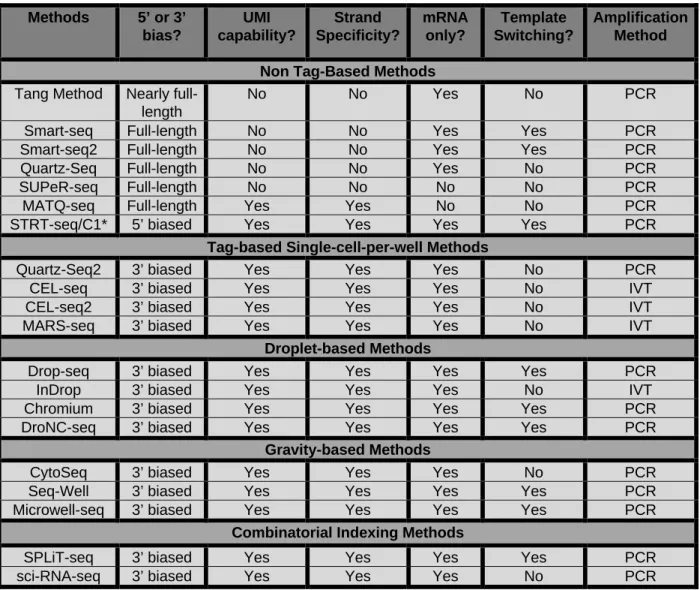
Table 1.1 Methods 5’ or 3’ bias? UMI capability? Strand Specificity? mRNA only? Template Switching? Amplification Method Non Tag-Based Methods
Tang Method Nearly full-length
No No Yes No PCR
Smart-seq Full-length No No Yes Yes PCR
Smart-seq2 Full-length No No Yes Yes PCR
Quartz-Seq Full-length No No Yes No PCR
SUPeR-seq Full-length No No No No PCR
MATQ-seq Full-length Yes Yes No No PCR
STRT-seq/C1* 5’ biased Yes Yes Yes Yes PCR
Tag-based Single-cell-per-well Methods
Quartz-Seq2 3’ biased Yes Yes Yes No PCR
CEL-seq 3’ biased Yes Yes Yes No IVT
CEL-seq2 3’ biased Yes Yes Yes No IVT
MARS-seq 3’ biased Yes Yes Yes No IVT
Droplet-based Methods
Drop-seq 3’ biased Yes Yes Yes Yes PCR
InDrop 3’ biased Yes Yes Yes No IVT
Chromium 3’ biased Yes Yes Yes Yes PCR
DroNC-seq 3’ biased Yes Yes Yes Yes PCR
Gravity-based Methods
CytoSeq 3’ biased Yes Yes Yes No PCR
Seq-Well 3’ biased Yes Yes Yes Yes PCR
Microwell-seq 3’ biased Yes Yes Yes Yes PCR
Combinatorial Indexing Methods
SPLiT-seq 3’ biased Yes Yes Yes Yes PCR
Table 1.1. Summary of the capabilities of available single-cell sequencing methods.
Table adapted from (147). For each method, the presence of a 5’ or 3’ gene bias for sequencing reads, the capability for a UMI counting strategy, the presence of strand specificity, the capability to sequence additional types of RNA other than mRNA, the use of a template switching approach, and the amplification approach utilized are indicated. PCR, Polymerase Chain Reaction; IVT, in vitro transcription. * The earliest iteration of STRT-seq was tag-based and allowed for earlier pooling of samples. For STRT-seq/C1, samples are not pooled until following library generation, and it was thus classified as a non-tag-based method.
Figure 1.1. Common paradigms for library preparation used in single-cell RNA sequencing.
Illustrations adapted from (148). As a note, starred methods vary slightly in the library preparation approach. (A) General library preparation method adopted by the Tang method, Quartz-seq (and Quartz-seq 2), SUPeR-seq, and MATQ-seq. SUPeR-seq utilizes random primers, not poly (T)-based primers, for reverse transcription. MATQ-seq utilizes random primers in addition to poly (T)-based primers for reverse
transcription, and utilizes poly (C) tailing, rather than poly (A) tailing, and a poly (G) primer for 2nd strand DNA synthesis. Both MATQ-seq and Quartz-seq2 utilize a UMI strategy. Quartz-seq2 adds a cell barcoding step during RT, allowing much earlier pooling of samples. (B) Library preparation method adopted by SMART-seq and SMART-seq2. (C) General library preparation method adopted by seq (and CEL-seq2), MARS-seq, and InDrop. CEL-seq2, MARS-seq, and InDrop all utilize a UMI strategy. (D) Library preparation method adopted by STRT-seq/CI. (E) General library preparation method adopted by Drop-seq, DroNC-seq, Seq-well, 10X/Chromium, and Microwell-seq. 10X/Chromium uses cDNA fragmentation and ligation of sequencing adapters to generate libraries from amplified cDNA, and microwell-seq utilizes an expanded cell barcode scheme compared to the other methods. (F) Illustration adapted from (46). General experimental workflow for generating cell-specific barcode
combinations using SPLiT-seq. As a general note, all non-tag-based methods (i.e. A, B, and D), Illumina sequencing adaptors (in two shades of grey) can possess barcoded indices, allowing for sample pooling prior to sequencing
Figure 1.2. Common approaches for trajectory reconstruction of single-cell data.
Illustrations adapted from (149). (A) Schematic of common dimensionality reduction-based approaches for trajectory reconstruction. Although the original Monocle is profiled, which did not allow for bifurcations, more recent versions do allow for
bifurcations. SLICE takes a similar approach to TSCAN and Waterfall, with the added capability to infer directionality from transcriptome entropy. (B) Schematic of a typical k-NNG-based approach. Wanderlust is another such method that does not allow for bifurcations. (C) Schematic of a typical high-dimensional space clustering-based approach. StemID takes a very similar approach to Mpath, with the added capability of predicting stem cell populations. (D) Schematic of the RNA Velocity approach.
Figure 1.3. Common spatial transcriptomic approaches.
(A) Illustration adapted from (86). Schematic of the general approach used to infer spatial information from single-cell RNA sequencing data using existing ISH images. (B) Illustration adapted from (88). Schematic of the approach used by Slide-seq to retain positional information throughout the sequencing process. (C) Illustration adapted from (93). Schematic of the general approach used by seqFISH-based approaches, including merFISH, which also utilizes an error correcting barcode system. While only one
fluorophore was used in the schematic, multiple fluorophores are compatible with these approaches.
II.
Planarians as a regenerative model system
An introduction to planarians as a model systemPlanarians are freshwater flatworms well known for their capacity for whole-body
regeneration (150, 151) (Figure 1.4A). They are members of the Spiralian superphylum (152) and as bilaterians, possess three body axes: anterior-posterior (AP), dorsal-ventral (DV), and medial-lateral (ML) (Figure 1.4B). Planarians possess a complex anatomy, consisting of multiple organ systems, many of which are found across the animal kingdom. These include an excretory system, made up of protonephridia; both a central and peripheral nervous system; a digestive system, including an intestine and a pharynx used for feeding and defecation; a muscular system consisting of networks of muscle fibers that run in different orientations; and an epidermis (Figure 1.4C). There is also a diverse collection of mesenchymal cell types that are found in the space between the organ systems of the animal, called the parenchyma. A more detailed account of planarian anatomy will be provided in a later subsection. A number of molecular tools are available for the study of planarians, including RNA interference (RNAi) for inhibiting gene expression (153, 154) and in situ hybridization for visualizing gene expression (155). Genomic resources are also available, including a number of transcriptome assemblies (156), and a recently completed draft of the planarian genome (157).
Whereas a European species, Schmidtea mediterranea, has been used for most recent molecular studies of planarians and will be the focus of this thesis, there are many species of planarians all over the world (158). Furthermore, there are two separate strains of Schmidtea mediterranea: a sexual cross-fertilizing hermaphroditic strain, and an asexual strain that reproduces by fissioning and subsequent regeneration. The asexual strain will be the primary focus of this thesis.
Following tissue loss, planarians generate an unpigmented outgrowth of new tissue, called the blastema, that forms at the site of injury (Figure 1.4D). Because many injuries lead to the loss of the brain or pharynx, both of which preclude eating, regeneration must occur with existing nutrients only. Only some structures are regenerated in the