Comprehensive molecular characterization
of gastric adenocarcinoma
The MIT Faculty has made this article openly available.
Please share
how this access benefits you. Your story matters.
Citation
Bass, Adam J. et al. “Comprehensive Molecular Characterization of
Gastric Adenocarcinoma.” Nature 513, 7517 (July 2014): 202–209 ©
2014 Macmillan Publishers Limited
As Published
http://dx.doi.org/10.1038/NATURE13480
Publisher
Nature Publishing Group
Version
Final published version
Citable link
http://hdl.handle.net/1721.1/116734
Terms of Use
Creative Commons Attribution-Noncommercial-Share Alike
ARTICLE
OPEN
doi:10.1038/nature13480Comprehensive molecular characterization
of gastric adenocarcinoma
The Cancer Genome Atlas Research Network*
Gastric cancer is a leading cause of cancer deaths, but analysis of its molecular and clinical characteristics has been
complicated by histological and aetiological heterogeneity. Here we describe a comprehensive molecular evaluation of
295 primary gastric adenocarcinomas as part of The Cancer Genome Atlas (TCGA) project. We propose a molecular
classification dividing gastric cancer into four subtypes: tumours positive for Epstein–Barr virus, which display
recur-rent PIK3CA mutations, extreme DNA hypermethylation, and amplification of JAK2, CD274 (also known as PD-L1) and
PDCD1LG2 (also known as PD-L2); microsatellite unstable tumours, which show elevated mutation rates, including
muta-tions of genes encoding targetable oncogenic signalling proteins; genomically stable tumours, which are enriched for the
diffuse histological variant and mutations of RHOA or fusions involving RHO-family GTPase-activating proteins; and
tumours with chromosomal instability, which show marked aneuploidy and focal amplification of receptor tyrosine
kinases. Identification of these subtypes provides a roadmap for patient stratification and trials of targeted therapies.
Gastric cancer was the world’s third leading cause of cancer mortality
in 2012, responsible for 723,000 deaths
1. The vast majority of gastric
cancers are adenocarcinomas, which can be further subdivided into
intestinal and diffuse types according to the Lauren classification
2. An
alternative system, proposed by the World Health Organization, divides
gastric cancer into papillary, tubular, mucinous (colloid) and poorly
co-hesive carcinomas
3. These classification systems have little clinical
util-ity, making the development of robust classifiers that can guide patient
therapy an urgent priority.
The majority of gastric cancers are associated with infectious agents,
including the bacterium Helicobacter pylori
4and Epstein–Barr virus
(EBV). The distribution of histological subtypes of gastric cancer and
the frequencies of H. pylori and EBV associated gastric cancer vary across
the globe
5. A small minority of gastric cancer cases are associated with
germline mutation in E-cadherin (CDH1)
6or mismatch repair genes
7(Lynch syndrome), whereas sporadic mismatch repair-deficient
gast-ric cancers have epigenetic silencing of MLH1 in the context of a CpG
island methylator phenotype (CIMP)
8. Molecular profiling of gastric
cancer has been performed using gene expression or DNA sequencing
9–12,
but has not led to a clear biologic classification scheme. The goals of this
study by The Cancer Genome Atlas (TCGA) were to develop a robust
molecular classification of gastric cancer and to identify dysregulated
pathways and candidate drivers of distinct classes of gastric cancer.
Sample set and molecular classification
We obtained gastric adenocarcinoma primary tumour tissue (fresh
fro-zen) from 295 patients not treated with prior chemotherapy or
radio-therapy (Supplementary Methods S1). All patients provided informed
consent, and local Institutional Review Boards approved tissue collection.
We used germline DNA from blood or non-malignant gastric mucosa
as a reference for detecting somatic alterations. Non-malignant gastric
samples were also collected for DNA methylation (n 5 27) and
expres-sion (n 5 29) analyses. We characterized samples using six molecular
platforms (Supplementary Methods S2–S7): array-based somatic copy
number analysis, whole-exome sequencing, array-based DNA
methy-lation profiling, messenger RNA sequencing, microRNA (miRNA)
se-quencing and reverse-phase protein array (RPPA), with 77% of the
tumours tested by all six platforms. Microsatellite instability (MSI)
test-ing was performed on all tumour DNA, and low-pass (,63 coverage)
whole genome sequencing on 107 tumour/germline pairs.
To define molecular subgroups of gastric cancer we first performed
unsupervised clustering on data from each molecular platform
(Sup-plementary Methods S2–S7) and integrated these results, yielding four
groups (Supplementary Methods S10.2). The first group of tumours
was significantly enriched for high EBV burden (P 5 1.5 3 10
218) and
showed extensive DNA promoter hypermethylation. A second group
was enriched for MSI (P 5 2.1 3 10
232) and showed elevated mutation
rates and hypermethylation (including hypermethylation at the MLH1
promoter). The remaining two groups were distinguished by the
pres-ence or abspres-ence of extensive somatic copy-number aberrations (SCNAs).
As an alternative means to define distinct gastric cancer subgroups, we
performed integrative clustering of multiple data types using iCluster
13(Supplementary Methods S10.3). This analysis again indicated that EBV,
MSI and the level of SCNAs characterize distinct subgroups
(Supplemen-tary Fig. 10.3). Based upon these results from analysis of all molecular
platforms, we created a decision tree to categorize the 295 gastric
can-cer samples into four subtypes (Fig. 1a, b) using an approach that could
more readily be applied to gastric cancer tumours in clinical care.
Tu-mours were first categorized by EBV-positivity (9%), then by MSI-high
status, hereafter called MSI (22%), and the remaining tumours were
distinguished by degree of aneuploidy into those termed genomically
stable (20%) or those exhibiting chromosomal instability (CIN; 50%).
Evaluation of the clinical and histological characteristics of these
molecular subtypes revealed enrichment of the diffuse histological
sub-type in the genomically stable group (40/55 5 73%, P 5 7.5 3 10
217)
(Fig. 1c), an association not attributable to reduced SCNA detection in
low purity tumours (Supplementary Fig. 2.8). Each subtype was found
throughout the stomach, but CIN tumours showed elevated frequency
in the gastroesophageal junction/cardia (65%, P 5 0.012), whereas most
EBV-positive tumours were present in the gastric fundus or body (62%,
P 5 0.03). Genomically stable tumours were diagnosed at an earlier age
(median age 59 years, P 5 4 3 10
27), whereas MSI tumours were
di-agnosed at relatively older ages (median 72 years, P 5 5 3 10
25). MSI
patients tended to be female (56%, P 5 0.001), but most EBV-positive
*A list of authors and affiliations appears at the end of the paper.cases were male (81%, P 5 0.037), as previously reported
14. We did not
observe any systematic differences in distribution of subtypes between
patients of East Asian and Western origin (Supplementary Methods
S1.8). Initial outcome data from this cohort did not reveal survival
dif-ferences between the four subgroups (Supplementary Information S1.7).
EBV-associated DNA hypermethylation
EBV is found within malignant epithelial cells in 9% of gastric cancers
14.
EBV status was determined using mRNA, miRNA, exome and
whole-genome sequencing, yielding highly concordant results
(Supplemen-tary Fig. 9.7). By contrast, we detected only sporadic evidence of H.
pylori, which may reflect the decline of bacterial counts accompanying
the progression from chronic gastritis to subsequent carcinoma, as well
as technical loss of luminal bacteria during specimen processing.
Unsu-pervised clustering of CpG methylation performed on unpaired tumour
samples revealed that all EBV-positive tumours clustered together and
exhibited extreme CIMP, distinct from that in the MSI subtype
8,
consis-tent with prior reports
15(Fig. 2a). Differences between the EBV-CIMP and
MSI-associated gastric-CIMP methylation profiles of tumours mirrored
differences between these groups in their spectra of mutations (Fig. 1a)
and gene expression (Supplementary Fig. 10.6a). EBV-positive tumours
had a higher prevalence of DNA hypermethylation than any cancers
reported by TCGA (Supplementary Fig. 4.6). All EBV-positive tumours
assayed displayed CDKN2A (p16
INK4A) promoter hypermethylation,
but lacked the MLH1 hypermethylation characteristic of MSI-associated
CIMP
16. Genes with promoter hypermethylation most differentially
silenced in EBV-positive gastric cancer are shown in Supplementary
Table 4.3.
We observed strong predilection for PIK3CA mutation in
EBV-positive gastric cancer as suggested by prior reports
17,18, with non-silent
PIK3CA mutations found in 80% of this subgroup (P 5 9 3 10
212),
including 68% of cases with mutations at sites recurrent in this data set
or in the COSMIC repository. In contrast, 3 to 42% of tumours in the
other subtypes displayed PIK3CA mutations. PI(3)-kinase inhibition
therefore warrants evaluation in EBV-positive gastric cancer. PIK3CA
mutations were more dispersed in EBV-positive cancers, but localized
in the kinase domain (exon 20) in EBV-negative cancers (Fig. 2b). The
most highly transcribed EBV viral mRNAs and miRNAs fell within the
BamH1A region of the viral genome (Supplementary Fig. 9.8) and showed
similar expression patterns across tumours, as reported separately
19.
Somatic genomic alterations
To identify recurrently mutated genes, we analysed the 215 tumours
with mutation rates below 11.4 mutations per megabase (Mb) (none
of which were MSI-positive) separately from the 74 ‘hypermutated’
tumours. Within the hypermutated tumours, we excluded from analysis
11 cases with a distinctly higher mutational burden above 67.7 mutations
per Mb (including one tumour with an inactivating POLE mutation
20,21)
(Supplementary Information S3.2–3.3), because their large numbers of
mutations unduly influence analysis. We used the MutSigCV
22tool to
define recurrent mutations in the 63 remaining hypermutated tumours
by first evaluating only base substitution mutations, identifying 10
sig-nificantly mutated genes, including TP53, KRAS, ARID1A, PIK3CA,
ERBB3, PTEN and HLA-B (Supplementary Table 3.5). We found ERBB3
mutations in 16 of 63 tumours, with 13 of these tumours having
muta-tions at recurrent sites or sites reported in COSMIC. MutSigCV analysis
including insertions/deletions expanded the list of statistically
signifi-cant mutated genes to 37, including RNF43, B2M and NF1
(Supplemen-tary Fig. 3.9). Similarly, HotNet analysis of genes mutated within MSI
tumours revealed common alterations in major histocompatibility
Age at initial diagnosis
80 70 60 40 90 50 Males (%) 75 50 25 100 0 Number of samples 60 30 0 90 120 GE-junction cardia Fundus body Antrum pylorus dif fuse (%) 75 50 25 100 0
EBV MSI GS CIN
CIN (chrom instability) EBV (EBV-CIMP) EBV positive MSI (hypermutated) GS (genomically stable) MSI hig h SCNA high cl uster 295 269 205 26 64 58 147
b
c
227 tumours Subtype Tumour purity TP53 mut. SCNA high Diffuse MLH1 silencing MSI high CDKN2A silencing PIK3CA mut. EBV positive 100 50 10 5 1 Mutations per Mb Chr 1 Chr 22 Copy number DNA methylation mRNA micr oRNA Pr oteinEBV MSI GS CIN Tumour purity
Low High Not available Molecular/clinical features Yes No Not available Gain Loss High Low High Low High Low High Low
a
Lauren classificationEBV MSI GS CIN EBV MSI GS CIN
Figure 1
|
Molecular subtypes of gastric cancer. a, Gastric cancer cases are
divided into subtypes: Epstein–Barr virus (EBV)-positive (red), microsatellite
instability (MSI, blue), genomically stable (GS, green) and chromosomal
instability (CIN, light purple) and ordered by mutation rate. Clinical (top) and
molecular data (top and bottom) from 227 tumours profiled with all six
platforms are depicted. b, A flowchart outlines how tumours were classified
into molecular subtypes. c, Differences in clinical and histological
characteristics among subtypes with subtypes coloured as in a, b. The plot
of patient age at initial diagnosis shows the median, 25th and 75th percentile
values (horizontal bar, bottom and top bounds of the box), and the highest and
lowest values within 1.5 times the interquartile range (top and bottom whiskers,
respectively). GE, gastroesophageal.
complex class I genes, including B2M and HLA-B (Supplementary Fig.
11.5–11.7). B2M mutations in colorectal cancers and melanoma result
in loss of expression of HLA class 1 complexes
23, suggesting these events
benefit hypermutated tumours by reducing antigen presentation to the
immune system.
Through MutSigCV analysis of the 215 non-hypermutated tumours,
we identified 25 significantly mutated genes (Fig. 3). This gene list again
included TP53, ARID1A, KRAS, PIK3CA and RNF43, but also genes
in the b-catenin pathway (APC and CTNNB1), the TGF-b pathway
(SMAD4 and SMAD2), and RASA1, a negative regulator of RAS. ERBB2,
a therapeutic target, was significantly mutated, with 10 of 15 mutations
occurring at known hotspots; four cases had the S310F ERBB2
muta-tion that is activating and drug-sensitive
24.
In addition to PIK3CA mutations, EBV-positive tumours had
fre-quent ARID1A (55%) and BCOR (23%) mutations and only rare TP53
mutations. BCOR, encoding an anti-apoptotic protein, is also mutated
in leukaemia
25and medulloblastoma
26. Among the CIN tumours, we
ob-served TP53 mutations in 71% of tumours. CDH1 somatic mutations
were enriched in the genomically stable subtype (37% of cases). CDH1
germline mutations underlie hereditary diffuse gastric cancer (HDGC).
However, germline analysis revealed only two CDH1 polymorphisms,
neither of which is known to be pathogenic. As in the EBV-subtype,
in-activating ARID1A mutations were prevalent in the genomically stable
subtype. We identified mutations of RHOA almost exclusively in
gen-omically stable tumours, as discussed below.
We analysed the patterns of base changes within gastric cancer
tu-mours and noted elevated rates of C to T transitions at CpG
dinucleo-tides. We observed an elevated rate of A to C transversions at the 39
adenine of AA dinucleotides, especially at AAG trinucleotides, as reported
in oesophageal adenocarcinoma
27. The A to C transversions were
prom-inent in CIN, EBV and genomically stable, but as previously observed
27,
not in MSI tumours (Supplementary Fig. 3.10).
We identified RHOA mutation in 16 cases, and these were enriched
in the genomically stable subtype (15% of genomically stable cases, P 5
0.0039). RHOA, when in the active GTP-bound form, acts through a
variety of effectors, including ROCK1, mDIA and Protein Kinase N, to
control actin-myosin-dependent cell contractility and cellular motility
28,29and to activate STAT3 to promote tumorigenesis
30,31. RHOA mutations
were clustered in two adjacent amino-terminal regions that are
pre-dicted to be at the interface of RHOA with ROCK1 and other effectors
(Fig. 4a, b). RHOA mutations were not at sites analogous to oncogenic
mutations in RAS-family GTPases. Although one case harboured a
codon 17 mutation, we did not identify the dominant-negative G17V
mutations noted in T-cell neoplasms
32,33. Rather, the mutations found
in this study may act to modulate signalling downstream of RHOA.
Biochemical studies found that the RHOA Y42C mutation attenuated
activation of Protein Kinase N, without abrogated activation of mDia
or ROCK1
34. RHOA Y42, mutated in five tumours, corresponds to Y40
on HRAS, a residue which when mutated selectively reduces HRAS
ac-tivation of RAF, but not other RAS effectors
35. Given the role of RHOA
in cell motility, modulation of RHOA may contribute to the disparate
growth patterns and lack of cellular cohesion that are hallmarks of
dif-fuse tumours.
Dysregulated RHO signalling was further implicated by the
discov-ery of recurrent structural genomic alterations. Whole genome
sequenc-ing of 107 tumours revealed 5,696 structural rearrangements, includsequenc-ing
74 predicted to produce in-frame gene fusions (Supplementary
Infor-mation S3.7–3.8). De novo assembly of mRNA sequencing data confirmed
170 structural rearrangements (Supplementary Information S5.4a),
in-cluding two cases with an interchromosomal translocation between
CLDN18 and ARHGAP26 (GRAF). ARHGAP26 is a GTPase-activating
protein (GAP) that facilitates conversion of RHO GTPases to the GDP
state and has been implicated in enhancing cellular motility
34. CLDN18
GS
EBV MSI CIN PIK3CA
PIK3CA mutation Recurrent or in COSMIC Wild type Other mutations EBV 80% MSI 42% GS 11% CIN 3% 0 200 400 600 800 1,000
E9G R38H R88Q R93W R93Q 103−105EPV R108H K111E G118D K179E Y182H V243A N345K E365K C378R N380S R412Q C420R E453K G512 E542K E545K E545G Q546K Q546H E547K F744I Q879R K948E Y1021H Y1021C M1043I H1047Y H1047R
ABD RBD C2 Helical Kinase
CDKN2A methylation MLH1 methylation Subtype 1,315 CpG sites EBV CIMP Gastric
CIMP Cluster 3 Cluster 4 Tumours CpG island Promoter Normal stomach Yes Not available No Yes No MLH1,CDKN2A methylation MSI GS EBV CIN Subtype 0 1 β-value
a
b
Gene promoter, CpG island probeFigure 2
|
Molecular characteristics of EBV-positive gastric cancers. a, The
heatmap represents unsupervised clustering of DNA methylation at CpG sites
for 295 tumours into four clusters: EBV-CIMP (n 5 28), Gastric-CIMP
(n 5 77), cluster 3 (n 5 73) and cluster 4 (n 5 117). Profiles for non-malignant
gastric mucosa are to the left of the tumours. b, The proportion of tumours
harbouring PIK3CA mutation in the molecular subtypes with mutations at
sites noted recurrently in this data set or in the COSMIC database marked
separately (top). Locations of PIK3CA mutations with the subtype of the sample
with each mutation colour-coded (bottom).
b
a
–log10(q value) 0 20 60100 Syn Missense Splice site Nonsense 0.5 2.0
Frame shift In-frame indel Other non-syn
Syn Non-syn EBV GS CIN 0 4 8 12 Mutations Mutations per Mb 4% 3% 1% 2% 2% 3% 3% 4% 2% 5% 4% 1% 3% 4% 3% 4% 7% 6% 6% 14% 6% 12% 8% 11% 50% PTPRC ERBB2 EIF2C4 CNGA4 PLB1 FAM46D RASA1 SOHLH2 SMAD2 MACF1 CTNNB1 ABCA10 RNF43 BNC2 EYA4 BCOR APC MUC6 KRAS ARID1A RHOA PIK3CA SMAD4 CDH1 TP53
Figure 3
|
Significantly mutated genes in non-hypermutated gastric
cancer. a, Bars represent somatic mutation rate for the 215 samples with
synonymous and non-synonymous mutation rates distinguished by colour.
b, Significantly mutated genes, identified by MutSigCV, are ranked by the
q value (right) with samples grouped by subtype. Mutation colour indicates the
class of mutation.
is a component of the tight junction adhesion structures
36. RNA
sequenc-ing data from tumours without whole genome sequencsequenc-ing identified
CLDN18–ARHGAP26 fusions in 9 additional tumours, with two more
cases showing CLDN18 fusion to the homologous GAP encoded by
ARHGAP6 totalling 13 cases with these rearrangements
(Supplemen-tary Table 5.6).
The fusions linked exon 5 of CLDN18 to exon 2 (n 5 2) of ARHGAP6,
to exon 10 (n 5 1), or to exon 12 (n 5 10) of ARHGAP26 (Fig. 4c). As
these fusions occur downstream of the CLDN18 exon 5 stop codon,
they appeared unlikely to enable translation of fusion proteins.
How-ever, mRNA sequencing revealed a mature fusion transcript in which
the ARHGAP26 or ARHGAP6 splice acceptor activates a cryptic splice
site within exon 5 of CLDN18, before the stop codon, yielding an
in-frame fusion predicted to maintain the transmembrane domains of
CLDN18 while fusing a large segment of ARHGAP26 or ARHGAP6
to the cytoplasmic carboxy terminus of CLDN18. These chimaeric
pro-teins retain the carboxy-terminal GAP domain of ARHGAP26/6,
poten-tially affecting ARHGAP’s regulation of RHOA and/or cell motility.
Furthermore, these fusions may also disrupt wild-type CLDN18,
im-pacting cellular adhesion. The CLDN18–ARHGAP fusions were
mutu-ally exclusive with RHOA mutations and were enriched in genomicmutu-ally
stable tumours (62%, P 5 10
23) (Fig. 4d). Within the genomically
sta-ble subtype, 30% of cases had either RHOA or CLDN18–ARHGAP
alterations. Evaluation of gene expression status in pathways putatively
regulated by RHOA using the Paradigm-Shift algorithm predicted
acti-vation of RHOA-driven pathways (Supplementary Fig. 11.4a–c),
suggest-ing that these genomic aberrations contribute to the invasive phenotype
of diffuse gastric cancer.
SCNA analysis using GISTIC identified 30 focal amplifications, 45
focal deletions, and chromosome arms subject to frequent alteration
(Supplementary Figs 2.3–2.9). Focal amplifications targeted oncogenes
such as ERBB2, CCNE1, KRAS, MYC, EGFR, CDK6, GATA4, GATA6
and ZNF217. Additionally, we saw amplification of the gene that encodes
the gastric stem cell marker CD44 and a novel recurrent amplification
at 9p24.1 at the locus containing JAK2, CD274 and PDCD1LG2. JAK2
encodes a receptor tyrosine kinase and potential therapeutic target.
CD274 and PDCD1LG2 encode PD-L1 and PD-L2, immunosuppressant
proteins currently being evaluated as targets to augment anti-tumour
immune response. Notably, these 9p amplifications were enriched in
the EBV subgroup (15% of tumours), consistent with studies showing
elevated PD-L1 expression in EBV-positive lymphoid cancers
37,38.
Eval-uation of mRNA revealed elevated expression of JAK2, L1 and
PD-L2 in amplified cases (Supplementary Fig. 2.10). More broadly, PD-L1/2
expression was elevated in EBV-positive tumours, suggesting that
PD-L1/2 antagonists and JAK2 inhibitors be tested in this subgroup. Focal
deletions were identified at the loci of tumour suppressors such as PTEN,
SMAD4, CDKN2A and ARID1A. Additional GISTIC analysis on the
four molecular subtypes is detailed in Supplementary Figs 2.5–2.6.
Gene expression and proteomic analysis
Our analysis of each of the expression platforms revealed four mRNA,
five miRNA and three RPPA clusters (Supplementary Methods S5–S7).
Some expression clusters are similar across platforms (Supplementary
Methods S10) and/or have correspondence with specific molecular
subtypes. For example, mRNA cluster 1, miRNA cluster 4 and RPPA
cluster 1 have substantial overlap and are strongly associated with
gen-omically stable tumours, both individually and as a group; the 34 cases
with all three assignments were predominantly genomically stable (20/
34, P 5 2 3 10
28). Similarly, mRNA cluster 3, miRNA cluster 2 and
RPPA cluster 3 are similar and are associated with the MSI subtype as
a group (12/22, P 5 5 3 10
24). However, absolute correspondence
bet-ween expression clusters and molecular subtypes was not always seen.
For example, RPPA cluster 3 showed moderate association with both
MSI and EBV (P 5 0.018 and P 5 0.038, respectively), and miRNA
clus-ters each had similar proportions of CIN (no associations with P ,
0.05). Overall, the expression data recapitulate features of the
molecu-lar classification, pointing to robustness of this taxonomy.
We analysed mRNA sequence data for alternative splicing events,
finding MET exon 2 skipping in 82 of 272 (30%) cases, associated with
increased MET expression (P 5 10
24). We also found novel variants
of MET in which exons 18 and/or 19 were skipped (47/272; 17%;
Sup-plementary Fig. 5.5). Intriguingly, the exons removed by these
altera-tions encode regions of the kinase domain.
Through supervised analysis of RPPA data, we observed 45 proteins
whose expression or phosphorylation was associated with the four
mo-lecular subtypes (Supplementary Fig. 7.2). Phosphorylation of EGFR
(pY1068) was significantly elevated in the CIN subtype, consistent with
amplification of EGFR within that subtype. We also found elevated
ex-pression of p53, consistent with frequent TP53 mutation and aneuploidy
in the CIN subtype.
0 5 10 15 20 25 30 35 RHOA CLDN18-ARHGAP CDH1 Fraction altered (%) GS MSI EBV CIN Subtype n = 10 t(3;5)(q22;q31) Use of cryptic
splice site Spliced out
stop
AG|GTA ...TAAGT CAG|G
CLDN18 250 370 695 ARHGAP26 RhoGAP SH3 1 Exon 5 Exon 12 Exon 12 3′ UTR Intron 11 Exon 5 stop
GTATT...TAAGTT T CAG| 3
3′UTRUTRIntrIntronI on 1111
Intron 11 Exon 12 3′ UTR Exon 5 Chr 3 CLDN18 Chr 5 ARHGAP26
R5W G17E Y34C F39C E40K N41K Y42C Y42S L57V D59Y T60K A61D G62R G62E
Other Hotspot 1 Hotspot 2 Effector region
Hydrogen bond RHOA
0 20 40 60 80 100 120 140 160 180 RHOA 15% CLDN18–ARHGAP 15% CDH1 26% Lauren classification GS tumours
Diffuse Intestinal Mixed Hom. deletion Gene fusion Somatic mutation RHOA ROCK1 GTP analogue Other Hotspot 1 Hotspot 2 Hydrogen bond (Effector) a b c d e Y42 Y42 D59 D59 Y42 D59
Figure 4
|
RHOA and ARHGAP6/26 somatic genomic alterations are
recurrent in genomically stable gastric cancer. a, Missense mutations in the
GTPase RHOA, including residues Y42 and D59, linked via hydrogen bond
(red arc). b, Mutated regions (coloured as in panel a) mapped on the structures
of RHOA and ROCK1. c, A schematic of CLDN18–ARHGAP26 translocation is
shown for the fusion transcript and predicted fusion protein. SH3 denotes SRC
homology 3 domain. d, The frequency of RHOA and CDH1 mutations,
CLDN18–ARHGAP6 or ARHGAP26 fusions are shown across gastric cancer
subtypes. e, RHOA mutations and CLDN18–ARHGAP6 or ARHGAP26 fusions
are mutually exclusive in genomically stable tumours.
Integrated pathway analysis
We integrated SCNA and mutation data to characterize genomic
alter-ations in known signalling pathways, including candidate therapeutic
targets (Fig. 5a, b). We focused on alterations in receptor tyrosine kinases
(RTKs) and RAS and PI(3)-kinase signalling. EBV-positive tumours
contained PIK3CA mutations and recurrent JAK2 and ERBB2
ampli-fications. Although MSI cases generally lacked targetable
amplifica-tions, mutations in PIK3CA, ERBB3, ERBB2 and EGFR were noted, with
many mutations at ‘hotspot’ sites seen in other cancers (Supplementary
Fig. 11.14). Absent from MSI gastric cancers were BRAF V600E
muta-tions, commonly seen in MSI colorectal cancer
39. Although the
geno-mically stable subtype exhibited recurrent RHOA and CLDN18 events,
few other clear treatment targets were observed. In CIN tumours, we
identified genomic amplifications of RTKs, many of which are
amen-able to blockade by therapeutics in current use or in development.
Re-current amplification of the gene encoding ligand VEGFA was notable
given the gastric cancer activity of the VEGFR2 targeting antibody
ramucirumab
40. Additionally, frequent amplifications of cell cycle
me-diators (CCNE1, CCND1 and CDK6) suggest the potential for
thera-peutic inhibition of cyclin-dependent kinases (Supplementary Fig. 11.15).
We compared expression within each subtype to that of the other
subtypes, and to non-malignant gastric tissue (n 5 29) (Supplementary
Fig. 11.2). We computed an aggregate score for each pathway of the
NCI pathway interaction database
41and determined statistical
signifi-cance by comparison with randomly generated pathways
(Supplemen-tary Methods S11). Hierarchical clustering of samples and pathways
(Fig. 5c) revealed several notable patterns, including elevated
express-ion of mitotic network components such as AURKA/B and E2F,
tar-gets of MYC activation, FOXM1 and PLK1 signalling and DNA damage
response pathways across all subtypes, but to a lesser degree in
geno-mically stable tumours. In contrast, the genogeno-mically stable subtype
ex-hibited elevated expression of cell adhesion pathways, including the
B1/B3 integrins, syndecan-1 mediated signalling, and
angiogenesis-related pathways. These results suggest additional candidate therapeutic
targets, including the aurora kinases (AURKA/B) and Polo-like (PLK)
family members. The strength of IL-12 mediated signalling signatures
in EBV-positive tumours suggests a robust immune cell presence. When
coupled with evidence of PD-L1/2 overexpression, this finding adds
rationale for testing immune checkpoint inhibitors in EBV-positive
gastric cancer.
Discussion
Through this study of the molecular and genomic basis of gastric
can-cer, we describe a molecular classification (Fig. 6) that defines four major
genomic subtypes of gastric cancer: EBV-infected tumours; MSI tumours;
genomically stable tumours; and chromosomally unstable tumours. This
–5 0 5
FOXA2/FOXA3 transcription factor networks ARF6 trafficking events
HIF-1-alpha transcription factor network BMP receptor signalling
E2F/targets of cMyc activation FOXM1/PLK1 signalling Aurora A/B signalling
Regulation of retinoblastoma protein p53 pathway
Regulation of telomerase TCPTP Signalling ATM/ATR/BARD1 Fanconi anaemia pathway
VEGFR3 signalling in lymphatic endothelium Beta1/Beta3 integrin cell surface interactions Syndecan-1-mediated signalling Integrins in angiogenesis IL12-mediated signalling events Caspase cascade in apoptosis RANBP2-mediated transcriptional repression GS
EBV
Immune cell signalling
Cell migration Mitotic pathways MSI CIN 10% 2% 5% 4% EGFR 8% 9% 2% 0% FGFR2 5% 0% 11% 12% JAK2 8% 0% 14% 4% ERBB3 24% 7% 5% 12% ERBB2 8% 0% 3% 0% MET 18% 9% 25% 8% KRAS/NRAS 10% 9% 42% 72% PIK3CA 3% 0% 16% 4% RASA1 Inactivating Activating GENE CIN GS MSI EBV 7% 2% 25% 20% PTEN 1% 2% 6% 0% PIK3R1 MSI EBV GS CIN RHOA mutation CLDN18–ARHGAP Fusion 11% 17% 15% 6% 9% 6% 7% 6% 24% 3% 11% 17% EGFR ERBB2 ERBB3 JAK2/PD-L1/2 FGFR2 MET VEGFA KRAS/NRAS RASA1 PIK3CA PIK3R1 PTEN RTK-RAS PI3K 10%
Truncating mut. Missense mut. (recurrent or in COSMIC) Missense mut. (all other) Amplification Hom. deletion a
c b
Figure 5
|
Integrated molecular description of
gastric cancer. a, Mutations, copy-number
changes and translocations for select genes are
shown across samples organized by molecular
subtypes. Mutations that are recurrent in
this data set or in the COSMIC repository are
distinguished by colour. Alteration frequencies are
expressed as a percentage of all cases. b, Alterations
in RTK/RAS and RTK/PI(3)K signalling pathways
across molecular subtypes. Red denotes predicted
activation; blue denotes predicted inactivation.
c, The heatmap shows NCI-PID pathways that are
significantly elevated (red) or decreased (blue) in
each of the four subtypes as compared with
non-malignant gastric mucosa.
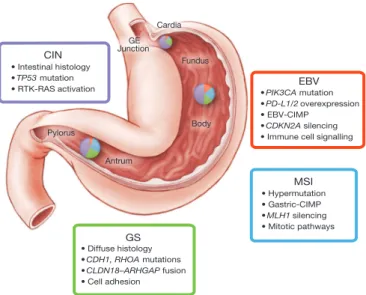
• PIK3CA mutation
• PD-L1/2 overexpression
• EBV-CIMP
• CDKN2A silencing
• Immune cell signalling
EBV • Hypermutation • Gastric-CIMP • MLH1 silencing • Mitotic pathways MSI GS • Diffuse histology • CDH1, RHOA mutations • CLDN18–ARHGAP fusion • Cell adhesion CIN • Intestinal histology • TP53 mutation • RTK-RAS activation Cardia Fundus Body Antrum Pylorus GE Junction
Figure 6
|
Key features of gastric cancer subtypes.
This schematic lists some
of the salient features associated with each of the four molecular subtypes of
gastric cancer. Distribution of molecular subtypes in tumours obtained from
distinct regions of the stomach is represented by inset charts.
classification may serve as a valuable adjunct to histopathology.
Impor-tantly, these molecular subtypes showed distinct salient genomic
fea-tures, providing a guide to targeted agents that should be evaluated in
clinical trials for distinct populations of gastric cancer patients. Through
existing testing for MSI and EBV and the use of emerging genomic assays
that query focused gene sets for mutations and amplifications, the
clas-sification system developed through this study can be applied to new
gastric cancer cases. We hope these results will facilitate the development
of clinical trials to explore therapies in defined sets of patients, ultimately
improving survival from this deadly disease.
METHODS SUMMARY
Fresh frozen gastric adenocarcinoma and matched germline DNA samples were obtained from 295 patients under IRB approved protocols. Genomic material and (when available) protein were subjected to single nucleotide polymorphism array somatic copy-number analysis, whole-exome sequencing, mRNA sequencing, miRNA sequencing, array-based DNA methylation profiling and reverse-phase protein arrays. A subset of samples was subjected to whole-genome sequencing. Initial analysis centred on the development of a classification scheme for gastric cancer. Subsequent analysis identified key features from each of the genomic/molecular platforms, looking both for features found across gastric cancer and those characteristic of individual gastric cancer subtypes. Primary and processed data are deposited at the Data Coordinating Center (https://tcga-data.nci.nih.gov/tcga/tcgaDownload. jsp); primary sequence files are deposited in CGHub (https://cghub.ucsc.edu/). Sample lists, and supporting data can be found at (https://tcga-data.nci.nih.gov/ docs/publications/stad_2014/).
Received 21 February; accepted 13 May 2014.
Published online 23 July; corrected online 10 September 2014 (see full-text HTML version for details).
1. Ferlay, J. et al. GLOBOCAN 2012 v1.0, cancer incidence and mortality worldwide. IARC CancerBase11, http://globocan.iarc.fr, accessed on January 15, 2014 (2013).
2. Laure´n, P. The two histological main types of gastric carcinoma: diffuse and so-called intestinal-type carcinoma. Acta Pathol., Microbiol. Scand.64, 31–49 (1965). 3. WHO Classification of Tumours of the Digestive System 4th edn (International
Agency for Research on Cancer, 2010).
4. Uemura, N. et al. Helicobacter pylori infection and the development of gastric cancer. N. Engl. J. Med.345, 784–789 (2001).
5. Bertuccio, P. et al. Recent patterns in gastric cancer: a global overview. International J. Cancer125, 666–673 (2009).
6. Richards, F. M. et al. Germline E-cadherin gene (CDH1) mutations predispose to familial gastric cancer and colorectal cancer. Hum. Mol. Genet.8, 607–610 (1999). 7. Keller, G. et al. Analysis for microsatellite instability and mutations of the DNA
mismatch repair gene hMLH1 in familial gastric cancer. International J Cancer68, 571–576 (1996).
8. Toyota, M. et al. Aberrant methylation in gastric cancer associated with the CpG island methylator phenotype. Cancer Res.59, 5438–5442 (1999).
9. Tan, I. B. et al. Intrinsic subtypes of gastric cancer, based on gene expression pattern, predict survival and respond differently to chemotherapy. Gastroenterology141, 476–485 (2011).
10. Lei, Z. et al. Identification of molecular subtypes of gastric cancer with different responses to PI3-kinase inhibitors and 5-fluorouracil. Gastroenterology145, 554–565 (2013).
11. Boussioutas, A. et al. Distinctive patterns of gene expression in premalignant gastric mucosa and gastric cancer. Cancer Res.63, 2569–2577 (2003). 12. Wang, K. et al. Exome sequencing identifies frequent mutation of ARID1A in
molecular subtypes of gastric cancer. Nature Genet.43, 1219–1223 (2011). 13. Shen, R., Olshen, A. B. & Ladanyi, M. Integrative clustering of multiple genomic data
types using a joint latent variable model with application to breast and lung cancer subtype analysis. Bioinformatics25, 2906–2912 (2009).
14. Murphy, G., Pfeiffer, R., Camargo, M. C. & Rabkin, C. S. Meta-analysis shows that prevalence of Epstein-Barr virus-positive gastric cancer differs based on sex and anatomic location. Gastroenterology137, 824–833 (2009).
15. Matsusaka, K. et al. Classification of Epstein–Barr virus-positive gastric cancers by definition of DNA methylation epigenotypes. Cancer Res.71, 7187–7197 (2011). 16. Geddert, H., Zur Hausen, A., Gabbert, H. E. & Sarbia, M. EBV-infection in cardiac and non-cardiac gastric adenocarcinomas is associated with promoter methylation of p16, p14 and APC, but not hMLH1. Anal. Cell. Pathol.33, 143–149 (2010). 17. Lee, J. et al. High-throughput mutation profiling identifies frequent somatic
mutations in advanced gastric adenocarcinoma. PLoS ONE7, e38892 (2012). 18. Sukawa, Y. et al. Alterations in the human epidermal growth factor receptor
2-phosphatidylinositol 3-kinase-v-Akt pathway in gastric cancer. World J. Gastroenterology18, 6577–6586 (2012).
19. Strong, M. J. et al. Differences in gastric carcinoma microenvironment stratify according to EBV infection intensity: implications for possible immune adjuvant therapy. PLoS Pathog.9, e1003341 (2013).
20. The Cancer Genome Atlas Network Comprehensive molecular characterization of human colon and rectal cancer. Nature487, 330–337 (2012).
21. Cancer Genome Atlas Research Network. Integrated genomic characterization of endometrial carcinoma. Nature497, 67–73 (2013).
22. Lawrence, M. S. et al. Mutational heterogeneity in cancer and the search for new cancer-associated genes. Nature499, 214–218 (2013).
23. Bernal, M., Ruiz-Cabello, F., Concha, A., Paschen, A. & Garrido, F. Implication of the b2-microglobulin gene in the generation of tumor escape phenotypes. Cancer Immunol. Immunother.61, 1359–1371 (2012).
24. Greulich, H. et al. Functional analysis of receptor tyrosine kinase mutations in lung cancer identifies oncogenic extracellular domain mutations of ERBB2. Proc. Natl Acad. Sci. USA109, 14476–14481 (2012).
25. Grossmann, V. et al. Whole-exome sequencing identifies somatic mutations of BCOR in acute myeloid leukemia with normal karyotype. Blood118, 6153–6163 (2011).
26. Pugh, T. J. et al. Medulloblastoma exome sequencing uncovers subtype-specific somatic mutations. Nature488, 106–110 (2012).
27. Dulak, A. M. et al. Exome and whole-genome sequencing of esophageal adenocarcinoma identifies recurrent driver events and mutational complexity. Nature Genet.45, 478–486 (2013).
28. Ridley, A. J. et al. Cell migration: integrating signals from front to back. Science302, 1704–1709 (2003).
29. Thumkeo, D., Watanabe, S. & Narumiya, S. Physiological roles of Rho and Rho effectors in mammals. Eur. J. Cell Biol.92, 303–315 (2013).
30. Aznar, S. et al. Simultaneous tyrosine and serine phosphorylation of STAT3 transcription factor is involved in Rho A GTPase oncogenic transformation. Mol. Biol. Cell12, 3282–3294 (2001).
31. Yu, H. & Jove, R. The STATs of cancer–new molecular targets come of age. Nature Rev. Cancer4, 97–105 (2004).
32. Palomero, T. et al. Recurrent mutations in epigenetic regulators, RHOA and FYN kinase in peripheral T cell lymphomas. Nature Genet.46, 166–170 (2014). 33. Sakata-Yanagimoto, M. et al. Somatic RHOA mutation in angioimmunoblastic
T cell lymphoma. Nature Genet.46, 171–175 (2014).
34. Doherty, G. J. et al. The endocytic protein GRAF1 is directed to cell-matrix adhesion sites and regulates cell spreading. Mol. Biol. Cell22, 4380–4389 (2011). 35. Joneson, T., White, M. A., Wigler, M. H. & Bar-Sagi, D. Stimulation of membrane
ruffling and MAP kinase activation by distinct effectors of RAS. Science271, 810–812 (1996).
36. Tu¨reci, O. et al. Claudin-18 gene structure, regulation, and expression is evolutionary conserved in mammals. Gene481, 83–92 (2011).
37. Chen, B. J. et al. PD-L1 expression is characteristic of a subset of aggressive B-cell lymphomas and virus-associated malignancies. Clinical Cancer Res19, 3462–3473 (2013).
38. Green, M. R. et al. Constitutive AP-1 activity and EBV infection induce PD-L1 in Hodgkin lymphomas and posttransplant lymphoproliferative disorders: implications for targeted therapy. Clinical Cancer Res18, 1611–1618 (2012). 39. The Cancer Genome Atlas Network Comprehensive molecular characterization of
human colon and rectal cancer. Nature487, 330–337 (2012).
40. Fuchs, C. S. et al. Ramucirumab monotherapy for previously treated advanced gastric or gastro-oesophageal junction adenocarcinoma (REGARD): an international, randomised, multicentre, placebo-controlled, phase 3 trial. Lancet 383, 31–39 (2014).
41. Schaefer, C. F. et al. PID: the pathway interaction database. Nucleic Acids Res.37, D674–D679 (2009).
Supplementary Information is available in the online version of the paper. Acknowledgements We are grateful to all the patients and families who contributed to this study and to C. Gunter and J. Weinstein for scientific editing, to M. Sheth for administrative support and to L. Omberg for support with the Sage Bionetworks Synapse platform. This work was supported by the Intramural Research Program and the following grants from the United States National Institutes of Health:
5U24CA143799, 5U24CA143835, 5U24CA143840, 5U24CA143843, 5U24CA143845, 5U24CA143848, 5U24CA143858, 5U24CA143866, 5U24CA143867, 5U24CA143882, 5U24CA143883, 5U24CA144025, U54HG003067, U54HG003079, U54HG003273 and P30CA16672. Author Contributions The Cancer Genome Atlas Research Network contributed collectively to this study. Biospecimens were provided by the tissue source sites and processed by the Biospecimen Core Resource. Data generation and analyses were performed by the genome-sequencing centres, cancer genome-characterization centres and genome data analysis centres. All data were released through the Data Coordinating Center. The NCI and NHGRI project teams coordinated project activities. The following TCGA investigators of the Stomach Analysis Working Group contributed substantially to the analysis and writing of this manuscript. Project leaders, A. J. Bass, P. W. Laird, I. Shmulevich; data coordinator, V. Thorsson; analysis coordinators, V. Thorsson, N. Schultz; manuscript coordinator, M. Sheth; graphics coordinator, T. Hinoue; DNA sequence analysis, A. Taylor-Weiner, A. Pantazi, C. Sougnez, K. Kasaian; mRNA analysis, R. Bowlby, A. J. Mungall; miRNA analysis, A. Chu, A. Gordon Robertson, D. Yang; DNA methylation analysis, T. Hinoue, H. Shen, P. W. Laird; copy number analysis, A. Cherniack; protein analysis, J.-S. Lee, R. Akbani; pathway/integrated analysis, N. Weinhold, S. Reynolds, C. Curtis, R. Shen, S. Ng, B. Raphael, H.-T. Wu, Y. Liu, V. Thorsson, N. Schultz; pathology expertise and clinical data, A. Boussioutas, B. G. Schneider, J. Kim, J. E. Willis, M. L. Gulley, K. Garman, M. Blanca Piazuelo, V. Thorsson, K. M. Leraas, T. Lichtenberg, J. A. Demchok, A. J. Bass; microbiome analysis, C. S. Rabkin, M. L. Gulley, R. Bowlby, A. J. Mungall, A. Chu and C. Pedamallu.
Author Information The primary and processed data used to generate the analyses presented here can be downloaded from The Cancer Genome Atlas at (https:// tcga-data.nci.nih.gov/tcga/tcgaDownload.jsp). All of the primary sequence files are deposited in CGHub and all other data are deposited at the Data Coordinating Center (DCC) for public access (http://cancergenome.nih.gov/) and (https://cghub.ucsc. edu/). Additional sample data and supporting data are available from (https:// tcga-data.nci.nih.gov/docs/publications/stad_2014/). Reprints and permissions information is available at www.nature.com/reprints. The authors declare no competing financial interests. Readers are welcome to comment on the online version of the paper. Correspondence and requests for materials should be addressed to A.J.B. (adam_bass@dfci.harvard.edu).
This work is licensed under a Creative Commons Attribution-NonCommercial-ShareAlike 3.0 Unported licence. The images or other third party material in this article are included in the article’s Creative Commons licence, unless indicated otherwise in the credit line; if the material is not included under the Creative Commons licence, users will need to obtain permission from the licence holder to reproduce the material. To view a copy of this licence, visit http://creativecommons. org/licenses/by-nc-sa/3.0
The Cancer Genome Atlas Research Network
Analysis Working Group: Dana-Farber Cancer Institute Adam J. Bass1;Institute for Systems Biology Vesteinn Thorsson2, Ilya Shmulevich2, Sheila M. Reynolds2, Michael Miller2, Brady Bernard2;University of Southern California Toshinori Hinoue3, Peter W. Laird3, Christina Curtis4, Hui Shen3, Daniel J. Weisenberger3;Memorial Sloan Kettering Cancer Center Nikolaus Schultz5, Ronglai Shen6, Nils Weinhold5, David P. Kelsen7;BC Cancer Agency Reanne Bowlby8, Andy Chu8, Katayoon Kasaian8, Andrew J. Mungall8, A. Gordon Robertson8, Payal Sipahimalani8;The Eli & Edythe L. Broad Institute Andrew D. Cherniack9
, Gad Getz9, Yingchun Liu9, Michael S. Noble9, Chandra Pedamallu9, Carrie Sougnez9, Amaro Taylor-Weiner9;MD Anderson Cancer Center Rehan Akbani10, Ju-Seog Lee10, Wenbin Liu10, Gordon B. Mills11, Da Yang12, Wei Zhang12;Harvard Medical School Angeliki Pantazi13, Michael Parfenov13;University of North Carolina Margaret Gulley14;Vanderbilt University M. Blanca Piazuelo15, Barbara G. Schneider15;Asan Medical Center Jihun Kim16;University of Melbourne Alex Boussioutas17;National Cancer Institute Margi Sheth18, John A. Demchok18, Charles S. Rabkin19;Case Western Reserve University Joseph E. Willis20;University of California at Santa Cruz Sam Ng21;Duke University Katherine Garman22;University of Michigan David G. Beer23;University of Pittsburgh Arjun Pennathur24;Brown University Benjamin J. Raphael25, Hsin-Ta Wu25;Brigham and Women’s Hospital Robert Odze26;National Cancer Center Hark K. Kim27;Nationwide Children’s Hospital Jay Bowen28, Kristen M. Leraas28, Tara M. Lichtenberg28, Stephanie Weaver28;Washington University Michael McLellan29;Greater Poland Cancer Centre Maciej Wiznerowicz30,KU Leuven: Ryo Sakai31
Genome Sequencing Center: The Eli & Edythe L. Broad Institute Gad Getz9, Carrie Sougnez9, Michael S. Lawrence9, Kristian Cibulskis9, Lee Lichtenstein9, Sheila Fisher9, Stacey B. Gabriel9, Eric S. Lander9;Washington University in St. Louis Li Ding29, Beifang Niu29
Genome Characterization Centers: BC Cancer Agency Adrian Ally8, Miruna Balasundaram8, Inanc Birol8, Reanne Bowlby8, Denise Brooks8, Yaron S. N. Butterfield8, Rebecca Carlsen8, Andy Chu8, Justin Chu8, Eric Chuah8, Hye-Jung E. Chun8, Amanda Clarke8, Noreen Dhalla8, Ranabir Guin8, Robert A. Holt8, Steven J. M. Jones8, Katayoon Kasaian8, Darlene Lee8, Haiyan A. Li8, Emilia Lim8, Yussanne Ma8, Marco A. Marra8, Michael Mayo8, Richard A. Moore8, Andrew J. Mungall8, Karen L. Mungall8, Ka Ming Nip8, A. Gordon Robertson8, Jacqueline E. Schein8, Payal Sipahimalani8, Angela Tam8, Nina Thiessen8;The Eli & Edythe L. Broad Institute Rameen Beroukhim9, Scott L. Carter9, Andrew D. Cherniack9, Juok Cho9, Kristian Cibulskis9, Daniel DiCara9, Scott Frazer9, Sheila Fisher9, Stacey B. Gabriel9, Nils Gehlenborg9, David I. Heiman9, Joonil Jung9, Jaegil Kim9, Eric S. Lander9, Michael S. Lawrence9, Lee Lichtenstein9, Pei Lin9, Matthew Meyerson9, Akinyemi I. Ojesina9, Chandra Sekhar Pedamallu9, Gordon Saksena9, Steven E. Schumacher9, Carrie Sougnez9, Petar Stojanov9, Barbara Tabak9, Amaro Taylor-Weiner9, Doug Voet9, Mara Rosenberg9, Travis I. Zack9, Hailei Zhang9, Lihua Zou9;Harvard Medical School/ Brigham & Women’s Hospital/MD Anderson Cancer Center Alexei Protopopov32, Netty Santoso13, Michael Parfenov13, Semin Lee33, Jianhua Zhang32, Harshad S. Mahadeshwar32, Jiabin Tang32, Xiaojia Ren13, Sahil Seth32, Lixing Yang33, Andrew W. Xu33, Xingzhi Song32, Angeliki Pantazi13, Ruibin Xi33, Christopher A. Bristow32, Angela Hadjipanayis13, Jonathan Seidman13, Lynda Chin32, Peter J. Park33, Raju
Kucherlapati13;MD Anderson Cancer Center Rehan Akbani10, Shiyun Ling10, Wenbin Liu10, Arvind Rao10, John N. Weinstein10, Sang-Bae Kim11, Ju-Seog Lee11, Yiling Lu11, Gordon Mills11;University of Southern California Epigenome Center Peter W. Laird3 , Toshinori Hinoue3, Daniel J. Weisenberger3, Moiz S. Bootwalla3, Phillip H. Lai3, Hui Shen3, Timothy Triche Jr3, David J. Van Den Berg3;The Sidney Kimmel Comprehensive Cancer Center at Johns Hopkins University Stephen B. Baylin34, James G. Herman34
Genome Data Analysis Centers: The Eli & Edythe L. Broad Institute Gad Getz9, Lynda Chin32, Yingchun Liu9, Bradley A. Murray9, Michael S. Noble9;Memorial
Sloan-Kettering Cancer Center B. Arman Askoy5, Giovanni Ciriello5, Gideon Dresdner5, Jianjiong Gao5, Benjamin Gross5, Anders Jacobsen5, William Lee5, Ricardo Ramirez5,
Chris Sander5, Nikolaus Schultz5, Yasin Senbabaoglu5, Rileen Sinha5, S. Onur Sumer5, Yichao Sun5, Nils Weinhold5;Institute for Systems Biology Ve´steinn Thorsson2, Brady Bernard2, Lisa Iype2, Roger W. Kramer2, Richard Kreisberg2, Michael Miller2, Sheila M. Reynolds2, Hector Rovira2, Natalie Tasman2, Ilya Shmulevich2;University of California, Santa Cruz Sam Ng21, David Haussler21, Josh M. Stuart21;MD Anderson Cancer Center Rehan Akbani10, Shiyun Ling10, Wenbin Liu10, Arvind Rao10, John N. Weinstein10, Roeland G. W. Verhaak32, Gordon B. Mills11;Brown University Mark D. M. Leiserson25, Benjamin J. Raphael25, Hsin-Ta Wu25;University of California San Francisco Barry S. Taylor35
Biospecimen Core Resource: The Research Institute at Nationwide Children’s Hospital Aaron D. Black28, Jay Bowen28, Julie Ann Carney28, Julie M. Gastier-Foster28, Carmen Helsel28, Kristen M. Leraas28, Tara M. Lichtenberg28, Cynthia McAllister28, Nilsa C. Ramirez28, Teresa R. Tabler28, Lisa Wise28, Erik Zmuda28;International Genomics Consortium Robert Penny36, Daniel Crain36, Johanna Gardner36, Kevin Lau36, Erin Curely36, David Mallery36, Scott Morris36, Joseph Paulauskis36, Troy Shelton36, Candace Shelton36, Mark Sherman36
Tissue Source Sites: Buck Institute for Research on Aging Christopher Benz37; Chonnam National University Medical School Jae-Hyuk Lee38;City Clinical Oncology Dispensary Konstantin Fedosenko39, Georgy Manikhas39;Cureline Olga Potapova40, Olga Voronina40, Dmitry Belyaev40, Oleg Dolzhansky40;UNC Lineberger
Comprehensive Cancer Center W. Kimryn Rathmell41;Greater Poland Cancer Centre Jakub Brzezinski30, Matthew Ibbs30, Konstanty Korski30, Witold Kycler30, Radoslaw Łaz´niak30, Ewa Leporowska30, Andrzej Mackiewicz30, Dawid Murawa30, Pawel Murawa30, Arkadiusz Spychała30, Wiktoria M. Suchorska30, Honorata Tatka30, Marek Teresiak30, Maciej Wiznerowicz30;Helen F. Graham Cancer Center & Research Institute Raafat Abdel-Misih42, Joseph Bennett42, Jennifer Brown42, Mary Iacocca42, Brenda Rabeno42;Keimyung University School of Medicine Sun-Young Kwon43; International Genomics Consortium Robert Penny36, Johanna Gardner36, Ariane Kemkes36, David Mallery36, Scott Morris36, Troy Shelton36, Candace Shelton36, Erin Curley36;Ontario Tumour Bank Iakovina Alexopoulou44, Jay Engel45, John Bartlett46, Monique Albert46;Pusan National University Hospital Do-Youn Park47;University of Pittsburgh School of Medicine Rajiv Dhir24, James Luketich24, Rodney Landreneau24 Disease Working Group: Memorial Sloan-Kettering Cancer Center Yelena Y. Janjigian7, David P. Kelsen7, Eunjung Cho48, Marc Ladanyi48, Laura Tang48;Duke University Shannon J. McCall49;Asan Medical Center Young S. Park16;Yonsei University College of Medicine Jae-Ho Cheong50;MD Anderson Cancer Center Jaffer Ajani51;National Cancer Institute M. Constanza Camargo19
Data Coordination Center: SRA International Shelley Alonso52, Brenda Ayala52, Mark A. Jensen52, Todd Pihl52, Rohini Raman52, Jessica Walton52, Yunhu Wan52 Project Team: National Cancer Institute John A. Demchok18, Greg Eley18, Kenna R. Mills Shaw18, Margi Sheth18, Roy Tarnuzzer18, Zhining Wang18, Liming Yang18, Jean Claude Zenklusen18, Tanja Davidsen53, Carolyn M. Hutter54, Heidi J. Sofia54; SAIC-Frederick Robert Burton55, Sudha Chudamani55& Jia Liu55 1
Department of Medical Oncology and the Center for Cancer Genome Discovery, Dana-Farber Cancer Institute, Boston, Massachusetts 02215, USA.2
Institute for Systems Biology, Seattle, Washington 98109, USA.3
USC Epigenome Center, University of Southern California, Los Angeles, California 90033, USA.4
University of Southern California, Department of Preventive Medicine, USC/Norris Comprehensive Cancer Center, Los Angeles, California 90033, USA.5
Computational Biology Center, Memorial Sloan-Kettering Cancer Center, New York, New York 10065, USA.6
Department of Epidemiology and Biostatistics, Memorial Sloan-Kettering Cancer Center, New York, New York 10065, USA.7
Department of Medicine, Memorial Sloan-Kettering Cancer Center, 1275 York Avenue, New York, New York 10021, USA.8
Canada’s Michael Smith Genome Sciences Centre, BC Cancer Agency, Vancouver, BC V5Z 4S6, Canada.9
The Eli and Edythe L. Broad Institute, Cambridge, Massachusetts 02142, USA.10
Department of Bioinformatics and Computational Biology, University of Texas MD Anderson Cancer Center, Houston, Texas 77030, USA.11
Department of Systems Biology, University of Texas MD Anderson Cancer Center, Houston, Texas 77030, USA.12
Department of Pathology, University of Texas MD Anderson Cancer Center, Texas 77030, USA. 13
Department of Medicine, Harvard Medical School, Boston, Massachusetts 02215, USA. 14
Department of Pathology and Laboratory Medicine, University of North Carolina-Chapel Hill, Chapel Hill, Chapel Hill, North Carolina 27599, USA.15
Department of Medicine, Vanderbilt University Medical Center, 2215 Garland Avenue, Nashville, Tennessee 37232, USA.16
Department of Pathology, University of Ulsan College of Medicine, Asan Medical Center, Seoul, 138-736, South Korea.17
Sir Peter MacCallum Cancer Department of Oncology, University of Melbourne, East Melbourne 3002, Australia.18
National Cancer Institute, Bethesda, Maryland 20892, USA.19
Division of Cancer Epidemiology and Genetics, National Cancer Institute, Bethesda, Maryland 20892, USA.20
Department of Pathology, Case Western Reserve University, Cleveland, Ohio 44106, USA.21
Department of Biomolecular Engineering and Center for Biomolecular Science and Engineering, University of California-Santa Cruz, Santa Cruz, California 95064, USA.22
Division of Gastroenterology, Department of Medicine, Duke University, Durham, North Carolina 27710, USA.23
Department of Thoracic Surgery, University of Michigan Cancer Center, Ann Arbor, Michigan 48109, USA.24
University of Pittsburgh, Pittsburgh, Pennsylvania 15213, USA.25
Department of Computer Science & Center for Computational Molecular Biology, Brown University, 115 Waterman Street, Providence, Rhode Island 02912, USA. 26
Department of Pathology, Brigham and Women’s Hospital, 75 Francis Street, Boston, Massachusetts 02115, USA.27
Korea.28
The Research Institute at Nationwide Children’s Hospital, Columbus, Ohio 43205, USA.29
The Genome Institute, Washington University, St Louis, Missouri 63108, USA.30
Greater Poland Cancer Centre, Garbary, 15, 61-866, Poznan, Poland.31 KU Leuven, Department of Electrical Engineering-ESAT (STADIUS), Leuven, Belgium. 32
Institute for Applied Cancer Science, Department of Genomic Medicine, University of Texas MD Anderson Cancer Center, Houston, Texas 77054, USA.33
The Center for Biomedical Informatics, Harvard Medical School, Boston, Massachusetts 02115, USA. 34
Cancer Biology Division, Johns Hopkins University, Baltimore, Maryland 21231, USA. 35
Helen Diller Family Comprehensive Cancer Center, University of California-San Francisco, San Francisco, California 94143-0128, USA.36
International Genomics Consortium, Phoenix, Arizona 85004, USA.37
Buck Institute for Research on Aging, Novato, California 94945, USA.38
Chonnam National University Medical School, Gwangju, 501-746, Republic of Korea.39
City Clinical Oncology Dispensary, Saint Petersburg 198255, Russia.40
Cureline, Inc., South San Francisco, California 94080, USA. 41
Departments of Medicine and Genetics, University of North Carolina at Chapel Hill, Chapel Hill, North Carolina 27599, USA.42
Helen F. Graham Cancer Center & Research
Institute, Christiana Care Health System, Newark, Delaware 19713, USA.43 Keimyung University School of Medicine, Daegu, 700-712, Republic of Korea.44
Ontario Tumour Bank - Hamilton site, St. Joseph’s Healthcare Hamilton, Hamilton, Ontario L8N 3Z5, Canada.45
Ontario Tumour Bank - Kingston site, Kingston General Hospital, Kingston, Ontario K7L 5H6, Canada.46
Ontario Tumour Bank, Ontario Institute for Cancer Research, Toronto, Ontario M5G 0A3, Canada.47
Pusan National University Hospital, Busan, 602-739, Republic of Korea.48
Department of Pathology, Memorial Sloan-Kettering Cancer Center, New York, New York 10065, USA.49
Department of Pathology, Duke University, Durham, North Carolina 27710, USA.50
Department of Surgery, Yonsei University College of Medicine, Seoul, 120-752, Republic of Korea. 51
Department of Gastrointestinal Medical Oncology, University of Texas MD Anderson Cancer Center, Houston, Texas 77030, USA.52
SRA International, Fairfax, Virginia 22033, USA.53
Center for Biomedical Informatics and Information Technology, National Cancer Institute, Rockville, Maryland 20850, USA.54
National Human Genome Research Institute, Bethesda, Maryland 20892, USA.55
SAIC-Frederick, Inc., Frederick, Maryland 21702, USA.